Ion Chemistry Laboratory
Centre for Research in Mass Spectrometry
Centre for Research in Mass Spectrometry
Ion Chemistry Laboratory Centre for Research in Mass Spectrometry |
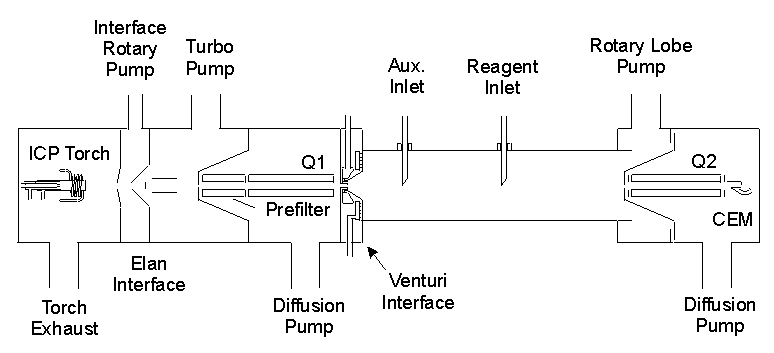
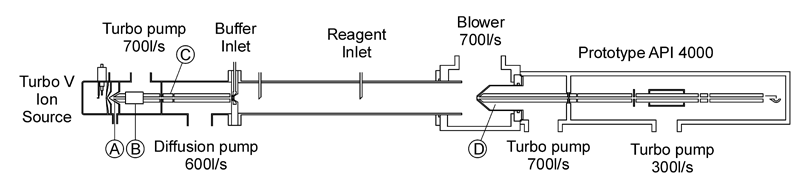
Selected Ion Flow Tube Mass SpectrometrySelected-Ion Flow-Tube Mass Spectrometry is the experimental technique of choice in the Ion Chemistry Laboratory at York University. Selected ions are created upstream of the flow tube and detected downstream along with product ions. Reagent molecules are added midstream and react for a fixed period of time before product ions are sampled. The amount of added reagent can be changed and is the variable that allows the measurement of reaction rate coefficients using pseudo-first-order reaction kinetics. The instrument is modular in nature allowing for the interchange of various ion sources and the interchange of detection mass spectrometers (for example, it is planned to interchange the current detection single-quadrupole mass filter with a triple quadrupole). Details of Operation
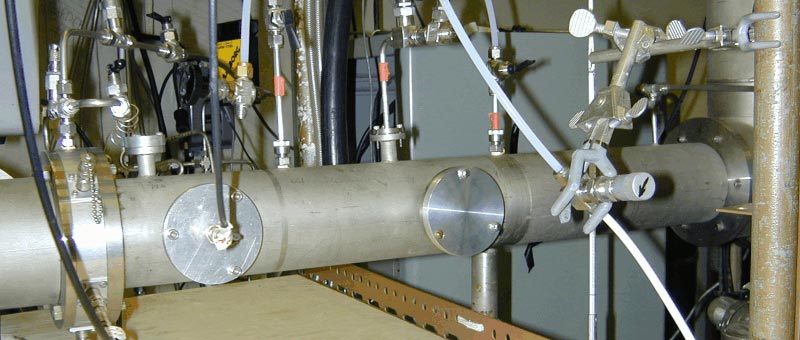
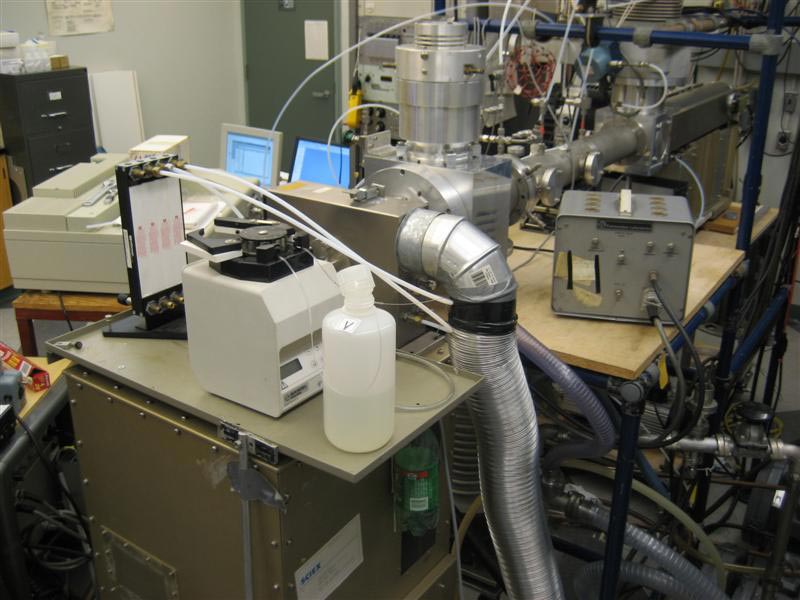
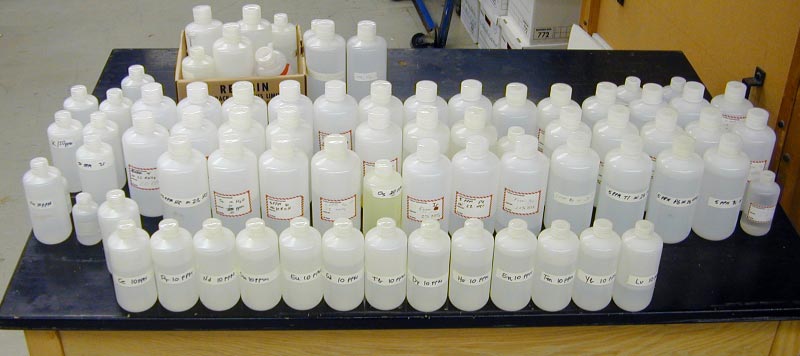
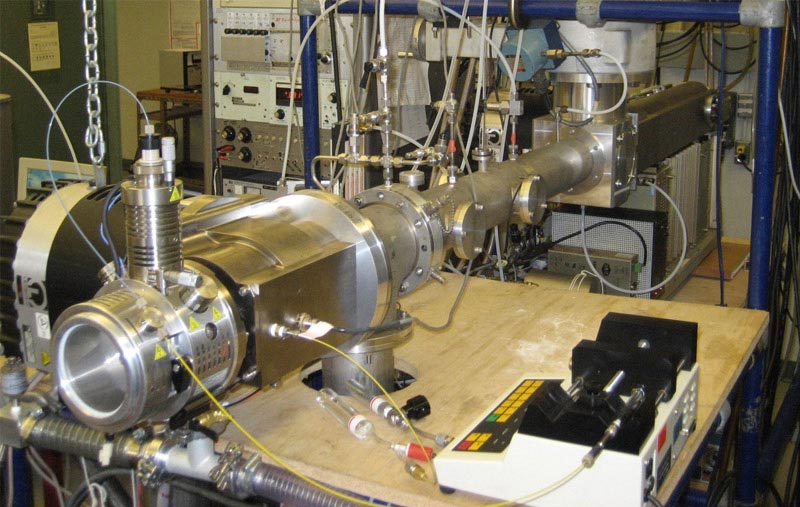
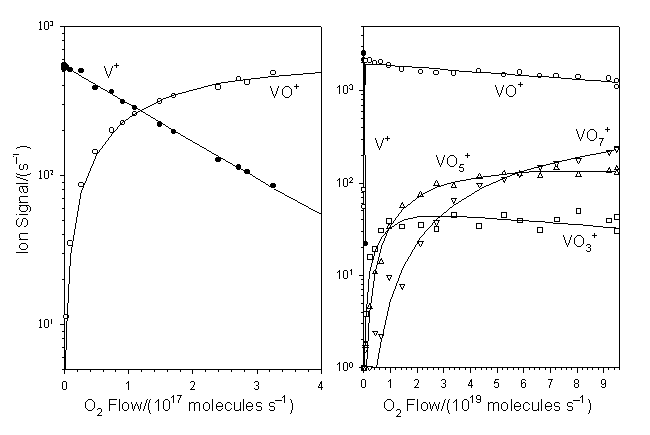
Figure 1: The ICP/SIFT instrument. Photo 1: The flow tube region of the SIFT. Photo 2: Overview of ICP/SIFT/QqQ instrument (January 2007). Photo 3: Our periodic table of metal solutions for the ICP ion source. Figure 2: The ESI/SIFT/QqQ instrument. Schematic of the details of the ESI/qQ/SIFT/QqQ instrument. Photo 4: Schematic of the details of the ES/qQ/SIFT/QqQ instrument. Reaction ProfilesProduct and reactant ion intensities are plotted versus neutral flow to yield a reaction profile. On a semi-log plot the primary reagent ion decay should lie along a straight line (see Figure 2). The slope of the reagent ion decay is proportional to the reaction rate co-efficient. Rate constants for secondary (and higher) reactions are determined by fitting the ion signal rise (and decay) to the appropriate rate expression. Figure 3: Kinetics profile for
V+ reacting with O2. Low flow
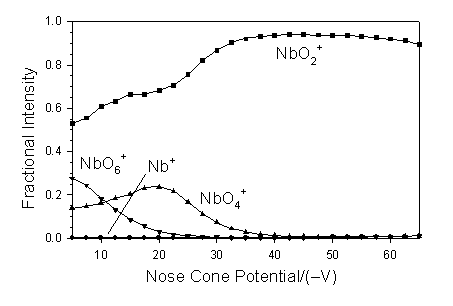
experiment (left) and high flow experiment (right). Multi-collision Induced DissociationCourse structural and bond energy information can be determined by varying the electric potential applied to the nose cone in front of Q2. As the nose cone potential is made more negative positive ions are accelerated through the buffer gas with increased velocities. Multiple collisions with the buffer gas slowly build the internal vibrational and rotational energy of the ion until dissociation occurs. Plotting dissociation product intensities versus applied nose cone potential yields information regarding relative bond energies within the collided ion. To access higher center-of-mass energy regimes, Argon, Krypton and occasionally Xenon are added to the buffer gas. Figure 4: Multi-collision induced
dissociation of NbO6+ yielding
NbO2+ via the intermediate
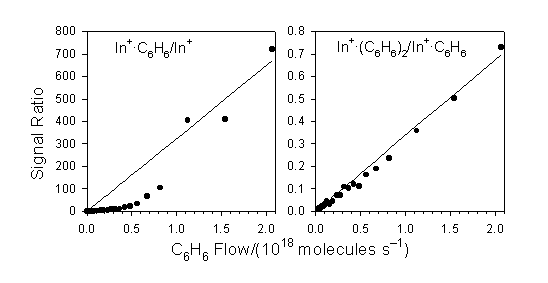
NbO4+. Equilibrium KineticsWhen clustering reactions proceed to equilibrium the ratio of product ion intensity to reactant ion intensity plotted versus neutral flow (or concentration) can yield a lower limit to the reaction equilibrium constant (Keq) and thus an upper limit to the reaction Standard Free Energy change ΔG° –ΔG° = RT ln(Keq) If a reaction entropy change is estimated then a reaction enthalpy change can be determined from the well known equation ΔG° = ΔH° – TΔS° Figure 5: Ratio plots for the
reaction of In+ reacting with
C6H6 to produce
In+&·C6H6 and
In+·(C6H6)2. Reaction Profiles Figure 6: Measured ion profiles for
the reactions of common ESI chemical background ions with dimethyl
disulfide (DMDS). Quantum Chemical ComputationsTo supplement the coarse structural and bond energy information provided by multi-collision induced dissociation experiments and the reaction Free Energy determinations provided by equilibrium kinetics experiments, quantum chemical computations can be performed. Past collaborations have involved the research groups headed by Dr. A.C. Hopkinson at York University and by Dr. H. Schwarz at the Technical University of Berlin. |
| Ion Chemistry Laboratory, York University | 4700 Keele Street, Toronto, Ontario M3J 1P3 |