4. Duration and Immunization
This Chapter is dedicated to the study of the sensitivity of the price of bonds and portfolios of bonds to the changes in the interest rates. A measure of the sensitivity of bond prices to changes in interest rates, called Duration, was first suggested by Macaulay in 1938. The field of fixed income securities has evolved tremendously since that time (as briefly touched upon in the Preface) and the academic literature now criticizes this measure. As we proceed with the development and understanding of this measure we will also gain an insight into this critique.
Despite the criticisms, we have decided to dedicate a chapter to this issue because Duration is intimately related to risk management of bond portfolios. And while risk management methods that are based on durations are also subject to the same critique, empirical observations prove these methods to be quite successful. The literature mentions that pension funds and insurance companies that have used such methods over a few decades rarely missed their goals. Furthermore, we believe that this chapter will significantly help in developing the readers' intuitions about interest rate risk, volatility of bond prices and thereby will pave the road to more advanced models that are beyond the scope of this book.
4.1 Duration: a sensitivity measure of bonds' prices to changes in interest rates
Our starting point is the definition of Duration and its intuitive motivation. We start by assuming that the term structure is flat but soon we will see that this assumption can be easily relaxed. That is, the rate spanning one period, the time interval ![]() is
is ![]() , hence a dollar invested for
, hence a dollar invested for ![]() periods of time will grow to
periods of time will grow to ![]() . For simplicity we assume in this section that interest rate are reported based on annual compounding and think about a period as a year.
. For simplicity we assume in this section that interest rate are reported based on annual compounding and think about a period as a year.
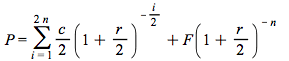
Let ![]() be the cash flow (coupon or coupon plus principal at maturity) from a bond at time
be the cash flow (coupon or coupon plus principal at maturity) from a bond at time ![]() , where
, where ![]() is the maturity time of the bond. The no-arbitrage condition implies that the price of the bond
is the maturity time of the bond. The no-arbitrage condition implies that the price of the bond ![]() is given by
is given by

(4.1)
where interest rate are reported as explained above. Denoting ![]() by
by ![]() and substituting it in the above equation yields:
and substituting it in the above equation yields:

(4.2)
In this simplistic model the affect of the change in the interest rate (in ![]() ) on the price of the bond can be measured by the derivative of
) on the price of the bond can be measured by the derivative of  with respect to
 ![]() , i.e., by
, i.e., by ![]() . Note that since
. Note that since ![]() than
than![]()
 and it is given by:
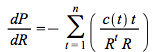
(4.3)
Before we continue further we would like to make our first observation. Since the bond payments are all positive i.e., ![]() and so is
and so is ![]() , one can easily verify that the expression above is negative. Hence our first conclusion is that since
, one can easily verify that the expression above is negative. Hence our first conclusion is that since ![]() P is a decreasing function of r , i.e., bond prices increase when interest rates decrease and vice versa. This is of course a direct consequence of the first derivative being negative. A further look confirms that indeed the present value of a positive cash flow decreases as the interest rate increases. The present value of a (positive) future amount is calculated by multiplying it by the discount factor
P is a decreasing function of r , i.e., bond prices increase when interest rates decrease and vice versa. This is of course a direct consequence of the first derivative being negative. A further look confirms that indeed the present value of a positive cash flow decreases as the interest rate increases. The present value of a (positive) future amount is calculated by multiplying it by the discount factor ![]() so as
so as ![]() increases, the discount factor decreases and hence the result.
increases, the discount factor decreases and hence the result.
Traditionally the sensitivity of bond prices to changes in the interest rate is measured in percentage terms. However before presenting it in the classical way we would like to highlight the concept behind this traditional presentation. Thinking about the price of the bond as a function of the interest rate (since the present value is a function of ![]() ), it is possible to approximate the change in a bond price due to a change in the interest rate. The approximation is based on a first order Taylor series (see
Taylor series
) that uses only the first derivative of the approximated function. We will use it again with higher order derivatives when we look at generalized durations. However for the current derivation we only need the fact that if the price of the bond
), it is possible to approximate the change in a bond price due to a change in the interest rate. The approximation is based on a first order Taylor series (see
Taylor series
) that uses only the first derivative of the approximated function. We will use it again with higher order derivatives when we look at generalized durations. However for the current derivation we only need the fact that if the price of the bond ![]() , is represented as a function of
, is represented as a function of ![]() i.e. as
i.e. as ![]() where
where ![]() is its first derivative and if there is a change in
is its first derivative and if there is a change in ![]() represented by
represented by ![]() , then
, then ![]() can be linearly approximated by
can be linearly approximated by
![]()
(4.4)
This approximation can be visualized graphically but first let us look at a numerical example. To this end we defined a function that calculates the price of a bond, with semi-annual payments, a face value of $100, a coupon rate of ![]() ( i.e., each coupon payment is
( i.e., each coupon payment is ![]() ) maturing in
) maturing in ![]() years from now (that is the next coupon is paid in 6 months). Thus the parameter of this function are
years from now (that is the next coupon is paid in 6 months). Thus the parameter of this function are ![]() ,
, ![]() and
and ![]() That is, for
That is, for ![]() coupon rate of c and interest rate of r the price is;
coupon rate of c and interest rate of r the price is;
| > | BondPrice(c,r,2); |
| > |
The generic formula is
| > | BondPrice(c,r,n); |
 |
| > |
Note that Maple presented the expression  where
where ![]() , in a compact form based on it being a geometric series. For n=5 the result will be:
, in a compact form based on it being a geometric series. For n=5 the result will be:
| > | BondPrice(c,r,5); |
| > |
Hence the price of a bond with a coupon payment of 5% when the interest rate is 7% maturing in 5 years can be calculated as:
| > | BondPrice(.05,.07,5); |
| > |
Changes in interest rates are traditionally measured in basis points (bps). One basis point is defined to be 1/100th of 1%. Hence 1% change equals change of 100 bps. If the interest rate changes from 7% to 8%, a change of 100 bps, the price of the bond will be
| > | BondPrice(.05,.08,5); |
In this case![]() is 0.01 in order to use first order Taylor linear approximation there is a need to know
is 0.01 in order to use first order Taylor linear approximation there is a need to know ![]() . This is done below; note that
. This is done below; note that ![]() ' calculates the derivative with respect to
' calculates the derivative with respect to ![]() and the 'subs' command calculates its value at the point
and the 'subs' command calculates its value at the point ![]() )
)
| > | diff(BondPrice(.05,r,5),r); |
| > | subs(r=.07,diff(BondPrice(.05,r,5),r)); |
Thus the approximation to the change in the price is the product of ![]()
| > | -384.0525897*0.01; |
Putting it all together utilizing (4.4) the approximation of the bond’s price after the change in the interest rate is:
![]()
(4.5)
| > | BondPrice(.05,.07,5)+subs(r=.07,diff(BondPrice(.05,r,5),r))*.01; |
| > |
We see that the approximated value of 88.311 is not that far from the true value of 88.413. The reader can recalculate the example above for different values of the parameters, i.e.,![]() and
and ![]() .
.
This approximation can be visualized as a function of ![]() - the rate after the change, when the current interest rate is
- the rate after the change, when the current interest rate is ![]() and
and
![]()
![]() , by the graph of the linear function
, by the graph of the linear function

(4.6)
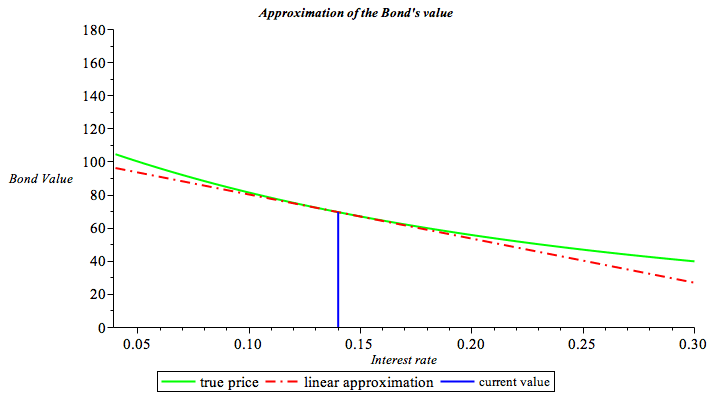
A large value of ![]() is chosen to make it more pronounced, the chosen parameters are
is chosen to make it more pronounced, the chosen parameters are ![]() =0.14 c=0.05 and n=5. For these values the price of the bond is
=0.14 c=0.05 and n=5. For these values the price of the bond is
| > | BondPrice(.05,0.14,5); |
and the figure that visualizes this approximation as in (4.6) is presented below:
| > | plot([BondPrice(.05,r,5),BondPrice(.05,.14,5)+(r-0.14)*subs(r=.14,diff(BondPrice(.05,r,5),r)),[[0.14,0],[0.14,BondPrice(.05,.14,5)]]],r=0.04...0.30,y=0..180,color=[green,red,blue],labels=[`Interest rate`,`Bond Price`],title=`Approximation of the Bond's value `,thickness=2,titlefont=[TIMES,BOLD,10]); |
 |
| > |
The solid (green) graph is the true value of the bond as a function of the interest rate. The dash-dot (red) graph is the approximation of the value of the bond after the change in the interest rate. It is the line tangent to the red graph at r=0.14 at the intersection of the blue perpendicular line with the red and the green lines. Hence, the slope of the dash-dot (red) graph is the derivative of the solid (green) graph at the point r=0.14. If the interest rate does not change ( ![]() ) we see that the approximation and the true value coincide.
) we see that the approximation and the true value coincide.
Note that the smaller that change in in the rate the better the linear approximation is. However, as the change gets bigger, a gap is opening between the true value (the solid green graph) and the approximation ( the dash-dot red graph). This gap is due to the true value not being a linear function of the interest rate. In this setting, the true value is in fact a convex function of the interest rate. For this reason, as we will see henceforth, the expression that is added to make the approximation more precise is termed 'convexity'.
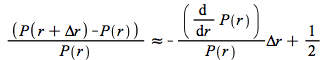
Let us see how this result can be presented in terms of percentage changes. To this end we denote ![]() by
by ![]() in equation (4.4)
in equation (4.4)
![]()
and write it as
![]() .
.
(4.7)
Recall that for ![]() and
and 
Thus
 .
.
(4.8)
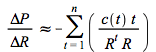
Dividing (4.8) by  and multiplying it by
 ![]() we obtain
we obtain

(4.9)
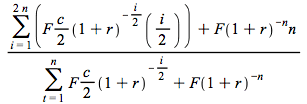
Defining 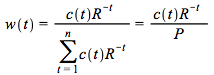 equation (4.9) can be written as :
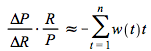
(4.10)
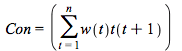
Notice that ![]() ,
, ![]() and that
and that  , hence,
  can be interpreted as the weighted average of the time of the payment dates of the bond. The weight of time
 ![]() is the present value of the payment at
is the present value of the payment at ![]() divided by the present value of all the payments -- the price. Note also that in our convention the current time is time zero so time
divided by the present value of all the payments -- the price. Note also that in our convention the current time is time zero so time ![]() is actually the length of the time period from now to
is actually the length of the time period from now to ![]() . Consequently,
. Consequently,  , is the weighted average of the length of times to the payment dates.
One may think of a coupons paying bond as maturing gradually, after all, it pays coupons along its life so it is not really maturing at one point in time -- the time of the last coupon (and the face value) payment. Hence,  is the average 'duration' of the bond and
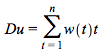
(4.11)
is defined to be the duration of a bond. Consequently the approximation can be written in terms of the bond's duration as
![]()
(4.12)
In words, the percentage change in the price of the bond ![]() , is minus its duration
, is minus its duration  , multiplied by the percentage change in R,
 ![]() .
.
Thus the effect of the change in the interest rate is measured, in this simplistic model, by the duration of the bond. The minus sign indicates that an increase in the interest rate causes a decrease in the price of the bond. Since the change in ![]() is a consequence of the change in
is a consequence of the change in ![]() and
and ![]() we can rewrite (4.12) as
we can rewrite (4.12) as
![]() , or
, or ![]()
(4.13)
In words we can restate it as the percentage change in the price of a bond is inversely related to the percentage change in the interest rate in the following way: an increase (decrease) of one percent in 1+r causes a decrease (increase) of ![]() percent in the price of the bond. The interpretation of duration as the weighted average of the time of the payment dates of the bond implies that the duration of a portfolio of bonds is the weighted average of the durations of the bonds in the portfolio. The weight of the duration of each bond is the price of the bond divided by the price of the portfolio. One of the exercise at the end of the chapter ask the reader to prove this property.
percent in the price of the bond. The interpretation of duration as the weighted average of the time of the payment dates of the bond implies that the duration of a portfolio of bonds is the weighted average of the durations of the bonds in the portfolio. The weight of the duration of each bond is the price of the bond divided by the price of the portfolio. One of the exercise at the end of the chapter ask the reader to prove this property.
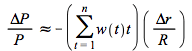
If we define a modified duration
![]()
(4.14)
than
![]()
(4.15)
which verbally can be conveyed by saying that an increase (decrease) of ![]() in the flat term structure causes a decrease (increase) of
in the flat term structure causes a decrease (increase) of ![]() percent in the bond price. Similarly the change in the bond's price can be written as
percent in the bond price. Similarly the change in the bond's price can be written as
![]() ,
,
(4.16)
and the price after the change is
![]()
(4.17)
Let us look at a few numerical examples. To help us in the calculation we have a function Dur(c,r,n,F), that calculates the duration of a bond where ![]() is the coupon rate (paid semiannually),
is the coupon rate (paid semiannually), ![]() is the term structure of the interest rate (assumed to be flat for now),
is the term structure of the interest rate (assumed to be flat for now), ![]() is the number of years until maturity where the time to the next coupon is 6 months. For simplicity the function Dur(c,r,n,F) calculates the duration assuming that the interest rate is reported as the simple annual rate, coupons are paid semiannually and
is the number of years until maturity where the time to the next coupon is 6 months. For simplicity the function Dur(c,r,n,F) calculates the duration assuming that the interest rate is reported as the simple annual rate, coupons are paid semiannually and ![]() is the face value of the bond, i.e. it calculates Footnote1
is the face value of the bond, i.e. it calculates Footnote1
(4.18)
Thus the equation for the duration of a bond with a coupon rate of ![]() where the interest rate is
where the interest rate is ![]() the time to maturity is
the time to maturity is ![]() year and the face value is F, is given by:
year and the face value is F, is given by:
| > | Dur(c,r,1,F); |
 |
and if the time to maturity is ![]() years it is
years it is
| > | Dur(c,r,n,F); |
 |
Note again that Maple uses the geometric series formula to simplify the expression in (4.18) .
The duration of a zero coupon bond that matures in three years with a face value of $100 in a market with a flat term structure of 7% will be calculated by executing
| > | Dur(0,.07,3,100); |
Keeping in mind the duration definition and its interpretation, as a weighted average of the time to payment of the bond, it should be clear that the duration of such a bond is 3. The weighted average of one number is the number itself. Since the bond pays only once, the weighted average of the time to the payment of the bond is exactly the time to maturity of the bond.
Let us look at another example. The duration of a 5% coupon bond that matures in ![]() paying semi-annual coupons
paying semi-annual coupons ![]() with a face value of
with a face value of ![]() , and the time to the next coupon is 6 months can be calculated by executing :
, and the time to the next coupon is 6 months can be calculated by executing :
| > | Dur(.05,.07,10,100); |
| > |
Consider yet another example. A a 6% coupon bond, maturing in 5 years in a market in which the interest rate is 7% where the time to the payment of the next coupon is next coupon is 6 months.
| > | Dur(.06,.07,5,100); |
| > |
The result of these calculations should not be that surprising. After all, if the bonds mature in 5 years and the highest weight is given to the maturity time, its duration should be close to 5. The weight of each time is the present value of the payment at that time divided by the present value of the future cash flow (the price of the bond). Hence, the face value of the bond will always tilt the duration measure to be close to the maturity time.
The duration of a bond is of course affected by the value of the interest rate. Let us look at the same bond as above but assume now that the interest rate in the market is 2%. The duration of the bond will now be calculated as below.
| > | Dur(.06,0.02,5,100); |
| > |
The lower the interest rate the higher the present value of each payment. However we see again that the face value of the bond being the largest payment affects the duration calculation the most and hence the duration increases. This however will not be the case for a zero coupon bond. A zero coupon bond will have the same duration regardless of the value of the interest rate.
How does an increase in the coupon rate affect the duration? Let us calculate the duration of the last bond but when the coupon rate is 15%.
| > | Dur(.15,0.02,5,100); |
| > |
By increasing the coupon rate we essentially increase the weights of the time payment of each coupon relative to the payment of the face value at maturity. Hence more weight is given to the coupon payment and we thus decrease the average. Thus the duration, being the weighted average, should decrease as indeed we show above.
What is the effect of increasing the time to maturity on the duration of the bond? Increasing the time to maturity in essence makes the time with the heaviest weight (the maturity of the bond) to be longer. Thus we expect an increase in the duration. We demonstrate it below when the maturity of the bond is increased to 10 years.
| > | Dur(.15,0.02,10,100); |
| > |
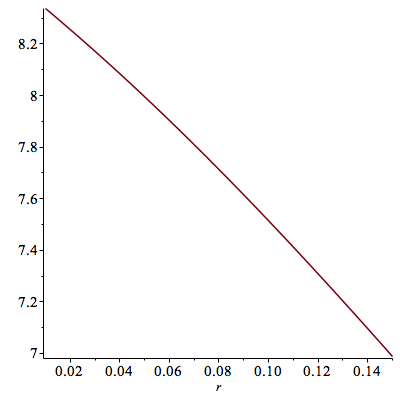
We can therefore summarize and visualize the following, keeping in mind that duration measures the sensitivity (percentage change in the price of a bond) to changes (a percentage change in ![]() ) in the interest rate.
) in the interest rate.
1. The higher the interest rate, the lower the sensitivity of the bond to changes in the interest rate.
This can be visualized by graphing the duration of a bond as a function of the interest rate.
| > | plot(Dur(.05,r,10,100),r=0.01..0.15); |
 |
| > |
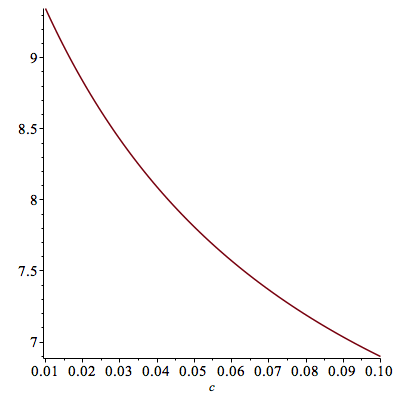
2. The higher the coupon rate, the lower the sensitivity of the bond to changes in the interest rate.
This can be visualized by graphing the duration of a bond as a function of the coupon rate.
| > | plot(Dur(c,.07,10,100),c=.01...0.10); |
 |
| > |
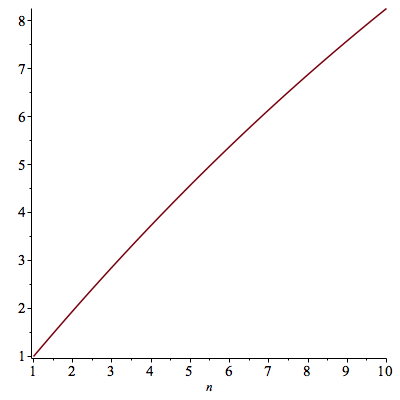
3. The longer the time to maturity, the higher the sensitivity of the bond to changes in the interest rate.
This can be visualized by graphing the duration of a bond as a function of the maturity time.
| > | plot(Dur(.04,.05,n,100),n=1..10); |
 |
| > |
We conclude this chapter by using the duration approximation in order to calculate the percentage change in the value of a bond due to a change in the interest rate.
The function BondPrice calculates the price of a bond with a face value of $100 where ![]() is the coupon rate (paid semiannually),
is the coupon rate (paid semiannually), ![]() is the term structure of the interest rate (assumed to be flat for now),
is the term structure of the interest rate (assumed to be flat for now), ![]() is the number of years until maturity where the time to the next coupon is 6 months. That is for n=1, coupon rate of c when
is the number of years until maturity where the time to the next coupon is 6 months. That is for n=1, coupon rate of c when ![]() is the flat term structure of the interest rate we have
is the flat term structure of the interest rate we have
| > | BondPrice(c,r,1); |
Thus, the price of a bond with a face value of $100 that matures in 10 years where c= ![]() , r=0. 05 is
, r=0. 05 is
| > | BondPrice(.10,0.05,10); |
| > |
Assume now that the interest rate in the market increased by 50 bbps that is, the new rate is 5.5%, then the price of the bond will be:
| > | BondPrice(.10,0.055,10); |
| > |
The percentage change in the price of the bond was thus
| > | (134.9418679-139.5621188)/139.5621188; |
| > |
Let us see how the duration will approximate this change. Our approximation says that the percentage change in the price is minus the duration multiplied by the percentage change in 1+r. The Duration of the bond is
| > | Dur(.10,.05,10,100); |
| > |
The percentage change in 1+r is
| > | (1+0.055-(1+0.05))/1.05; |
| > |
Hence the duration will approximate the percentage change as
| > | -Dur(.10,.05,10,100)*(1+0.055-(1+0.05))/1.05; |
| > |
The above can be presented in terms of modified duration as
| > | -(Dur(.10,.05,10,100)/1.05)*0.005; |
| > |
where Dur(.10,.05,10,100)/1.05) is the modified duration and 0.005 is the change in interest rates.
That is the modified duration times the change in interest rates is the percentage change in the bond's price. Thus as a result of 50 bps (0.005) increase in interest rate the price of the bond is approximated as
| > | BondPrice(.10,0.05,10,100)*(1-0.03966036818); |
| > |
Duration therefore measures the sensitivity of bonds, or portfolio of bonds as we shall soon see, to changes in interest rates. Hence duration is used to manage interest rate risk. Interest rate risk is the terminology used to capture the risk one faces as a result of a change in the interest rates.
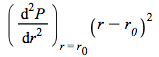
To better capture the sensitivity of bond prices to interest rate changes, a second order Taylor approximation is used. The first order approximation is a linear approximation to the change while the second order allows quadratic such approximation, based on a second order Taylor approximation i.e., based on
![]()
![]()
(4.19)
since 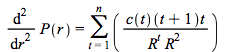 following the same steps as in the deviation of (4.13) yields
 +
+![]()

and thus a more accurate measure of the change to the bond prices, as a result of a change in interest rates is obtained. The expression
(4.20)
is termed, for the reason explained above, "convexity".
Note that this expression is positive, hence omitting it underestimates the true change. The approximation of a bond price without convexity is based on equation (4.6), and with convexity is based on equation (4.21) where r is the rate after the change and the current rate is ![]()
![`≈`(P(r), `+`(P(r__0), (diff(P(r), r))[r = r[0]](`+`(r, `-`(r__0))), `/`(1, 2)))](images/Chp4-1_159.gif)
(4.21)
The figure below visualizes the first and second order Taylor approximation, equations (4.6) and (4.21), respectively.
| > | plot([BondPrice(.05,r,5),BondPrice(.05,.14,5)+(r-0.14)*subs(r=.14,diff(BondPrice(.05,r,5),r)),BondPrice(.05,.14,5)+(r-0.14)*subs(r=.14,diff(BondPrice(.05,r,5),r))+0.5*(r-0.14)^2*subs(r=.14,diff(BondPrice(.05,r,5),r,r)),[[0.14,0],[0.14,BondPrice(.05,.14,5)]]],r=0.01..0.35,y=30..110,color=[green,red,black,blue],labels=[`Interest rate`,`Bond Value`],title=`Approximation of the Bond's value `,thickness=2,titlefont=[TIMES,BOLD,10]); |
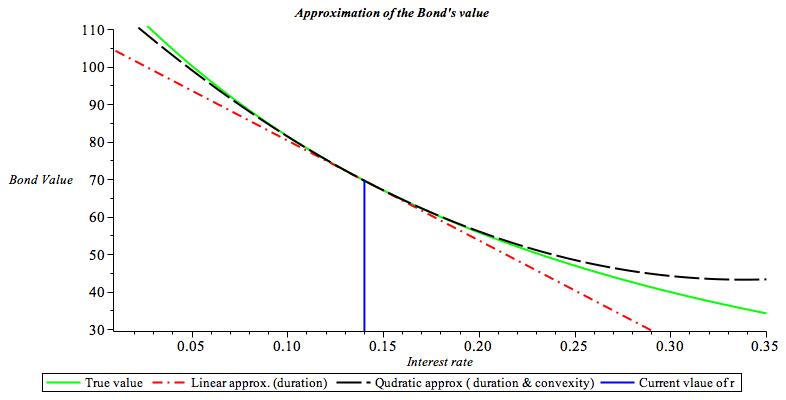 |
| > |
The green solid line is the true value. The red dash-dot line is the linear approximation, i.e., where the price is approximated by ![]() The long dash line is the quadratic approximation, i.e. where the price is approximated by both duration and convexity as
The long dash line is the quadratic approximation, i.e. where the price is approximated by both duration and convexity as ![]() It can be seen that with the convexity term, the approximation nearly coincide with the true price, while the linear approximation is always smaller than the true price.
It can be seen that with the convexity term, the approximation nearly coincide with the true price, while the linear approximation is always smaller than the true price.
The definition of duration and convexity, as well as that of a generalized concept of duration are easier to work with if a continuous compounding is used to represent the term structure and the discount factor. If the price of a bond, the preset value of its cash flow c(t) at time t, is represented as 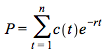 instead of
 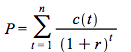 we have that
 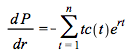 and
and 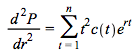 . Therefore following the steps in the derivation of the duration equation (4.11) it will be defined as

and the convexity equation (4.20) will be defined as
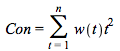
where
![]()
That is the duration is the weighted average of the length of the times until the payments from the bonds, and the convexity is the weighed average of these times squared. Using continuous compounding there is no need to define modified duration. Since the second order Taylor approximation divided by the current price is
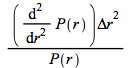
(4.22)
and thus
![]()
![]()
(4.23)
In words the percentage change in the bond price is minus the duration multiplied by the change in r plus half the convexity multiplied by the squared change in r.
Our next section explores the use of duration in bond portfolio management.