ERG amplitude as a function of stimulus intensity for various wavelengths
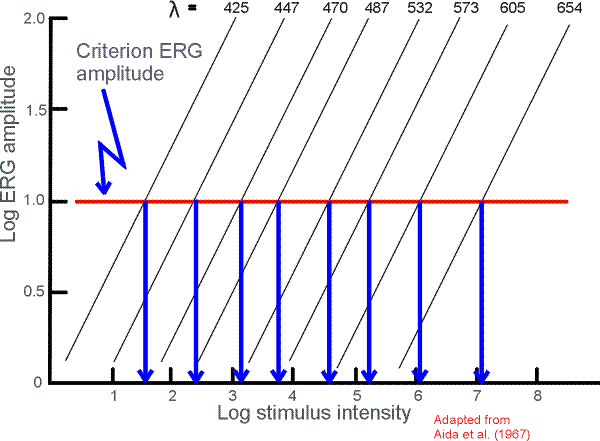
This graph plots the log ERG amplitude as a function of log stimulus intensity for 8 wavelengths. Then a criterion ERG amplitude is chosen (the horizontal line) and the corresponding associated stimulus intensities are determined (down pointing arrows). These stimulus intensities are then plotted as a function of wavelength to yield the spectral sensitivity measured by the ERG.