Teather, R. J., Pavlovych, A., Stüerzlinger, W., & MacKenzie, I. S. (2009). Effects of tracking technology, latency, and spatial jitter on object movement. Proceedings of the IEEE Symposium on 3D User Interfaces – 3DUI 2009, pp. 43-50. New York: IEEE. [PDF] [software]
Effects of Tracking Technology, Latency, and Spatial Jitter on Object Movement
Robert J. Teather, Andriy Pavlovych, Wolfgang Stüerzlinger, & I. Scott MacKenzie
Department of Computer Science & Engineering
York University, Toronto, Ontario
{rteather, andriyp, wolfgang, mack}@cse.yorku.ca
ABSTRACT
We investigate the effects of input device latency and spatial jitter on 2D pointing tasks and 3D object movement tasks. First, we characterize jitter and latency in a 3D tracking device and an optical mouse used as a baseline comparison. We then present an experiment based on ISO 9241-9, which measures performance characteristics of pointing devices. We artificially introduced latency and jitter to the mouse and compared the results to the 3D tracker. Results indicate that latency has a much stronger effect on human performance than low amounts of spatial jitter. In a second study, we used a subset of conditions from the first to test latency and jitter on 3D object movement. The results indicate that large, uncharacterized jitter "spikes" significantly impact 3D performance.KEYWORDS: Latency, jitter, Fitts' law, 3D manipulation.
INDEX TERMS: H.5.1 [Information Interfaces and Presentation]: Multimedia Information Systems - virtual reality. H.5.2 [Information Interfaces and Presentation]: User Interfaces - input devices, interaction style.
1 INTRODUCTION
Many virtual environments allow users to manipulate three-dimensional objects. These systems usually use a 3D input device supporting simultaneous manipulation of all 6 degrees-of-freedom (6DOF). These devices enable interaction schemes similar to real-world object manipulation, and may allow users to transfer real-world experience to VR.
However, these devices have shortcomings. Compared to a mouse, 3D input devices have higher tracking noise and latency, and are subject to hand tremor if held in space. These factors degrade performance. Consequently, seemingly natural interaction schemes may not work as initially expected.
Latency, or lag, is the delay in device position updates [10]. It has been previously demonstrated to significantly impact human performance in both 2D and 3D tasks, [13, 18, 21]. Spatial jitter, potentially due to both noise in the device signal and hand tremor, may also affect performance. These two factors often guide the choice of input device for a virtual environment. For high-precision tasks, designers may choose a device with low jitter, or smooth noisy input at the cost of introducing extra lag. However, since it is unclear which has a greater impact on performance, this trade-off should not be made lightly.
We present two studies investigating the effects of latency and jitter on human performance with 3D input devices. The first employed Fitts' law, a well-established model of pointing device performance. Fitts' law is inherently 1-dimensional with strong 2D extensions, but it does not extend well to 3D movements. Consequently, we limited the first study to 2D pointing tasks using both a 3D tracker and mouse under a variety of lag/jitter conditions. We used the mouse as an exemplary low-latency, low-jitter condition, and artificially added latency and jitter to match those of the tracker. Using a tracker physically mounted on the mouse, we compared motions captured by the mouse optical sensor to those of the 3D tracking system, constrained to 2D. The goal of this experiment was to determine, all else being equal, the effects of latency and jitter, and to quantify the differences in device performance. In other words, which has a stronger impact on human performance: latency or jitter?
The second study examined the effects of latency and jitter on 3D positioning. It used a subset of the modalities from the first study. The goal was to determine if 3D task performance using 2D input devices can be predicted by 2D models of performance such as Fitts' law.
2 BACKGROUND
This section briefly discusses relevant work in 3D manipulation, tracking technology, and Fitts' law.
2.1 3D Manipulation
Manipulating objects in 3D is a 6 degree-of-freedom (6DOF) task requiring three degrees of control in movement and three in rotation. Most VR systems a 3D input device to allow simultaneous control of all 6DOF [3, 4, 17, 22, 23].
A goal of many VR systems is to create a compelling illusion of reality, wherein the user manipulates objects as in the real world. However, if immersion is not required, standard input devices such as a mouse can suffice for 3D input [2, 6, 16]. This is justified by the observation that novice VR users tend not to move and rotate objects simultaneously [5]. Consequently, our current work focuses on 3D movement. Although the mouse - a 2DOF device – controls only X and Y position, software techniques can overcome this limitation. Hence, when manipulation is constrained via software, two degrees of control are almost enough to directly control either the position or orientation of an object.
For example, input mapping techniques can yield three degrees of control with only two degrees of freedom from the input device. The most common approaches use ray casting, a well-known computer graphics technique [4]. Ray casting generates a 3D ray into the scene through a 2D screen point (e.g., the mouse cursor position). The ray is checked for intersections with scene objects and affords interaction with all visible objects. Using 3D manipulation widgets allows indirect interaction via ray casting with small "handles" around a selected object [2, 6]. A disadvantage of handles is the decomposition of high-level object movement into sub-task movements along multiple single axes or planes. Other techniques use constraint systems coupled with ray casting to afford three simultaneous degrees of control with only 2DOF from the input device. The user effectively clicks and drags objects in the scene while software automatically computes their 3D position by checking for collisions with other objects [16].
Our current work compares the mouse to a 3D tracking system simulating a mouse. A previous study comparing mouse-based and tracker-based 3D movement techniques found that the mouse performed better [20] when both devices are used only for 2DOF input. The authors hypothesized that the differences between the tracking technologies were the ultimate explanation for these results. Thus, when emulating mouse motion with a 3D tracker, no performance difference should be detectable when the latency and jitter of the devices match.
2.2 3D Tracking Systems, Lag and Jitter
A number of tracking technologies exist today. Typically, a 3D tracking system is required for a 3D input device. Foxlin provides a thorough overview of the available types of tracking technologies [10]. Although it is argued that one should choose a specific tracking technology based on needs [10], most tracking technologies have shortcomings that affect performance. Specifically, they tend to suffer from high latency and jitter.
Latency is the time from when the device is sampled to updates appearing on the screen. It is well-known that latency adversely affects human performance in both 3D tasks [7, 21] and 2D pointing tasks [13].
Spatial jitter is caused by a combination of hand tremor and noise in the device signal. Noise can be observed by immobilizing a device while observing the reported positions; even stationary, the reported positions fluctuate. Hand jitter exacerbates this in free-space tracking devices.
Temporal jitter, or latency jitter, is the change in latency with respect to time. Ellis et al. [8] report that people can detect very small fluctuations in lag, likely as low as 16 ms. Hence when examining system lag, one must also ensure that latency jitter is minimized, or at least known.
2.3 Fitts' Law
Fitts' law [9] is a model for rapid aimed movements:
| MT = a + b × log2(A / W + 1) | (1) |
where MT is movement time, A is the amplitude of the movement (i.e., the distance to the desired targets), and W is the width of a target. The log term is the Index of Difficulty (ID), which is commonly assigned a unit of bits:
| MT = a + b × ID | (2) |
The coefficients a and b are determined empirically for a given device and interaction style (e.g., stylus on a tablet, finger on an interactive tabletop).
The interpretation of the equation is that movement tasks are more "difficult" when the targets are smaller or farther away. Fitts' law has been used to characterize the performance of pointing devices and is one of the components of the standard evaluation in accordance with ISO 9241-9 [11]. Indeed, if the movement time and determined ID are known, then the ratio gives the throughput of the input device in bits per second (bps).
2.3.1 Effective Width and Effective Distance
During the evaluation, participants are asked to click on targets of various sizes, spaced at various distances. Usually they hit larger targets with fewer misses and relatively closer to their centers and smaller targets with more misses and farther away from the centers. Thus, it is beneficial to take this increase or decrease of accuracy into account. As an illustration, Figure 1 depicts the distribution of hits when a task is performed repeatedly.
Figure 1. Distribution of clicks on a circular target
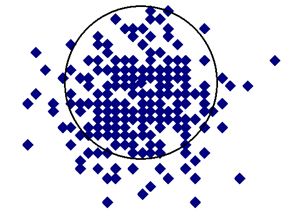
It is a convention to use a sub-range of the hit data, corresponding to about 96%, as the effective width of the target [12]. This range corresponds to approximately 4.133 standard deviations of the observed coordinates of hits, relative to the intended target center. This corresponds better to the task that the user actually performed, rather than the task the user was asked to perform.
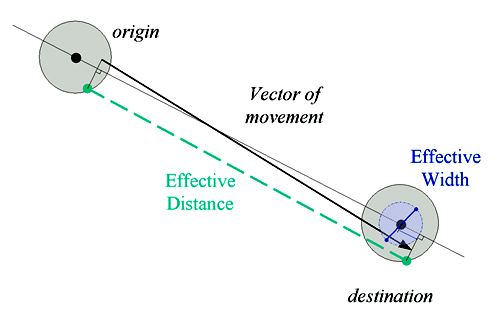
In our study, a projection of the actual movement vector onto the intended vector is computed and the difference of the vector lengths is used as the deviation from the intended center. A similar approach is used for the distance: the actual movement distances are measured, and then averaged over all repetitions, thus forming the effective distance. See Figure 2. Finally, both effective distance and effective width, in combination with movement time, are used to determine the throughput of a device, a measure that, as mentioned above, takes the accuracy of target acquisitions into account.
Figure 2. Illustration of effective width and effective distance. Note that these are averaged over multiple movement vectors.
We use these measures in place of the presented target widths and amplitudes to allow seamless incorporation of differing participant strategies to favor either speed or accuracy [12]. In essence, this approach treats more accurate clicks (i.e., clicks closer to the centre of the targets) as clicks on smaller targets, while the clicks outside of the intended targets are treated as "successful" clicks on larger targets. Hence, throughput becomes the primary characteristic of pointing device performance and accuracy. It is also the measure recommended by ISO 9241-9 to test pointing devices [11].
3 CHARACTERIZING SYSTEM LATENCY AND JITTER
End-to-end system latency and jitter were characterized for both the mouse and our 3D tracking system.
We also considered latency jitter, i.e., the amount of change in latency from one point in time to another. To measure this, we examined both the mouse and tracker update frequency. Our tracker updates at 120 Hz [15] and the mouse at 125 Hz. A histogram of these times showed that more than 99.5% of the updates happen within 8 - 11 ms of the previous sample, which is in line with these reports. Almost all of the remaining samples follow within 5 - 8 ms. Consequently, we do not believe latency jitter is an issue in our experiments, and instead focus on latency and spatial jitter.
3.1 Characterizing Latency
A variation of Mine's method was used to characterize the lag of both the mouse and the tracker [14].
3.1.1 Equipment Setup
We use NaturalPoint's Optitrack, a camera-based, optical 3D tracking system [15]. This system uses digital video cameras linked to the computer via USB. The cameras perform an on-board image threshold operation (i.e., before transmission), thus reducing both bandwidth demands and processing requirements on the host system. Our setup uses three Flex:C120 cameras mounted on a rigid metal frame, shown in Figure 3.
Figure 3. NaturalPoint cameras mounted on metal frame.
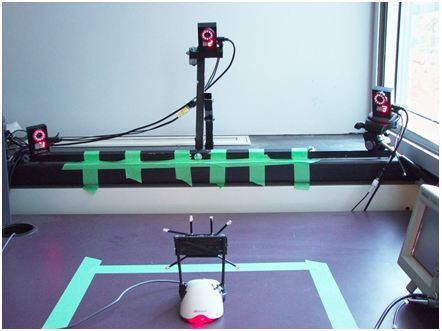
The cameras also contain infrared illuminators. Coupled with the cameras' ability to be synchronized and logically organized into an array, this creates an object tracking solution capable of recognizing emissive or retro-reflective clusters of dots on existing input devices. The NaturalPoint Point Cloud and Rigid Body Toolkit software then perform calibration and real-time 6DOF motion capture of rigid bodies within the overlapping fields-of-view of the cameras. In our experiments, the rigid body consisted of six markers mounted above the mouse. For the latency measurement, a physical pendulum was suspended in front of the display (Figure 4a). The pendulum arm was a rigid metal rod, and the pendulum head was made of hard Styrofoam. Tracking markers placed near the center of the pendulum defined a tracked body. The tracking system cameras were positioned to cover the working area from multiple angles.
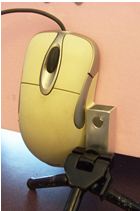
The mouse latency was measured with the same hardware configuration. A Microsoft optical mouse was affixed to a tripod positioned in front of the pendulum. The optical sensor of the mouse was pointed toward the pendulum, approximately 0.5 mm away from the Styrofoam surface. This distance was sufficient to allow the mouse to sense the pendulum movement, but without rubbing against it and thus reducing its movement due to friction.
(a) (b)
Figure 4. (a) Pendulum setup in front of display. (b) Mouse affixed to tripod used in mouse latency measure.
We used a 21" CRT display at a resolution of 800 × 600 pixels and a 120 Hz screen refresh rate. A digital camera was used to record the experiment at a frame rate of 60 Hz. The optical tracking system was positioned in front of the display, pointed toward it and the pendulum. The digital camera was positioned immediately behind the tracking system.
3.1.2 Software Setup
The software drew two lines on the screen. The origin of the lines was registered off-screen with the pivot point of the pendulum (about 5 cm above the monitor). In the resting position, the ends of the lines were positioned directly behind the pendulum, near the center of the screen. As the pendulum swung, the ends of the two lines moved in accordance to its motion, as perceived by the mouse or the tracking system. The line origins remained stationary.
3.1.3 Procedure
The pendulum was extended by hand and released. It then freely oscillated at approximately 0.8 Hz. Pendulum motion was detected either by the retro-reflective markers placed on it (via the cameras) or by the optical sensor of the mouse tracking the Styrofoam surface. The movement of the line endpoints corresponded to the detected motions. Movement of both the pendulum and of the lines was recorded with a digital video camera. The end-to-end tracking latency of the two devices equaled the differences in the relative motion of the lines drawn with respect to the physical pendulum.
3.1.4 Analysis and Results
Approximately two minutes of video were recorded with the digital camera. This video was analyzed manually after the experiment to derive the end-to-end latency for both devices. Peaks of pendulum movement were examined. When the pendulum reached the peak of its movement in one direction or the other, the frame number and its time were noted. When it began to swing back the other way, the mouse and tracker lines would swing back as well, but after a short delay due to tracking latency. These delays were recorded.
As the camera was only recording at 60 Hz, we performed a total of 10 measurements to increase the precision of the measurement. Ultimately, the average delay of the mouse relative to the pendulum was 35 ± 2 ms, and the average delay of the tracker was about 40 ms larger, or 73 ± 4 ms.
3.2 Characterizing Tracker Jitter
Another potentially critical difference between the mouse and the tracking system is the spatial jitter in position measures. When controlling a cursor, the tracking system exhibits noticeably more jitter than the mouse, which is virtually jitter-free. We needed to quantify this, to account for differences in the devices in our experiments and to compensate for them in some conditions.
Note that, although the optical sensor of the mouse may be subject to some jitter, this appears to be filtered in the mouse hardware. While the technical details in each specific implementation may differ, typical optical mouse sensors are, in essence, low-resolution miniature video cameras taking images at a rate of several thousand per second [1]. Since a desktop pointing device only requires about a hundred updates per second, the 10:1 or greater excess of frames is likely used to smooth the device operation via averaging or some other filtering technique.
Hand jitter, or hand tremor, is not an issue in our experiments, as resting the mouse on a physical surface largely eliminates it. This is because tremor, like any other mechanical oscillation, depends on friction, as well as mass, rigidity, and external disturbances. Friction dampens, or reduces the magnitude of the oscillations. Unlike "free-space" 3D input devices, our tracker was constrained to the surface by affixing it to the mouse. Hence, we believe most hand jitter to be eliminated for the tracker as well, leaving only device jitter. We thus assume the mouse to have no noticeable jitter of either kind.
3.2.1 Equipment Setup
To characterize tracker spatial jitter we used predictable, repeatable motions. From the differences between the motion observed by the cameras and the expected motion, we derived the amount of jitter. We did not measure the slow variation of the response within the working area, but cannot rule out its presence.
We measured the jitter in three specific conditions: (1) circular movement of the rigid body in the horizontal plane, (2) circular movement in the vertical plane facing the cameras, and (3) linear movement along two perpendicular axes on the horizontal plane.
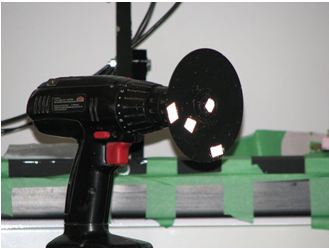
In the first case, we used a gramophone record player, and put the reflective markers on a turntable. The lowest available speed of 16 2/3 rpm (0.28 s-1) was selected. In the second case, we used a cordless power drill. The reflective markers were glued to a surface of a compact disc, with the disc clamped to a metal bolt and mounted into the chuck of the drill. The speed was adjusted to the lowest possible, approximately 0.5 s-1. Figure 5 shows this condition. For the last condition, the tracked dots were mounted on a moving platform with four wheels, which was moved by hand along a rail during the experiment, at a speed of ~1 m/s.
Figure 5. Rigid body mounted on a drill.
3.2.2 Analysis and Results
Our recorded motion included regular movement along a circle, which resulted in regular, sinusoidal, changes of the coordinates in the rotational platform conditions. Since this motion was predictable, we can easily subtract it from the signal by applying a high-pass filter. Doing so left only jitter, which is the fast-changing component of motion. Finally, we computed the frequency response of the jitter and calculated its RMS value.
The tracker jitter mostly resembled white noise in all three examined motions. It was approximately 0.4 mm peak-to-peak in all axes, with an RMS value of 0.3 mm. There was some increase of noise at the lowest frequencies, thus it is not strictly white noise. Furthermore, there were occasional spikes ("outliers") in the measurements. While such spikes have little effect on the frequency content and overall strength, they may have detrimental effects on performance due to their short duration, especially during high precision tasks. The jitter is visualized in Figure 6.
(a)
(b)
Figure 6. Spatial jitter of the Optitrack tracker. (a): fragment (~1 s long) of jitter displacement in mm; (b): FFT of the recorded data, logarithmic response in dB, frequencies (linearly) from 0 to 60 Hz, low frequency regular motion filtered out


4 EXPERIMENT 1 (2D POINTING)
This experiment used the ISO 9241-9 standard to compare differences in the devices. Based on Fitts' law, this standard measures performance of devices in 2D pointing tasks.
4.1 Participants
Fourteen students (aged 18 to 30; mean 27.2 years) were recruited to participate in the study. Eight were male. All used the mouse with their right hand during normal computing. Participants were paid $10 upon completion of the study, which took about 1 hour.
4.2 Apparatus
The computer was an AMD Athlon with a 64-bit CPU, running at 3 GHz, with 1 GB of RAM and a PCI-Express graphics controller. A Microsoft optical mouse was augmented with a set of retro-reflective markers and was used in all conditions (see Figure 7). Some conditions, specifically the "mouse" input device condition, used the mouse optical sensor. The "tracker" input device conditions instead used the NaturalPoint OptiTrack motion capture system on the retro-reflective markers on top of the mouse to detect motions.
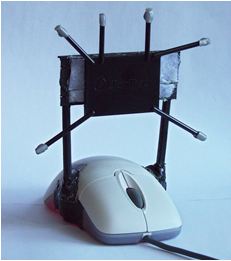
Figure 7. Mouse with optical tracking markers mounted.
The software was written in C# and used NaturalPoint's tracking API to enable the capture of the motion of the rigid body mounted on the mouse. The software implemented a 2D pointing task commonly employed in Fitts' law studies, as described in ISO 9241-9 [11] (see Figure 8). The software presented 13 targets in a circle. Upon clicking the first highlighted target (at the top) the timer starts and the opposite (bottom-left) target is highlighted, directing the participant to select it. The next target is on the opposite side, to the immediate right of the first target, and so on until all targets are clicked. The software logged target sizes, distances between targets, the times to click between targets, errors, and screen coordinates of click events. It also performed the effective width calculation as described in Section 2.3.1.
4.3 Procedure
After signing informed consent forms participants were seated in front and to the right of the computer display. The tracked mouse was positioned initially at the origin of the tracked region (the bottom left corner of the taped square in Figure 3).
Participants were given a brief introduction to the system, and allowed to try the system and find the most comfortable seating position. After that, they were instructed to click on the highlighted targets as quickly and accurately as possible.
4.4 Design
This experiment had one independent variable, input modality, with seven levels. These are summarized in Table 1. Five of these used the mouse, and two used the tracking system.
In addition to the baseline mouse technique, M, the mouse-based input modalities involved artificially adding latency and/or spatial jitter. Two of these had increased latency only. One, ML, had latency that matched that of the tracker. The other, M225, had 225 ms of latency. This high latency condition was introduced to correlate our results with previous work [13]. A fourth mouse-based modality, MJ, increased only the average spatial jitter to match the tracker RMS value. The final mouse-based modality, MT, was a "tracker emulation" mode, where both latency and jitter matched the tracker. The jitter in the MJ and MT modalities was calculated based on mouse sensitivity (mm/pixel), and randomly generated to match the measured tracker jitter. The tracker-based conditions used either relative movement, TR (subject to clutching, like a mouse), or absolute movement, TA (tracked in the air if clutched).
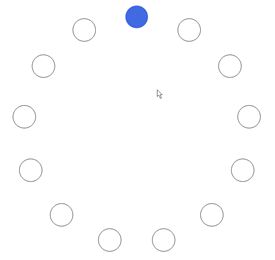
Figure 8. Task for study #1. Participants would click each highlighted target. The width of the targets and the distance between targets varied randomly.
| Input Modality | Name | Approx. Total Latency (ms) | RMS Jitter (mm) | Movement Mode |
| M | Mouse | 35 | - | Relative |
| ML | Mouse + 40 ms latency | 75 | - | Relative |
| MJ | Mouse + jitter | 35 | 0.3 | Relative |
| M225 | Mouse + 190 ms latency | 225 | - | Relative |
| MT | Mouse + 40 ms latency + jitter | 75 | 0.3 | Relative |
| TR | Tracker, relative | 75 | 0.3 | Relative |
| TA | Tracker, absolute | 75 | 0.3 | Absolute |
The input modality ordering was determined by a Latin square within each block. Additionally, half the participants used all devices in the reverse order to complete the counterbalancing.
All devices were tested under three target amplitudes (320, 450 and 640 pixels) and three target widths (12, 25 and 64 pixels). These conditions represented nine IDs, and were randomly ordered (without replacement) within a block. Note that ID was not treated as an independent variable, but rather was varied to ensure a realistic range of task difficulties.
Each participant completed two blocks of trials in this counterbalanced order of input modalities. Hence, the design of the experiment was 7 input modalities × 9 IDs × 2 blocks, for a total of 126 rounds for each participant. Given that there were 14 participants and 12 recorded target clicks per round, this gave a total of 126 × 14 × 12 = 21,168 trials. Note that it was not possible to record the first target click time, which started the round. The dependent variable was device throughput (in bits per second), calculated as described earlier.
4.5 Results & Discussion
4.5.1 Throughput
Results were analysed using one-way ANOVA. There was a significant main effect for input modality on throughput, (F6,84 = 38.8, p < .0001). Figure 9 shows the throughput of the seven input modalities. The throughput of the baseline mouse condition is similar to that reported in previous work [19]; we take this as one validation of the experimental design.
Figure 9. Throughput for all conditions, higher is better. Error bars represent ±1 std. error. Bars are ordered to highlight groupings.

A Tukey-Kramer post-hoc analysis revealed three groupings of modalities, with no evidence of statistical difference in throughput within each group. The M and MJ conditions were the most efficient, and the M225 condition the least efficient; the rest are approximately equal. See also Figure 9.
4.5.2 Movement Time and Error Rates
Average movement time for the M and MJ modalities was around 990 ms. The middle group of modalities (ML, MT, TA and TR) had an average movement time of 1145 ms. Finally, the average movement time for the M225 modality was 1945 ms. The mean error across all conditions was about 6 pixels. We provide these values for comparison with our second study, which cannot be analysed in terms of throughput.
4.5.3 Latency
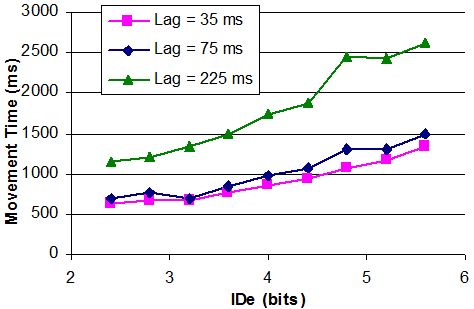
Comparing the TR, TA, MT and ML modalities – all with approximately the same lag - to the mouse indicates that the relative performance cost of 40 ms latency is around 15%. The M225 condition had the worst performance, with about 50% lower throughput. For varying IDe, these results are similar to those observed by MacKenzie and Ware [13]. See also Figure 10. IDe was computed using equation 1 in Section 2.3 as log2(A / W + 1), using effective values for W and A.
4.5.4 Jitter
Comparing the conditions with and without jitter, it appears spatial jitter alone did not have a significant effect on throughput. The MJ condition, with extra jitter, but no additional latency, was not significantly different than the mouse (M) condition. Like the mouse condition, it too was significantly better than both the ML and MT modalities.
4.5.5 Absolute vs. Relative Tracker Movement
Throughput scores for the TA and TR modalities were analyzed using a one-way ANOVA. No significant difference was detected (F1,13 = 0.48, ns). See also Figure 9. We conjecture that one reason no difference was found was that the speed of cursor control in all conditions was high enough to eliminate the need for clutching. Moreover, we observed that participants did not lift the device in the experiment. Consequently, the difference between these conditions should not be noticeable.
4.5.6 Real Tracker vs. "Simulated" Tracker
Throughput scores for the MT, TR and TA modalities were compared using a one-way ANOVA. No significant difference was detected (F2,13 = 1.59, p > 0.05).
Figure 10. Movement Time as a function of IDe.
4.5.7 Summary
We demonstrated that a mouse with added jitter and lag performs very similarly to the tracker having the same measured jitter and lag. We speculate that there are likely no additional factors, other than spatial jitter and latency that significantly affect the performance of the tracker when constrained to 2D operation.
5 EXPERIMENT 2 (3D MOVEMENT)
The second experiment attempts to extend the results of the first to 3D object movement using a constrained 2D-3D movement mapping.
5.1 Participants
Twelve people participated in the experiment, with ages ranging from 19 to 30 (mean age 24 years). Participants were paid $10 for completion of the study, which took approximately 45 minutes.
5.2 Apparatus
The tracked mouse from the previous experiment was used. This experiment used custom 3D graphics software written in C++ with OpenGL. The software was developed for a mouse, with extensions for 3D tracking. It uses a ray-casting based 3D movement technique that requires only 2DOF from the input device, which is mapped to 3DOF movements. Depth is handled automatically: the software slides objects along the closest surface behind their projection as they move through the scene [16].
5.3 Procedure
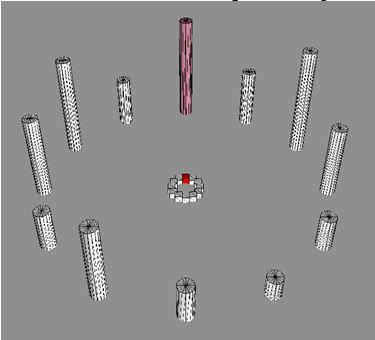
After signing informed consent forms, participants were seated in front and to the right of the monitor, and shown how to use the system. They were shown how to use the movement technique, and given a practice trial to familiarize them with the task. The task involved moving twelve unit cubes from a circle in the centre of a plane to twelve corresponding pillars positioned in a circle at a radius of 20 units. This was designed to simulate the ISO 9241-9 task used in the first study in a 3D setting. The height of the pillars varied to add a third dimension to the task. Consequently, while the distance moved in screen coordinates would be similar for each cube, the 3D distance varied more. The viewpoint was fixed to eliminate navigation as a potential confounding factor.
Figure 11. Task for study #2 with fixed viewpoint. Participants moved each cube to the corresponding pillar on the periphery, starting with the red cube at the "noon" position. Pillar heights, diameters and positions were constant throughout the experiment.
5.4 Design
This study had one independent variable, input modality, with four levels. Four of the input device modalities from the first study were re-used. These were M, ML, MT and TA. We used 10 blocks; thus, the design of the experiment was 4 × 10. Given that there were 12 object movements per round and 12 participants, there was a total of 4 × 10 × 12 × 12 = 5760 trials recorded. The dependent variables were object movement time (in ms) and error. Error was measured both in screen coordinates (pixels away from ideal position) and 3D distance (units away from ideal 3D position).
5.5 Results
5.5.1 Average Movement Time
There was a significant main effect for input modality on object movement time (F3,11 = 40.44, p < .001). Tukey-Kramer post-hoc analysis revealed no significant difference between any of the mouse modalities; see bars M, ML and MT in Figure 12. However, the TA condition was significantly slower than any mouse modality, about ~30%. This was surprising, given the findings of the first study, in which the MT, ML, and TA modalities were not significantly different. This is discussed further below.
Figure 12. Average movement time, with standard error bars. Note this graph cannot be directly compared to Figure 9. Also, the results for the M condition are not comparable (see text).

5.5.2 Positioning Error
No statistically significant difference in positioning error was found in terms of either 2D error (F3,11 = 0.56, ns) or 3D error (F3,11 = 0.96, ns). In 2D, the grand mean error was 7.16 pixels, only slightly larger than in the first study; in 3D it was 0.44 units, which corresponds to about half a cube width.
6 DISCUSSION
At first glance, the results of our second study appear to contradict those of the first. The first study found no significant differences between the tracker-like and the tracker conditions. Yet, the results of the second study indicate about a 30% difference between these conditions. According to an in-depth analysis, the difference is likely due to jitter "spikes" which are present in the tracker output, but not in the mouse. These spikes have much higher cost in 3D compared to the 2D task.
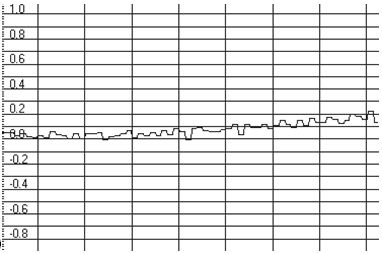
As previously mentioned, the tracker signal noise had comparatively large spikes in approximately 1% of the samples. While this does not affect the RMS of the tracker jitter, the performance penalty can be dramatic, especially if these spikes occur at inopportune times such as when placing an object on the target pillar. Figure 13 compares the magnitude of the spikes to our simulated jitter.
(a) (b)
Figure 13. (a) Shot noise in the tracker position outputs; (b) for comparison - the response of the mouse with the added jitter in the same area. X-axis gridlines - 67 ms, 1 unit of Y-axis - 10 mm.
The performance cost of errors is higher in the 3D task than in the 2D task. In part, this is due to the effective width calculation used in the 2D task. Another factor is that in the 3D task the magnitude of the 3D error can grow much more than the 2D distance moved: if a jitter spike causes the object to miss the target pillar and thus fall onto the background plane, a lengthier correction is necessary. Effectively, a 1-pixel error in screen coordinates can map to an arbitrary drop along the corresponding 3D ray.
This is supported by the lack of significant difference in accuracy between conditions for the 3D task. This likely occurred because most errors were corrected, as suggested by the relatively low 3D error (less than half a unit of distance). Also there are strong visual cues (perspective and in some cases, occlusion) as to whether the object was in a correct position, making it easy to detect and correct errors. With the tracker, such misses appear to have happened more often, due to the shot noise mentioned above. The correction time contributed to the observed differences in the movement time. However, due to the corrections, there was no significant difference in accuracy. In contrast, corrections were not possible in the first study, where each trial concluded upon clicking (whether it was a hit or miss).
Analysis of the 3D motion paths also supports this. Most errors occurred on pillars around the back of the circle. Due to the perspective distortion, errors in that region also required the largest correction. Examination of the motion paths indicated that after making such errors, participants moved the object around to the front of the pillar and slid it up the front again, resulting in a relatively large time penalty.
Another issue with the second study was that the mouse condition was not significantly different from the mouse with latency, as in the first study. Analysis of precise timing data revealed that the base mouse condition (and only that) suffered from higher than expected latency as well as latency jitter. On average, the base mouse condition had 15 ms extra latency, which partly explains the performance drop. Moreover, latencies exhibited a roughly bimodal distribution around 12 ms (70%) and 24 ms (30%). We believe that this explains the remaining performance loss. The problem was traced to timing limitations of the underlying software framework used in the second study. However, the data from the mouse condition with latency and also with jitter are correct and directly comparable with the first study.
Given that the mouse motions used in the first experiment do not represent realistic 3D motions in a typical VR system, we cannot generalize the results to 3/6DOF manipulation. In the second study, the task was more characteristic of VR system usage. However, the software mapped 2D motions to 3D motions, and hence the results may not be directly applicable to full, unconstrained 3D movements. Consequently, while our results better explain previous results [20], they do not fully explain the tradeoff between latency and jitter in 3D.
7 CONCLUSIONS AND FUTURE WORK
We presented two studies examining the effects of device characteristics on both 2D pointing tasks, and constrained 3D object movement tasks. In particular, we examined the effect of latency and spatial jitter. Our results indicate that latency has a much stronger effect on performance in pointing tasks than low levels of jitter. The results of our second study illustrate also that erratic jitter has significant performance cost.
We plan to examine this further by performing studies that systematically vary both latency and jitter, for both 2D (constrained) and 3DOF movement tasks. We are particularly interested in determining what degree of jitter results in a loss of performance corresponding to a given level of lag. Given that system designers often employ smoothing, essentially trading jitter for lag, it is important for this tradeoff to be better understood.
8 ACKNOWLEDGEMENTS
Thanks to Steven Castellucci for assistance with some of the calculations and providing the record player. Thanks to Rob Allison for use of the pendulum equipment. Thanks also to NSERC for supporting this research.
9 REFERENCES
| [1] | Data Sheet - ADNS-3080, High Performance Optical Mouse Sensor, Avago Technologies, 2008.
Accessed December 30, 2008. http://www.avagotech.com/docs/AV02-0366EN.
|
| [2] | E. Bier, "Skitters and jacks: interactive 3D positioning tools," in Proceedings of the 1986
Workshop on Interactive 3D Graphics Chapel Hill, North Carolina, United States: ACM, pp.
183-196, 1987.
|
| [3] | D. A. Bowman, D. B. Johnson, and L. F. Hodges. "Testbed evaluation of virtual environment
interaction techniques," in Proceedings of the ACM Symposium on Virtual Reality Software and
Technology London, United Kingdom: ACM, pp. 26-33, 1999.
|
| [4] | D. A. Bowman, E. Kruijff, J. LaViola, Jr., and I. Poupyrev, 3D User Interfaces: Theory and
Practice: Addison Wesley, 2004.
|
| [5] | F. P. Brooks, Jr., M. Ouh-Young, J. J. Batter, and P. J. Kilpatrick, "Project GROPE: Haptic
displays for scientific visualization," ACM SIGGRAPH Computer Graphics, vol. 24, pp. 177-185,
1990.
|
| [6] | B. D. Conner, S. Snibbe, K. Herndon, D. Robbins, R. Zeleznik, and A. van Dam.
"Three-dimensional widgets," in Proceedings of the 1992 Symposium on Interactive 3D Graphics,
Cambridge, Massachusetts, United States: ACM, pp. 183-188, 1992.
|
| [7] | S. R. Ellis, F. Breant, B. Manges, R. Jacoby, and B. D. Adelstein, "Factors influencing
operator interaction with virtual objects viewed via head-mounted see-through displays: viewing
conditions and rendering latency," in Virtual Reality Annual International Symposium, 1997.
IEEE, pp. 138-145, 1997.
|
| [8] | S. R. Ellis, M. J. Young, B. D. Adelstein, and S. M. Ehrlich, "Discrimination of changes of
latency during voluntary hand movements of virtual objects," in Proceedings of the Human Factors
and Ergonomics Society, Houston, Texas, pp. 1182-1186, 1999.
|
| [9] | P. M. Fitts, "The information capacity of the human motor system in controlling the
amplitude of movement," Journal of Experimental Psychology, vol. 47, pp. 381-391, 1954.
|
| [10] | E. Foxlin, "Motion tracking requirements and technologies," in Handbook of virtual
environments: Design, implementation and applications, K. M. Stanney, Ed. Mahwah, New Jersey:
Lawrence Erlbaum, pp. 163-210, 2002.
|
| [11] | ISO, "ISO/DIS 9241-9 Ergonomic requirements for office work with visual display terminals
(VDTs) - Part 9: Requirements for non-keyboard input devices," International Standard,
International Organization for Standardization, 2000.
|
| [12] | I. S. MacKenzie, "Fitts' law as a research and design tool in human-computer interaction,"
Human-Computer Interaction, vol. 7, pp. 91-139, 1992.
|
| [13] | I. S. MacKenzie and C. Ware, "Lag as a determinant of human performance in interactive
systems," in Proceedings of the CHI '93 Conference on Human Factors in Computing Systems,
Amsterdam, The Netherlands: ACM, pp. 488-493, 1993.
|
| [14] | M. R. Mine, "Characterization of End-to-End Delays in Head-Mounted Display Systems,"
Technical report, University of North Carolina at Chapel Hill, 1993.
|
| [15] | NaturalPoint, "NaturalPoint OptiTrack," NaturalPoint, Inc., 2008. Accessed January 3, 2009.
http://www.naturalpoint.com/optitrack/.
|
| [16] | J.-Y. Oh and W. Stuerzlinger, "Moving objects with 2D input devices in CAD systems and
Desktop Virtual Environments," in Proceedings of Graphics Interface 2005, Victoria, British
Columbia: Canadian Human-Computer Communications Society, pp. 195-202, 2005.
|
| [17] | I. Poupyrev, Ichikawa T., S. Weghorst, and M. Billinghurst, "Egocentric Object Manipulation
in Virtual Environments: Empirical Evaluation of Interaction Techniques," in Proceedings of
Eurographics '98, vol. 17, pp. 41-52, 1998.
|
| [18] | R. H. Y. So and G. K. M. Chung, "Sensory motor responses in virtual environments: Studying
the effects of image latencies for target-directed hand movement," in 27th Annual International
Conference of the Engineering in Medicine and Biology Society. IEEE-EMBS 2005., pp. 5006-5008,
2005.
|
| [19] | R. W. Soukoreff and I. S. MacKenzie, "Towards a standard for pointing device evaluation,
perspectives on 27 years of Fitts' law research in HCI," International Journal of Human-Computer
Studies, vol. 61, pp. 751-789, 2004.
|
| [20] | R. J. Teather and W. Stüerzlinger, "Assessing the Effects of Orientation and Device on
(Constrained) 3D Movement Techniques," in IEEE Symposium on 3D User Interfaces, pp. 43-50, 2008.
|
| [21] | C. Ware and R. Balakrishnan, "Reaching for objects in VR displays: lag and frame rate," ACM
Transactions on Computer-Human Interaction (TOCHI), vol. 1, no. 4, pp. 331-356, 1994.
|
| [22] | C. Ware and D. Jessome, R, "Using the Bat: A Six-Dimensional Mouse for Object Placement,"
IEEE Computer Graphics and Applications, vol. 8, pp. 65-70, 1988.
|
| [23] | S. Zhai, W. Buxton, and P. Milgram, "The "Silk Cursor": Investigating Transparency for 3D Target Acquisition," in ACM Conference on Human Factors in Computing Systems, ACM Press, pp. 459-464, 1994. |