Sasangohar, F., MacKenzie, I. S., & Scott, S. D. (2009). Evaluation of mouse and touch input for a tabletop display using Fitts' reciprocal tapping task. Proceedings of the 53rd Annual Meeting of the Human Factors and Ergonomics Society – HFES 2009, pp. 839-843. Santa Monica, CA: Human Factors and Ergonomics Society. [PDF] [software]
Evaluation of Mouse and Touch Input for a Tabletop Display Using Fitts' Reciprocal Tapping Task
Farzan Sasangohar1, I. Scott MacKenzie2, Stacey D. Scott1
1Dept. of System Design Engineering, University of Waterloo2Dept. of Computer Science and Engineering, York University
User performance with a tabletop display was tested using touch-based and mouse-based interaction in a traditional pointing task. Dependent variables were throughput, error rate, and movement time. In a study with 12 participants, touch had a higher throughput with average of 5.53 bps compared to 3.83 bps for the mouse. Touch also had a lower movement time on average, with block means ranging from 403 ms to 1051 ms vs. 607 ms to 1323 ms with the mouse. Error rates were lower for the mouse at 2.1%, compared to 9.8% for touch. The high error rates using touch were attributed to problems in selecting small targets with the finger. It is argued that, overall, touch input is a preferred and efficient input technique for tabletop displays, but that more research is needed to improve touch selection of small targets.
INTRODUCTION
Interaction methods in direct manipulation interfaces are well documented in the human-computer interaction literature. Point-select tasks, in particular, have been highly studied (e.g., Card et al., 1978; Forlines et al., 2007; MacKenzie et al., 1991; MacKenzie, 1995; Soukoreff & MacKenzie, 2004). A recent trend is "surface computing" – a term referring to touch interaction on flat surfaces such as tabletops, walls, floors, and even ceilings (Terrenghi et al., 2007). As demand for touch-based interfaces increases, investigating the human factors for basic tasks using these devices is essential. The human performance differences among different input techniques may yield a better understanding of the issues in common tasks and hence can inform the design of more appropriate interactive environments.
This paper presents a comparison between two input techniques (mouse and touch input) using Fitts' reciprocal tapping task (Fitts, 1954) on a tabletop. Below, we discuss the Fitts' law formulation for measuring performance, and then outline our methodology in evaluating the performance of the two input techniques.
Fitts' Law Overview
Fitts (1954) proposed a model for the tradeoff between accuracy and speed in human motor movements. The model, commonly known as Fitts' law, is based on Shannon's information theory. Fitts proposed to quantify a movement task's difficulty – ID, the index of difficulty – using information theory by the metric "bits". Specifically,
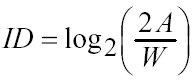 (1)
(1)The movement amplitude (A) and target width (W) are analogous to signal and noise, respectively, in Shannon's original research on electronic communications systems. Note the offsetting influences of A and W in the equation. Doubling the distance to a target has the same effect as halving its size.
An important thesis in Fitts' work was that the relationship between task difficulty and the movement time (MT) is linear. The following expression for ID is more commonly used today, as it improves the information-theoretic analogy (MacKenzie, 1995):
 (2)
(2)Because A and W are both measures of distance, the term in the parentheses is without units. "Bits" emerges from the choice of base 2 for the logarithm. Fitts' law is often used to build a prediction model with the movement time (MT) to complete point-select tasks as the dependent variable:
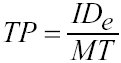
The slope and intercept coefficients in the prediction equation are determined through empirical tests, typically using linear regression. Fitts' (1954) original experiment used a reciprocal tapping task where the subjects tapped back and forth between two rectangular targets. The width of the targets and the distance between them were varied (4 × 4 conditions) to cover a range of task difficulties (see Figure 1).
Figure 1. Fitts' original experiment (from Fitts, 1954)
The experiment presented below used software developed to emulate the task in Fitts' original experiment. The task is also described as "Task #1" in the ISO 9241-9 standard for evaluating "non-keyboard input devices", or pointing devices (ISO, 2000).
Evaluation of Performance Using Fitts' Law
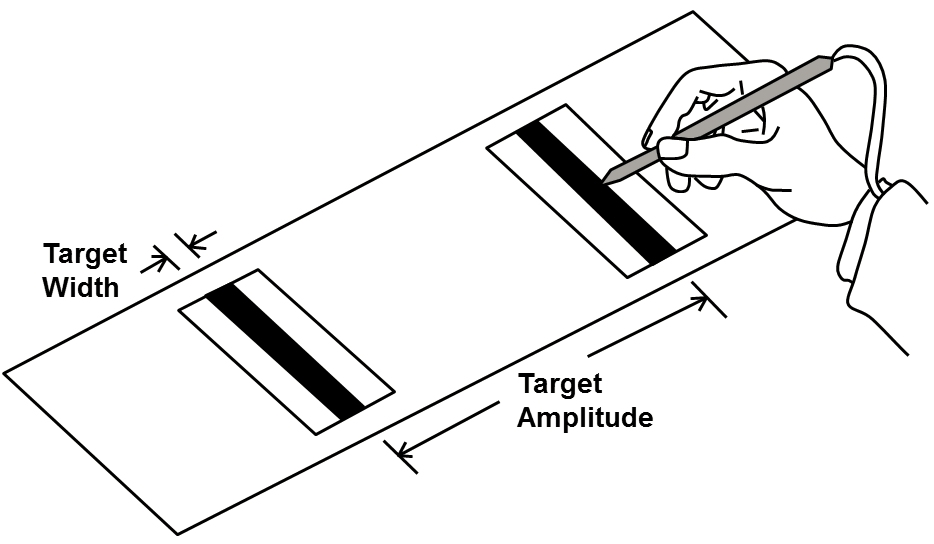
Fitts proposed to quantify the human rate of information processing in aimed movements using "bits per second" as the units. This is a provocative idea, based purely on analogy, without any basis in human psychomotor behaviour. Fitts called the measure "index of performance"; today it is more commonly called "throughput" (TP, in bits/s). Although different methods of calculating throughput exist in the literature, the preferred method is that proposed by Fitts (1954). The calculation involves a direct division of means: dividing ID (bits) by the mean movement time, MT (seconds), computed over a block of trials:
 (4)
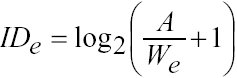
(4)The subscript e in IDe reflects a small but important adjustment, which Fitts endorsed in a follow-up paper (Fitts and Peterson, 1964). An "adjustment for accuracy" involves first computing the "effective target width" as
where SDx is the observed standard deviation in a participant's selection coordinates over repeated trials with a particular A-W condition. Computed in this manner, We includes the spatial variability, or accuracy, in responses. In essence, it captures what a participant actually did, rather than what he or she was asked to do. This adjustment necessitates a similar adjustment to ID, yielding an "effective index of difficulty":
 (6)
(6)Calculated using the adjustment for accuracy, TP is a human performance measure that embeds both the speed and accuracy of responses. TP is most useful as a dependent variable in factorial experiments using pointing devices or pointing techniques as independent variables. Although not shown in Equation 6, it is also common to use the "effective target amplitude" (Ae) as the actual distanced moved, rather than the specified distance. The effect is usually minor, though.
Related Work
MacKenzie et al. (1991) compared the performance of three devices: a mouse, a trackball, and a stylus. They compared a standard pointing and dragging task. For the pointing task they found that the stylus had the lowest mean movement time (665 ms) and the trackball had the highest (1101 ms). The mouse mean movement time was very close to the stylus (674 ms). They also found that mouse was the most accurate with an error rate of 3.5% followed by the trackball at 3.9%. The stylus was slightly less accurate with an error rate of 4.0%.
A key focus of our research is touch-based interaction. There are just a few ISO-conforming studies in this area. Forlines et al. (2007) compared the performance between touch and mouse input for bimanual and unimanual tasks on a tabletop display. They found that touch input is more appropriate for bimanual tasks on a tabletop but the mouse performed better in a unimanual task. For the unimanual task (selecting and docking), touch input had a higher throughput (8.05 bps) than the mouse (4.35 bps) in the selection portion of the task. The throughput reported for touch input is questionable, however, as ISO-conforming throughput values rarely exceed 5 bps (Soukoreff & MacKenzie, 2004). An explanation lies in the method of calculation.
Although the recommended calculation uses a direct division of means, as seen in Equation 4 (Fitts, 1954; ISO, 2000), Forlines et al. (2007) used 1/b from the regression line (Equation 3). The difference is usually minimal, provided the regression line intercept (a) is small. However, the regression line reported by Forlines et al. (2007, Table 1) had a large intercept: a = 460 ms. The effect of a large positive intercept is to decrease the slope of the regression line and thereby increase 1/b. Throughput, computed as 1/b in the presence of a large positive intercept will be higher than throughput computed using the same data but using a direct division of means. Thus, Forlines et al.'s (2007) throughput for touch input maybe somewhat high.
Forlines et al. (2007) also showed that selection with touch was less accurate with an average error rate more than twice that of the mouse, 8.5% compared to 4.1%. For the bimanual tasks (selecting, resizing, docking), touch performed better (1.45 s) than the mouse (2.43 s) in the selection portion of the task. The mouse was again more accurate, with an average error rate of 9.7% compared to 18.9% using touch.
These two studies specifically relate to our work in that the first study uses the same task and procedure but compares different input techniques and devices. The second study compares the same techniques (i.e., mouse and touch) and uses the same tabletop technology, but uses a different task. The main contribution of the work presented here is the comparison in performance between touch and mouse input for tabletop displays using throughput calculated by the method advanced by Fitts (1954) and recommended in ISO 9241-9 (ISO, 2000).
METHOD
A user experiment evaluated the performance of the two interaction techniques: indirect interaction with a mouse and direct touch interaction using a finger. We used a simple pointing task conforming to the methodology of Task #1 of the ISO 9241 standard, part 9, for non-keyboard input devices. In particular, the study investigated the differences in throughput of each input technique in performing a simple target acquisition task. The differences in movement time and error rates were also observed.
Participants
Twelve right-handed participants (9 males. 3 females; 21-29 years) were recruited from a local university. Right-handed participants were chosen to limit the location of the display, described in the next section. All participants were regular computer users and all reported some prior experience with touch input. The participants volunteered to participate in the study and were not paid.
Experimental Apparatus
The study took place in a quiet experimental laboratory. A 32" Mitsubishi Electronics Research Laboratories (MERL) DiamondTouch II DT88 touch-sensitive surface with a top-projected display was used. It included DiamondTouch SDK 2.1 and mouse emulator software (DTMouse) to convert the display's touch events to mouse events. A receiver pad connected to an RCA port under the DiamondTouch was located on the participant's stool to detect the low-level radio-frequency signals from an array of antennas located on the display's surface when the user touched the screen. The DiamondTouch was located on a small desk that allowed enough room for a mouse on the right side (see Figure 2).
A Logitech MX 110 cordless laser mouse with default sensitivity (50%) was used for the mouse condition.
Figure 2. The experimental setting
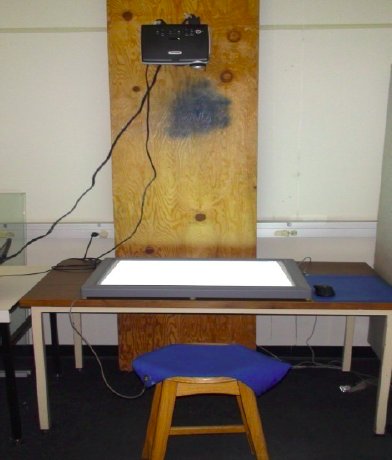
Figure 3. Software implementation of Task #1 of ISO 9241-9

The projector and the DiamondTouch were connected to a Lenovo T61 laptop running Microsoft Windows XP with SP3 and the Java v1.6.1 runtime environment. The laptop's processor was a 2 GHz Intel Core Duo CPU with 1 GB of main memory. The resolution of the display was set to 800 x 600 for proper presentation of the targets.
Experimental Task
The task was Task #1 described in the ISO 9241 standard, part 9, which is an emulation of original Fitts' reciprocal tapping task as illustrated in Figure 3. Two rectangular targets were located on the screen. The target to select was marked by a red plus sign in the middle. With each selection (correct or incorrect) the plus sign moved to the other target. A beep was sounded for incorrect selections.
Experimental Design
The experiment was a 2 × 4 × 4 within-subjects design. The independent variables and levels were as follows:
Input Technique: touch, mouse Target Amplitude (A): 64, 128, 256, 512 pixels Target Width (W): 8, 16, 32, 64 pixels
The input techniques included touch and a mouse. In the touch condition, participants used their index finger to interact with the tabletop surface, touching a target to select it. In the mouse condition, participants performed the task using a mouse in the convention manner.
The target conditions included four amplitudes (A = 64, 128, 256, and 512 pixels) and four widths (W = 8, 16, 32, and 64 pixels) for a total of 16 target conditions. These were chosen to ensure the interaction spanned a typical range of task difficulties. The hardest task had ID = log2(512/8 + 1) = 6.02 bits, while the easiest task had ID = log2(64/65 + 1) = 1.00 bits. For each A-W condition, a block of 20 selections was performed.
To measure and compare the performance of the two interaction techniques, three dependent variables were used: movement time (ms), error rate (%), and throughput (bps). Movement time was the mean time per trial, including both the time to move from the source target to the destination target and the time to make a selection. Error rate was the percentage of out-of-target selections. Throughput was calculated as described earlier (see Equation 4).
Procedure
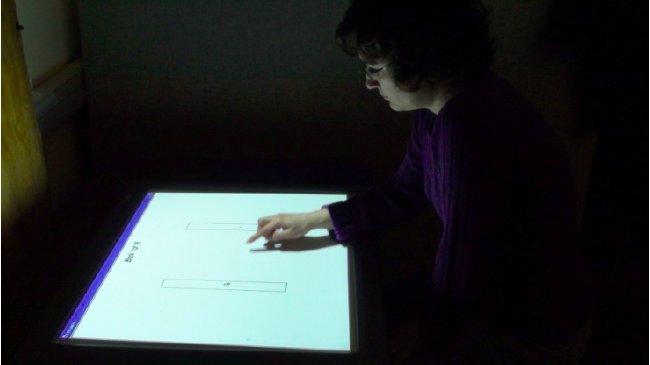
Each participant began by completing a consent form and a background questionnaire gathering demographic information (results above). Next, they were randomly assigned an input technique to start with. A practice session was administered with each input technique to allow participants to become comfortable with the environment, the task, and the input technique. Figure 4 shows a participant performing the task using touch input.
Following the practice session, participants completed one full experiment session that included 16 blocks with 20 trials/block. Each session lasted approximately 6-8 minutes. Participants then repeated the same procedure (one practice session + one experiment session) for the other input technique. Participants could take breaks before starting each block. They were told that the first click in each block is not included in the performance calculation. Each block was randomly generated from the 16 target width and target amplitude combinations. Participants were told to select back and forth between the two targets "as quickly and accurately as possible" 20 times using the assigned technique. In total, each participant performed 2 × 16 × 20 = 640 experiment trials.
At the end of the final session, participants completed a simple questionnaire and provided feedback on the task and the experimental platform. The entire experiment lasted approximately 30 minutes per participant.
Figure 4. A participant performing the experimental task
RESULTS AND DISCUSSION
Throughput
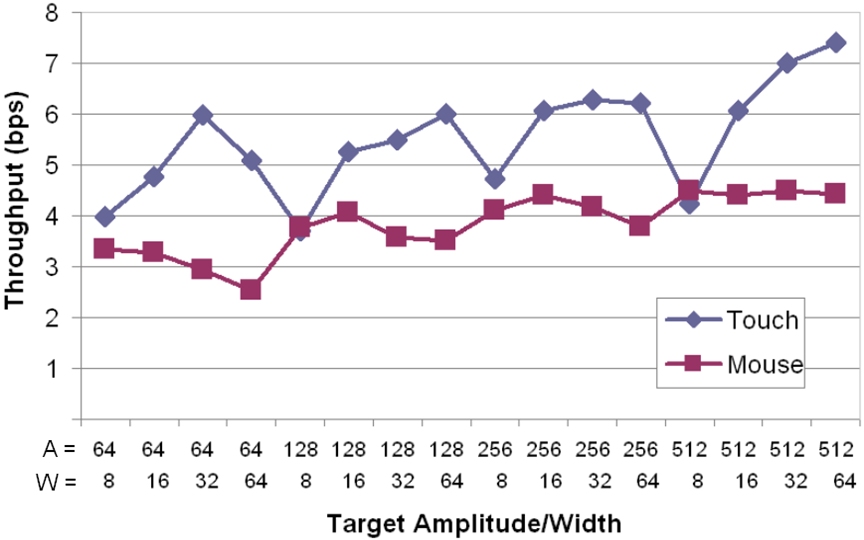
Touch interaction yielded a higher throughput compared to the mouse. The overall mean throughput for touch interaction was 5.52 bps, which was 41.1% higher than the 3.83 bps observed for the mouse. The effect of input technique on throughput was statistically significant (F1,11 = 35.51, p < .0001). Although not as high as the throughput reported by Forlines et al. (2007) for touch input (discussed earlier), our throughput values were computed using a direct division of means (Equation 4) and, thus, afford a more equitable comparison across conditions (because intercept effects are included). Clearly, our observations on throughput position touch input as a superior input modality compared to the mouse for tabletop displays.
Across target amplitude (A) and target width (W) conditions, throughput ranged from 3.69 bps to 7.41 bps for touch and from 2.53 bps to 4.49 bps using the mouse. The effect is seen in Figure 5. There are trends in the figure within each of the target amplitude/width conditions. For example, the lowest throughput during touch occurred at W = 8 pixels. The effect is even more dramatic for error rates (discussed next).
Figure 5. Throughput by block (A/W) and input technique
Error Rates
The error rates overall were much higher for touch-based interaction (mean = 9.8%) than with the mouse (mean = 2.1%). The effect was statistically significant (F1,11 = 74.17, p < .0001). Touch interaction yielded error rates as high as 32.9% for some target amplitude-width conditions. The highest per-condition error rate for the mouse, at 6.7%, was much less by comparison. See Figure 6.
Figure 6. Error rates (%) by block (A/W) and input technique

The error rates for touch interaction were high for small targets. Clearly, the four conditions in Figure 6 at W = 8 pixels (approximately 5 mm with the resolution used) are highly anomalous. Error rates were above 20% for all four such conditions. This result is similar to that reported by Forlines et al. (2007), who also found significantly higher error rates for small targets using touch interaction. The effect is also found in touched-based mobile environments, where it is sometimes called the "fat finger problem" (Wigdor et al., 2007). Clearly, selecting very small targets is problematic for touch-based interaction.
Movement Time
Movement times differed significantly between input techniques, with touch interaction significantly faster than the mouse (F1,11 = 66.99, p < .0001). See Figure 7. Block means for movement time ranged from 403 ms to 1051 ms using touch and from 607 ms to 1323 ms using the mouse. There are clear patterns within target amplitude (A) and width (W) conditions. Movement times tend to increase with increases in movement amplitude and decrease with increases in target width. These effects are well documented in Fitts' law studies (e.g., MacKenzie, 1995).
Figure 7. Movement time (ms) by block (A/W) and input technique

Qualitative Results
After the last session, participants completed a questionnaire gathering opinions on the two input techniques. They were asked to rank the techniques. Eleven participants ranked touch interaction as better than the mouse; one participant preferred the mouse.
Participants were also asked to rate the ease of use for each technique using a 10-point Likert scale with 9 as very easy to use and 0 as very hard to use. The result in Figure 8 reveals that participants liked touch interaction and thought it was easier to use than the mouse. This result is predictable since using the fingers and hands to interact with real-life objects is more natural.
Figure 8. Results for ease of use. 9 = very easy to use, 0 = very hard to use. Error bars show +1 SD.

Five participants reported that hearing beeps (sounded for each miss) in some of the hard trials affected their performance. This could explain the throughput results for the two blocks where the performance of the mouse input was slightly better than with touch input (see Figure 5). These blocks in fact had the highest error rates. Anecdotal observations also revealed that the mouse emulator for the DiamondTouch device was not 100% accurate, which affected some of the mouse errors in blocks with small widths. Participants also reported hand fatigue while using the mouse, especially during the last couple of blocks.
Our observations also confirm Forlines et al.'s (2007) suggestion that the distorted perspective on the horizontal tabletop display causes misses with increased distances between the participant and the graphical object. It was also noticed that participants' touch strategy differed among target distances and widths. For targets with small widths and large amplitudes, participants tended to use the pad of their fingertip (similar to giving a finger-print scan). This caused some misses, whereas with closer targets people used the tip of their finger (i.e., the skin close to the nail), and this was more accurate.
CONCLUSION
This research provides evidence that for tabletop interactive surfaces touch input is superior to the mouse in terms of throughput and movement time. However, our results indicate that a conventional mouse is more accurate overall compared to touch, the latter yielding a high number of misses with small targets. This supports earlier findings in a similar tabletop environment (Forlines, 2007). While touch interaction is natural and efficient, problems selecting small targets remain a challenge. Further research evaluating alternative touch-based selection techniques is needed. A subsequent study with stylus would provide a better means for comparison of performance among input techniques.
ACKNOWLEDGEMENT
We thank Edward Lank and members of the HCI lab at University of Waterloo for providing the DiamondTouch and the Collaborative Systems Lab for hosting the experiment. This research is sponsored by the Natural Sciences and Engineering Research Council of Canada (NSERC).
REFERENCES
Card, S., English, W., & Burr, B. (1978). Evaluation of mouse, rate-controlled isometric joystick, step keys, and text keys for text selection on a CRT. Ergonomics, 21, 601-613
Fitts, P. M. (1954). The information capacity of the human motor system in controlling the amplitude of movement. J Exp Psychology, 47, 381-391.
Fitts, P. M., & Peterson, J. R. (1964). Information capacity of discrete motor responses. J Exp Psychology, 67, 103-112.
Forlines, C., Wigdor, D., Shen, C., & Balakrishnan, R. (2007). Touch vs. mouse input for tabletop displays. Proc CHI 2007, 647– 656, New York: ACM.
ISO, Ergonomic requirements for office work with visual display terminals (VDTs), Part 9: Requirements for non-keyboard input devices. International Organization for Standardisation, 2000.
MacKenzie, I. S. (1995). Movement time prediction in human-computer interfaces. In R. M. Baecker, W. A. S. Buxton, J. Grudin, & S. Greenberg (Eds.), Readings in human- computer interaction (2nd ed.), 483-493. San Francisco: Kaufmann.
MacKenzie, I. S., Sellen, A., & Buxton, W. (1991). A comparison of input devices in elemental pointing and dragging tasks. Proc CHI '91, 161-166. New York: ACM.
Soukoreff, R. W., & MacKenzie, I. S. (2004). Towards a standard for pointing device evaluation: Perspectives on 27 years of Fitts' law research in HCI, Int J Human- Computer Studies, 61, 751-789.
Terrenghi, L., Kirk, D., Sellen, A., & Izadi, S. (2007). Affordances for manipulation of physical versus digital media on interactive surfaces. Proc CHI '07, 1157-1166. New York: ACM.
Wigdor, D., Forlines, C., Baudisch, P., Barnwell, J., & Shen, C. (2007). Lucid touch: A see-through mobile device. Proc UIST 2007, 269-278. New York: ACM.