Roig-Maimó, M. F., MacKenzie, I. S., Manresa-Yee, C., & Varona, J. (2018). Head-tracking interfaces on mobile devices: Evaluation using Fitts' law and a new multi-directional corner task for small displays. International Journal of Human-Computer Studies, 112, 1-15. doi:10.1016/j.ijhcs.2017.12.003 [PDF] [video]
Head-tracking Interfaces on Mobile Devices: Evaluation Using Fitts' Law and a New Multi-Directional Corner Task for Small Displays
Maria Francesca Roig-Maimó,a I. Scott MacKenzie,b Cristina Manresa-Yee,a & Javier Varonaa
a University of Balearic IslandsDept of Mathematics and Computer Science
Palma, Spain
{ xisca.roig@uib.es, cristina.manresa@uib.es, xavi.varona@uib.es }
b York University
Dept of Electrical Engineering and Computer Science
Toronto, Canada
mack@cse.yorku.ca
Abstract
A head-tracking interface using a mobile device's front camera was evaluated using two interaction methods: moving the head vs. moving the device. The evaluation used an Apple iPad Air and the multi-directional (MD) target selection test described in ISO 9241-411. Throughput was higher at 1.42 bits per second (bps) using head movement compared to 1.20 bps using device movement. Users also expressed a preference for the head input method in an assessment of comfort questionnaire. In a second user study, input using head movements was tested using a new multi-directional corner (MDC) task with an iPad Air and an Apple iPhone 6. The MDC task has two advantages over the MD task: a wider range of task difficulties is used and target selection is tested over the entire display surface, including corners. Throughputs were similar to those measured in the first user study, thus confirming the utility of the MDC task for evaluations on devices with small displays.Keywords: Fitts' law, head-tracking, multi-directional corner task, ISO 9241-411
1. Introduction
The integration of cameras combined with increased processing capacity on mobile devices has opened an area of research on vision-based interfaces (VBI). New interaction methods have been developed using the images captured by the camera as input primitives, often to detect the movement of the device (Henrysson et al., 2005; Hannuksela et al., 2005). In addition, the integration of front cameras opens the door to head-tracking interfaces (interaction with devices through head movements) as used in commercial applications (Hannuksela et al., 2008; Li et al., 2007). An example is the Smart Screen feature on the Samsung Galaxy S4 that uses the front camera to detect the position of the user's face. Face movements are used to perform functions like scrolling within documents, screen rotation, or pausing video playback.Previous work on head-tracking interfaces tends to focus on the development of new tracking methods instead of analyzing user performance. In general, results regarding the user's performance and experience are not sufficiently represented (MacKenzie and Teather, 2012).
There is prior research using head-tracking with desktop computers (De Silva et al., 2003; Magee et al., 2015), some of which used Fitts' law to model head movements (Plamondon and Alimi, 1997). Although head movements were found to conform to Fitts' law, this research has not extended to mobile devices.
Fitts' law describes the relationship between movement time, movement amplitude, and selection accuracy for people engaged in rapid aimed movements (Fitts, 1954). Since Fitts' original publication, the law has proven one of the most robust, highly cited, and widely adopted models to emerge from experimental psychology (MacKenzie, 1992). In human-computer interaction (HCI), Fitts' law is applied in primarily two ways, as a predictive model and as a means to derive the human performance measure throughput. The importance of throughput has been recognized by academic and industry researchers alike, as it is codified since 2002 in a ISO standard on the evaluation of pointing devices (ISO, 2002).
In this paper, we present an evaluation of user performance through Fitts' law for a mobile head-tracking interface following the multi-directional tapping test described in the ISO standard.
Since an experiment task should reflect the actual tasks performed by users, we designed an alternative task focused on the peculiarities of small displays.
The goal of the new task is to extend the range of IDs and to include target selection at the corners of the display. We present the design of the new task and the results of the evaluation of the head-tracking interface using this new task through a second user study.
The rest of this paper is organized as follows: Section 2 presents the tests described in the ISO standard and the calculation of throughput. Section 3 describes our head-tracking interface. Section 4 presents related work on the performance evaluation of input methods on mobile devices. Section 5 describes a user study to evaluate the performance of our head-tracking interface through Fitts' law on an Apple iPad Air following the ISO multi-directional test. Section 6 describes a new multi-directional corner task for small displays and a user study with an iPad Air and an Apple iPhone 6, again using Fitts' law. Finally, the last section discusses and summarizes the work.
2. ISO Testing and the Calculation of Throughput
ISO 9241-411 (ISO, 2012) describes performance tests for evaluating the efficiency and effectiveness of existing or new non-keyboard input devices1 . The primary tests involve point-select tasks using throughput as a dependent variable.
The calculation of throughput is performed over a range of amplitudes and 55 with a set of target widths involving tasks for which computing devices are intended to be used.
The ISO standard proposes both a one-directional point-select test and a multi-directional point-select test.
2.1. One-directional Point-select Test
Inspired by the Fitts paradigm, the one-directional point-select test evaluates pointing movements along one axis. Two rectangle targets of width W and with a centre-to-centre amplitude A are presented to the user (see Fig. 1a). The user is required to point and click, back and forth, between the targets a predefined number of times. Each sequence of trials starts when the user first moves the cursor into a rectangle target and selects it.
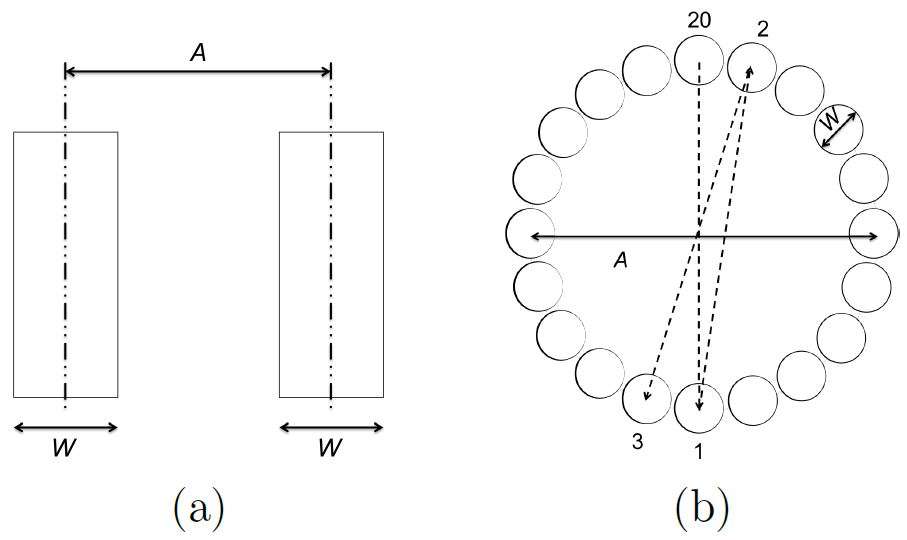
Fig. 1. ISO tests for pointing evaluation: (a) One-directional point-select test (b) Multi- directional point-select test.
2.2. Multi-directional Target-select Test
The multi-directional test evaluates point-select movements in different directions. The user moves the cursor across a layout circle to sequential targets (see Fig. 1b) equally spaced around the circumference of the circle. Each sequence of trials begins and ends in the top target and alternates on targets moving across and around a layout circle.
2.3. Calculations for Input Device Throughput
The ISO standard specifies only one performance measure, throughput. Throughput (TP) is calculated as follows:
| (1) |
where IDe is computed from the movement amplitude (A) and target width (W) and MT is the per-trial movement time averaged over a sequence of trials. Because IDe has units "bits" and MT has units "seconds", the units for throughput are "bits per second" or "bps".
The effective index of difficulty is a measure, in bits, of the difficulty and user precision achieved in accomplishing a task:
| (2) |
where We is the effective target width, calculated from the width of the distribution of selection coordinates made by a participant over a sequence of trials.
The effective target width is calculated as follows:

| (3) |
where Sx is the standard deviation of the selection coordinates in the direction that movement proceeds. The effective value is used to include spatial variability in the calculation. The effective amplitude (Ae) can also be used if there is an overall tendency to overshoot or undershoot (Soukoreff and MacKenzie, 2004).
Using the effective values, throughput is a single human performance measure that embeds both the speed and accuracy in human responses. A detailed description of the calculation of throughput is found in other sources (Soukoreff and MacKenzie, 2004; MacKenzie, 2015).
3. Head-Tracking Interface
Head-tracking interfaces provide a way to interact with devices through the movements of the head (López et al., 2012; Shan, 2010). Although there are several existing camera-based solutions to detect head movement (Hirsch et al., 2014; Williamson et al., 2013), an important requirement is to avoid additional sensors or equipment, especially when the aim is interaction with mobile devices.
The integration of front cameras combined with an increase in processing capacity with contemporary devices enables the detection of head movement only using the information in the images provided by the front camera. This opens the possibility of developing head-tracking interfaces for mobile devices without requiring additional components.
For our current research, we used a camera-based head-tracking interface for general-purpose computers (Varona et al., 2008; Manresa-Yee et al., 2014) and adapted and optimized it for mobile devices (the head-tracking interface was developed in iOS 8.0). The interface uses front-camera data to detect features in the nose region, to track a set of points, and to return the average point as the nose position (i.e., the head position of the user) at every timestamp (see Fig. 2).
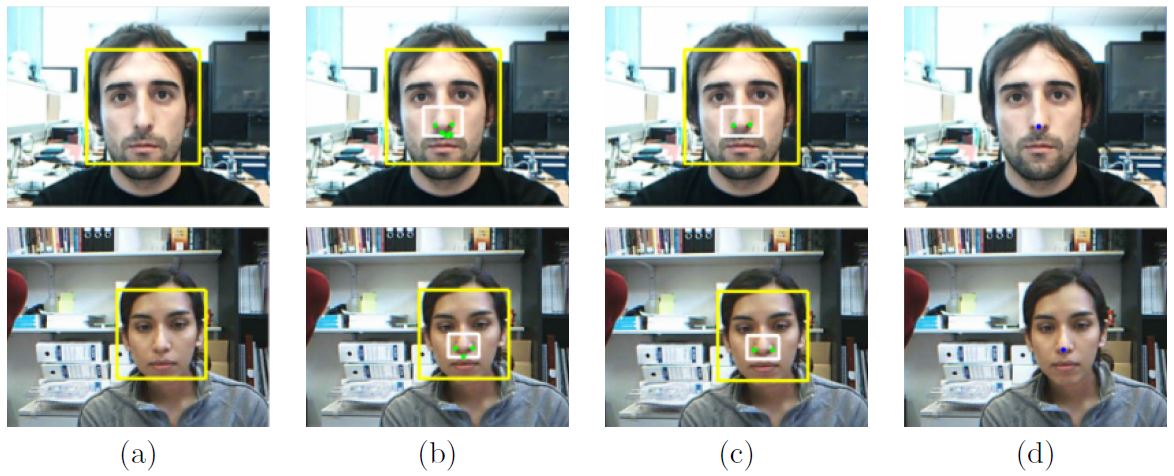
Fig. 2. Stages of the real-time nose tracking algorithm: (a) automatic face detection (b) initial set of features (c) best feature selection using symmetrical constraints (d) mean of the selected features: tracked nose point.
The nose position is then translated to the mobile display by a pre-defined transfer function based on differential positioning. The interface reports the change in coordinates, with each location reported relative to the previous location, rather than to a fixed location. To perform a selection, we generate a touch event.
The system is stable and robust for different users, different light conditions, and a range of backgrounds. We direct the reader to Roig-Maimó et al. (2016a) for a technical description of the head-tracking interface. Related work established the method's viability in target selection tasks with non-disabled users (Roig-Maimó et al., 2015) and disabled users (Roig-Maimó et al., 2016b).
4. Related Work
Previous work on the analysis of user performance on mobile devices falls into two main groups depending on the goals of the research and the measures used to analyze user behavior. The first group examines user performance with the goal of exposing differences in the interfaces or interaction techniques under investigation.
Park et al. (2008) investigated the effect of touch key size (4 mm, 7 mm, and 10 mm wide) and location (25 locations equally distributed on the display) on a mobile phone's usability in terms of success rate, the number of errors, and the key-press convenience. They concluded that the larger the touch key size, the better the performance achieved. In addition, they identified appropriate and inappropriate touch key locations.
Cuaresma and MacKenzie (2014) compared tilt-input and facial tracking as input methods for mobile gaming. User performance was measured using a game called StarJelly, an endless runner-style game in which players avoid obstacles and collect stars. The dependent variables were "survival time", "stars collected", and "score". The tilt-input method triumphed over facial tracking.
Roig-Maimó et al. (2015) used a mobile head-tracking interface to investigate the effect of device orientation (portrait, landscape), gain of the head-tracking interface (1.0, 1.5), and target width (88 pixels, 176 px, 212 px) in terms of selection errors, selection accuracy, and velocity (Note: 1 mm ≈ 12 px). They provided two design recommendations about gain and target width for designers using such interfaces: target width should be higher than 176 px and the gain of the interface should be 1.0.
Henze et al. (2011) analyzed the touch behavior for smartphones using the game Hit It!, published on the Android Play Store. They determined the error rate for different target sizes and screen positions and showed that touch events systematically increase at positions in the lower-right of display. They described a function that shifts the touch events to reduce errors. We now examine a second group of previous work, focusing on Fitts' law evaluations of touch input for mobile devices. Unfortunately, such a review is difficult due to the substantially different methods in the literature for calculating throughput.
MacKenzie (2015) reported a throughput of 6.95 bps for touch-based interaction on a smartphone. The calculation followed the method detailed in ISO 9241-411 (including the adjustment for accuracy) and the experiments included both the 1D and 2D task types recommended in ISO 9241-411.
Perry and Hourcade (2008) reported a throughput around 4 bps for touch-based interaction. They used the index of difficulty instead of the effective index of difficulty for the calculation of throughput (as detailed in ISO 9241-411). Thus, the measure does not embed the accuracy of users' responses. They used a custom task for the experiment where every combination of position (25 unique positions) and size (five different target sizes) appeared randomly for each sub-block (two sub-blocks). The start target was positioned below the targets unless the destination target was in the bottom two rows; in this case, the start target was above the destination target.
Henze and Boll (2011) reported an implausibly high value for throughput in the range of 16 to 25 bps for touch-based interaction. Throughput was calculated as 1 / b from the regression equation (instead of using the division of means, as detailed in ISO 9241-411). They used a custom task where circles of different sizes were displayed and the player sequentially touched the targets. They obtained a low correlation in the regression equation and argued that the high throughput suggests that the task might be different from what is commonly used as a Fitts' law task (recommended by ISO 9241-411) and the low correlation shows that Fitts' law is not a good model for the tasks employed.
Despite the standardization efforts, inconsistency in the calculation of throughput is common in the HCI literature and this weakens between-study comparisons. As the main application of Fitts' law in HCI is the comparison of different input devices or techniques based on throughput, it is vital for the method of calculation to be consistent across the studies compared. This is one of the benefits in calculating throughput as per the ISO standard (ISO, 2012; MacKenzie, 2015).
In the case of head-tracking interfaces, the literature includes analyses of user performance through Fitts' law for desktop computers (De Silva et al., 2003; Magee et al., 2015). But, to the best of our knowledge, there are no Fitts' law studies on user performance of head-tracking interfaces with mobile devices.
In the following sections, we present two experiments, or user studies, examining the potential of head-tracking interfaces on mobile devices.
5. Experiment 1: Multi-directional Pointing
The main goal of experiment 1 is to evaluate a mobile head-tracking interface following the recommendations described in the ISO standard and to obtain a benchmark value of throughput. This will allow comparisons with other input devices and methods. One particular interest is to compare head-tracking interaction via moving the head versus moving the device.
5.1. Method
5.1.1. Participants
Twelve participants (4 females) were recruited from a university campus in Canada. Ages ranged from 21 to 40 with a mean of 27.4 years (SD = 6.29). There were no requirements on prior experience to participate in the study. Participants were compensated the equivalent of $9 US.
Participants had some previous experience with gyroscope control for interacting with mobile devices, as determined in a pre-test questionnaire (mean of 2.42 on a 4-point Likert scale, i.e., between Rarely (once a month or less) and Infrequently (several times a month)). None of the participants had previous experience with head-tracking interfaces.
5.1.2. Apparatus
The experiment was conducted on an Apple iPad Air with a resolution of 2048 × 1536 px and a pixel density of 264 ppi. This corresponds to a resolution of 1024 × 768 Apple points.2 All communication with the tablet was disabled during testing.
The software implemented the ISO multi-directional tapping test (see Fig. 3 for details).
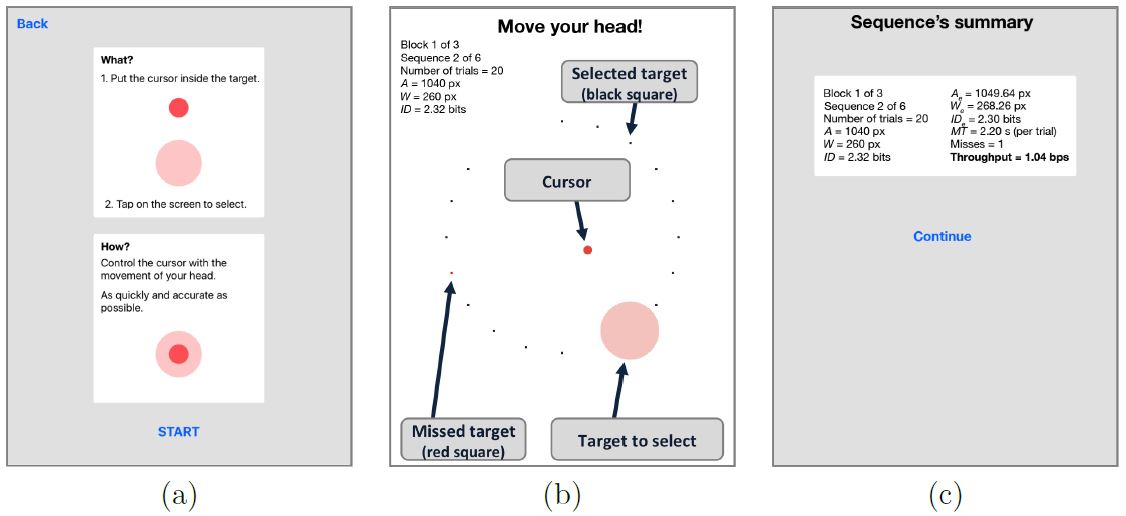
Fig. 3. Screenshots of the experiment software: (a) instructions (b) example target condition with annotations (A = 1040 px, W = 260 px) and one target missed shown as a red square (c) summary results.
User input combined the mobile head-tracker for the pointing action and touch for selection.
Each sequence consisted of 20 targets with the target to select highlighted for each trial. Upon selection, a new target was highlighted. Selections proceeded in a pattern moving across and around the layout circle until all targets were selected. If a target was missed, a small red square appeared in the center of the missed target; otherwise, a small black square appeared showing a correct selection. The target was highlighted in green when the cursor was inside it.
At the end of each sequence, summary results appeared. Providing summary results is useful for demos and to help inform and motivate participants during testing.
5.1.3. Procedure
After signing a consent form, participants were briefed on the goals of the experiment and were instructed to sit and hold the device in portrait orientation in a comfortable position (see Fig. 4). The only requirement was that their entire face was visible by the front camera of the device. The experiment task was demonstrated to participants, after which they did a few practice sequences for each input condition. For head interaction, they were instructed to move the cursor by holding the device still and moving their head. For device interaction, they were to move the cursor by moving (i.e, rotating) the device, keeping their head still. For both modes, selection occurred by tapping anywhere on the display surface with a thumb when the cursor was inside the target. Testing began after they felt comfortable with the task and the interaction method.
Participants were asked to select targets as quickly and accurately as possible and to leave errors uncorrected. They were told that missing an occasional target was OK, but that if many targets were missed, they should slow down. They were allowed to rest as needed between sequences. Testing lasted about 30 minutes per participant.
After completing the experiment, participants assessed the usability of the head-tracking interface by answering a comfort assessment questionnaire based on ISO 9241-411.
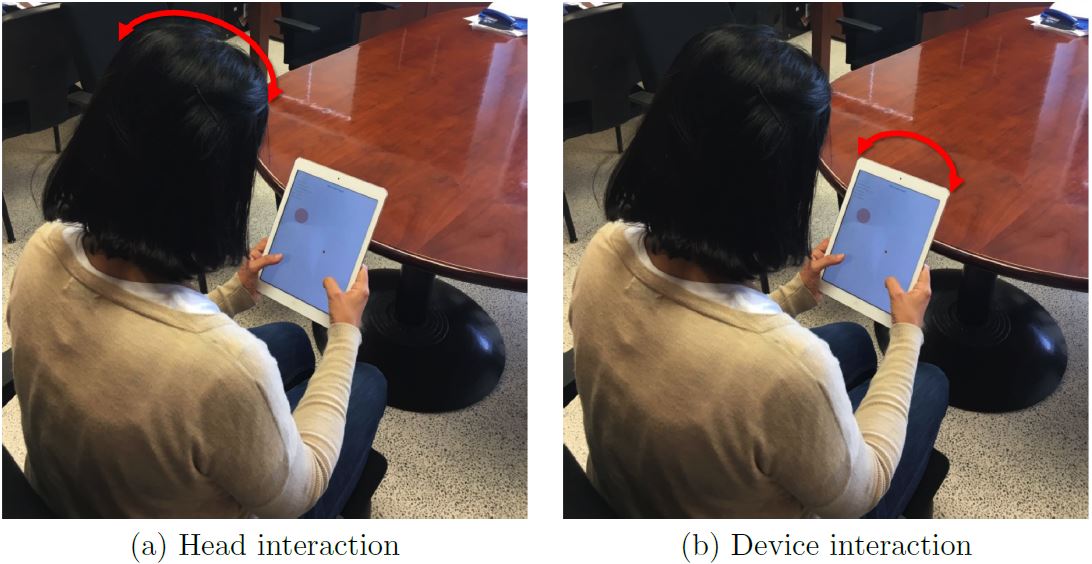
Fig. 4. Participant performing the experiment. Moving the cursor (a) by moving the head and (b) by moving the device. For both modes, selection occurred by tapping anywhere on the display surface with a thumb when the cursor was inside the target.
5.1.4. Design
The experiment was fully within-subjects with the following independent variables and levels:
- Interaction mode: head, device
- Block: 1, 2, 3
- Amplitude: 260, 520, 1040 px
- Width: 130, 260 px
The primary independent variable was interaction mode, with input performed either using head movements or device movements. Both interaction modes are based on the nose position in the image captured from the mobile device camera. The difference is that the user originates change in the nose position in the image either by moving his/her head or by moving the device. Block, amplitude, and width were included to gather a sufficient quantity of data over a reasonable range of task difficulties (with IDs from 1.00 to 3.17 bits).
For each condition, participants performed a sequence of 20 trials. The two interaction modes were assigned using a Latin square with 6 participants per order. The amplitude and width conditions were randomized within blocks.
The dependent variables were throughput, movement time, and error rate. The total number of trials was 12 participants × 2 interaction modes × 3 blocks × 3 amplitudes × 2 widths × 20 trials = 8,640.
5.2. Results and Discussion
In this section, results are given for throughput, movement time, and error rate. Fitts' law models are also presented, as are tests on the distribution characteristics of the selection coordinates. Usability results are also presented. We begin with an examination of the learning effects over the three blocks of testing.
5.2.1. Learning Effects
Since head-tracking input was unfamiliar to all participants, a learning effect was expected. Fig. 5a shows the learning effect for movement time by interaction mode. The learning effect (i.e., block effect) was statistically significant (F2,22 = 10.57, p < .001), confirming the expected improvement with practice. The effect was more pronounced between the 1st and 2nd blocks, with 17.9% decrease in movement time, compared to a smaller decrease of 8.6% between the 2nd and 3rd blocks.
The learning effect for throughput is shown in Fig. 5b. For all three blocks, throughput was higher for head interaction mode compared to device mode. Although the learning effect was statistically significant (F2,22 = 14.19, p < .001), Helmert contrasts showed that the effect was not significant after block 1, corresponding to about 10 minutes of practice. As throughput is the dependent variable specified in ISO 9241-411, subsequent analyses are based on the pooled data from the 2nd and 3rd blocks of testing.
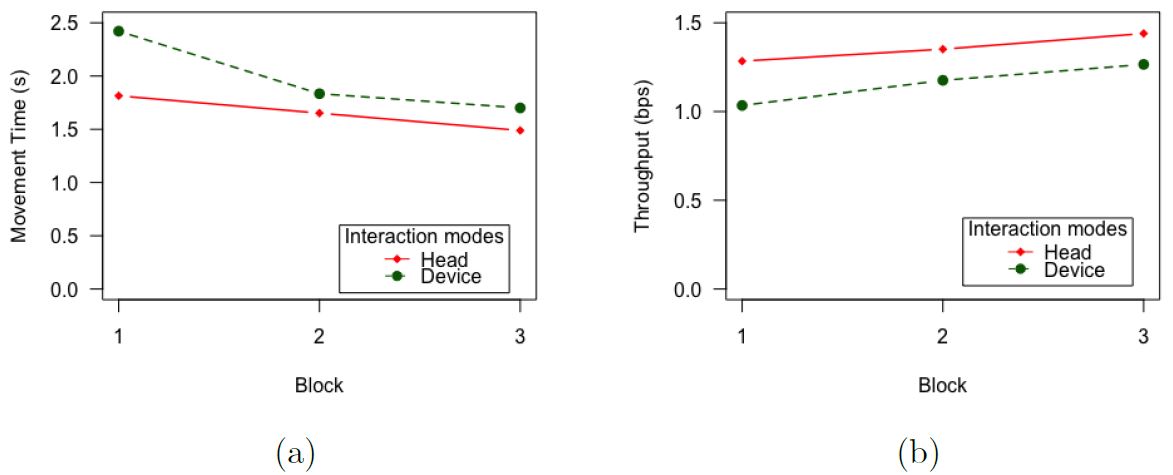
Fig. 5. Results for interaction mode and block (a) for movement time and (b) for throughput.
5.2.2. Throughput
The grand mean for throughput was 1.31 bps. This value is low compared to a desktop mouse where throughput is typically about 4.5 bps (Soukoreff and MacKenzie, 2004). Of course, the current study is in the mobile context so lower values are perhaps expected. The value just cited is closer to the value of throughput for tilt-based interaction (around 1.75 bps (MacKenzie and Teather, 2012)). If we compare this value with head input on desktop environments, our value is also within the expected range (from 1.28 bps to 2.10 bps (Magee et al., 2015; De Silva et al., 2003)).
The mean throughput for the head interaction mode was 1.42 bps, which was 17.4% higher than the mean throughput of 1.20 bps for the device interaction mode. The difference was statistically significant (F1,11 = 8.63, p < .05).
5.2.3. Movement Time and Error Rate
The grand mean for movement time was 1.65 s per trial. By interaction mode, the means were 1.76 s (device) and 1.53 s (head). The difference was statistically significant (F1,11 = 7.72, p < .05). The grand mean for error rate was 8.50% per sequence. By interaction mode, the means were 8.58% (device interaction mode) and 8.42% (head interaction mode). The difference was not statistically significant (F1,11 = 0.02, p > .05). Finally, and as expected, the error rate is higher as the target width decreases and as amplitude increases (see Fig. 6).
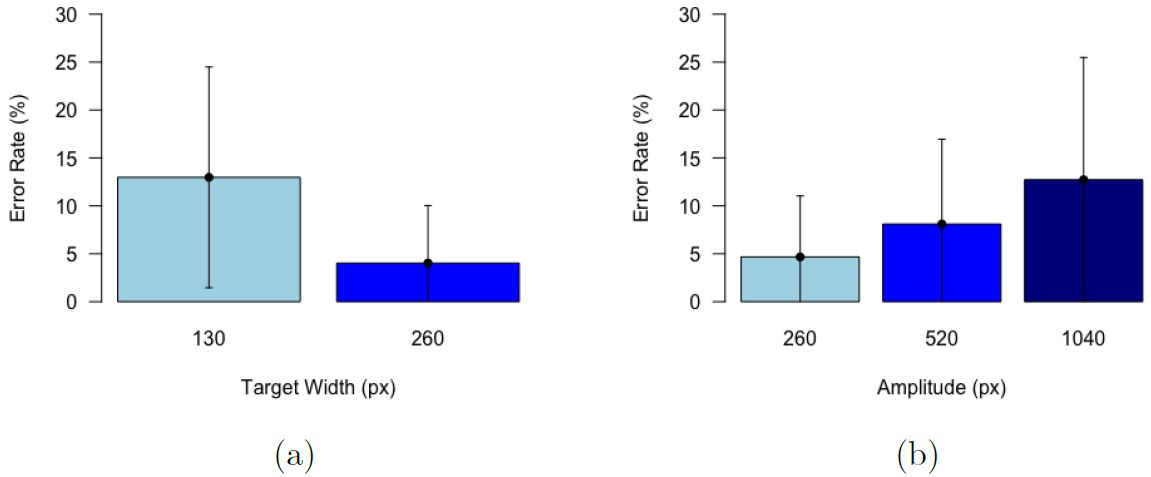
Fig. 6. Error rate (%) by (a) target width and (b) amplitude.
5.2.4. Fitts' Law Models
To test whether head-tracking interfaces follow Fitts' law, we separately examined the six combinations of target widths and movement amplitudes and computed the effective index of difficulty (IDe ) and the movement time (MT) for each combination (see Table 1). The IDe values were calculated using the We values, which in turn were calculated as the mean of the We values computed for each sequence of trials (across participants, blocks 2 and 3, and A-W conditions).
Data points for the Fitts' law models.
| A (px) | W (px) | ID (bits) | Head | Device | ||||
|---|---|---|---|---|---|---|---|---|
| We (px) | IDe (bits) | MT (ms) | We (px) | IDe (bit) | MT (ms) | |||
| 260 | 130 | 1.58 | 143.0 | 1.49 | 1304 | 133.4 | 1.56 | 1418 |
| 260 | 260 | 1.00 | 202.2 | 1.19 | 968 | 192.2 | 1.23 | 1149 |
| 520 | 130 | 2.32 | 147.6 | 2.18 | 1765 | 134.8 | 2.28 | 2057 |
| 520 | 260 | 1.58 | 180.4 | 1.96 | 1180 | 209.2 | 1.80 | 1388 |
| 1040 | 130 | 3.17 | 172.8 | 2.81 | 2347 | 207.2 | 2.59 | 2656 |
| 1040 | 260 | 2.32 | 240.0 | 2.42 | 1645 | 241.0 | 2.41 | 1892 |
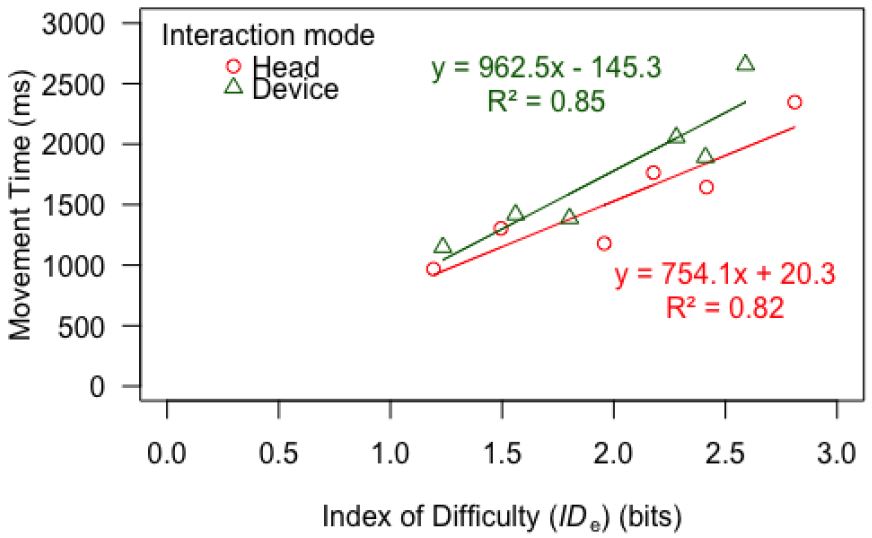
Fig. 7. Fitts' law regression results for the two interaction modes.
Fig. 7 shows scatter plots and regression lines for the six MT-IDe points for each interaction mode. The R-squared values obtained for the models are above 0.8, so the models explain more than 80% of the variability of the data. Therefore, we conclude that head-tracking input conforms to Fitts' law.
5.2.5. Distribution Measures and Normality Test
Additional analyses were done on the distribution characteristics of the selection coordinates. Measurements and tests were performed on each sequence of 20 trials with selections projected onto the task axis. The number of sequences was 12 participants × 2 interaction modes × 2 blocks × 3 amplitudes × 2 widths = 288.
The mean skewness of the distributions was 0.23 (SD = 0.95) and the mean kurtosis was 1.19 (SD = 3.0). These figures are low, indicating no overall tendency towards a negative or positive skewness or toward a flat or peaked distribution.
A normality test was conducted using the Lilliefors procedure at alpha = 0.05. 84.7% of the sequences were deemed to have selection coordinates conforming to the normal distribution; which is to say, the null hypothesis of normality was not rejected.
5.2.6. Assessment of Comfort Questionnaire
Fig. 8 shows the results for the ten questions in the questionnaire assessing comfort. A Wilcoxon rank-sum test over the entire questionnaire shows significant differences between the two interaction modes (z = 3.49, p < 0.001). Since each response was rated on a seven-point scale, a value of 4 is the mid-point. The overall response means were 5.5 for the head interaction mode and 4.9 for the device interaction mode, indicating participants had a positive impression for both interaction modes (i.e., above the midpoint).
A Wilcoxon rank-sum test for individual questions revealed significant differences only in the fatigue questions for Wrist (z = 2.61, p < 0.01), Arm (z = 2.42, p < 0.05) and Neck (z = −2.86, p < 0.01). As expected, the differences between interaction mode were greatest, and in the expected direction, for wrist fatigue (with medians of 6.5 and 3.5 for the head and device modes, respectively) and neck fatigue (with medians of 3.5 and 7.0 for head and device modes, respectively). Nevertheless, the fatigue ratings for both interactions modes were acceptable.
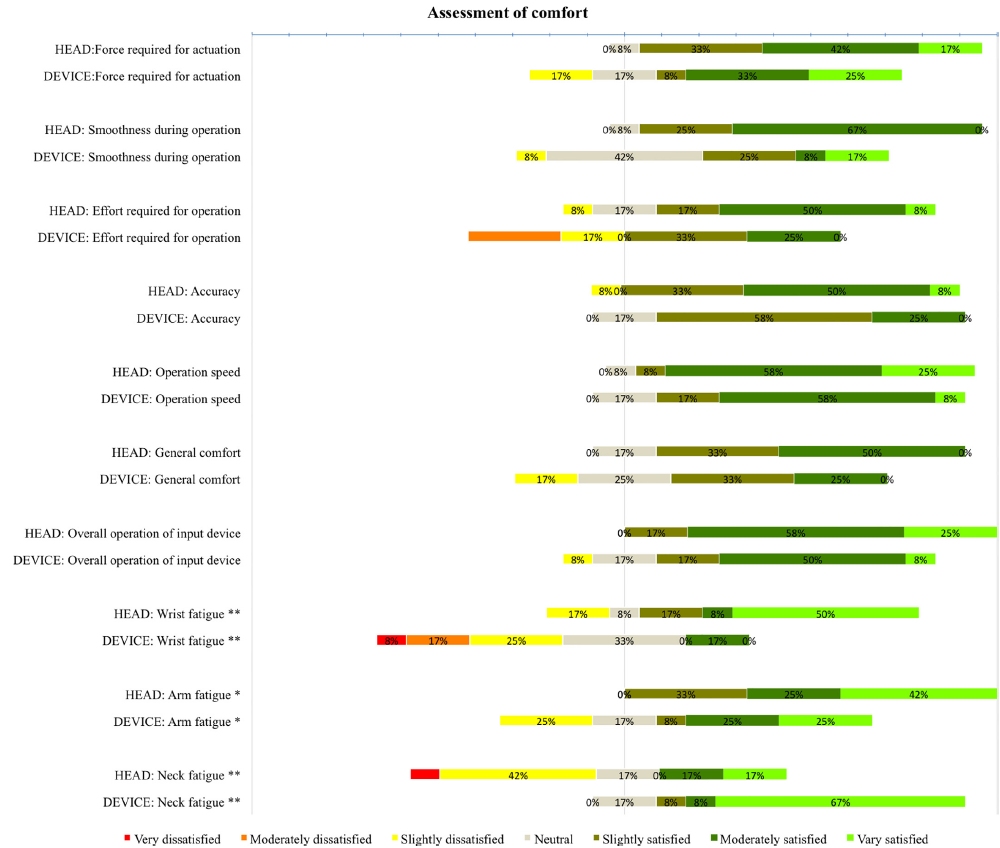
Fig. 8. Responses of the assessment of comfort questionnaire (* p < .05; ** p < .01).
Furthermore, a majority of the answers were positive (slightly/moderately/very satisified) regarding force required, smoothness, effort required, accuracy, speed, general comfort, and overall rating.
In summary, the ISO subjective comfort assessment shows difference between the two interaction modes favoring the head interaction mode, mainly in fatigue. Nevertheless, the comfort ratings were reasonably good for both interaction modes.
5.3. Conclusion (Experiment 1)
Our first user study evaluated user performance with a mobile head-tracking interface with movement performed either by moving the head or by moving the device. The evaluation used Fitts' law and the multi-directional tapping test described in ISO 9241-411.
Results indicate that head-tracking input on mobile devices conforms to Fitts' law. The mean throughput for the head mode was 1.42 bps, which was 17.4% higher than the mean throughput for device mode. Therefore, we recommend the use of the head-tracking interface by moving the head. This value is low compared to a desktop mouse, but is within the range of desktop head-tracking interfaces and close to mobile tilt-based interaction. Overall, the head-tracking interface received a more positive rating in the assessment of comfort questionnaire.
6. Experiment 2: Multi-directional Corner Task
Since the tests described in the ISO standard were conceived for desktop environments, there are limitations for small displays. First, only a relatively small range of task index of difficulties (IDs) can be tested due to the circular arrangement of the targets and the limited size of the display (i.e., limited movement amplitudes between targets). Second, due to the circular arrangement of targets, interaction at the corners of the display is not tested.
For that reason, we designed and evaluated an alternative task – the multi-directional corner (MDC) task – for Fitts' law testing on small displays. There are two goals of the MDC task: (1) to increase the range of IDs and (2) to include target selection at the corners of the display.
6.1. Multi-directional Task – A Review
The standard ISO 2D task, as used in experiment 1, is hereafter referred to as the multi-directional (MD) task. If we attempt to replicate the MD task on a device with a small display, the maximum amplitude is limited by the smallest dimension of the display (e.g., display width for a portrait device).
As an example, Fig. 9 illustrates the practical extremes of MD tasks for an Apple iPhone 6, which has a display resolution of 1334 × 750 px and a pixel density of 326 ppi.3 With W = 260 px for the widest target, amplitudes range from 260 px to 490 px, corresponding to IDs of 1.00 bit (see Fig. 9a) and 1.53 bits (see Fig. 9b), respectively. Using the same amplitudes, if W = 130 px for the narrowest target, IDs range from 1.58 bits (see Fig. 9c) to 2.25 bits (see Fig. 9d), respectively. The ID range overall is therefore 1.00 to 2.25 bits, which is far off the 2 to 8 bit range proposed in ISO 9241-411. The lowest ID is always 1 bit, which occurs when the widest targets are touching. The highest ID is limited by two factors: (1) the smallest dimension of the display (which determines the largest amplitude) and (2) the smallest target width for which selection is possible. The second factor occurs because selecting very small targets is simply not feasible for some modes of input, such as touch input or head tracking.
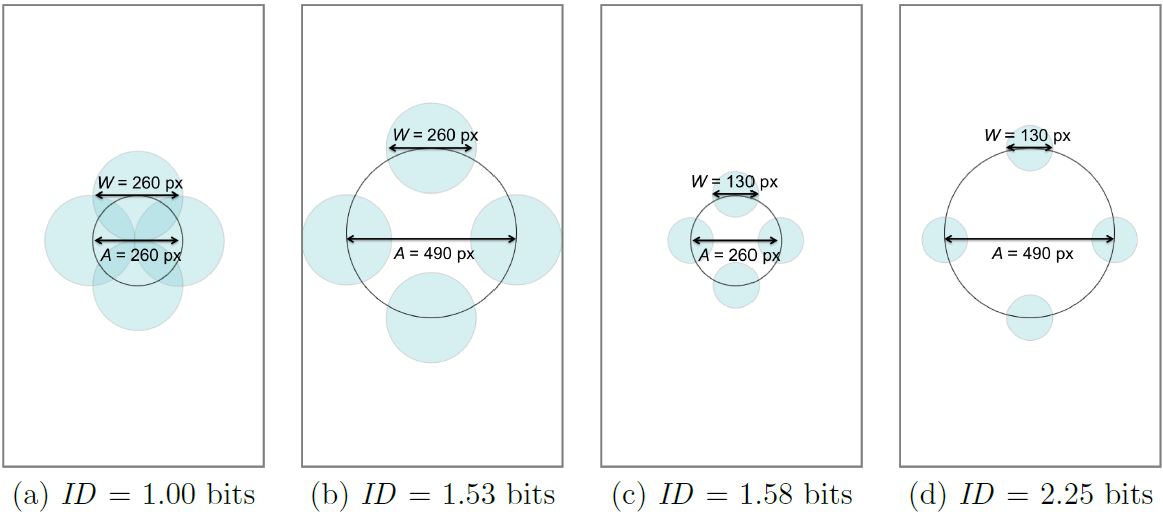
Fig. 9. Practical range of target conditions for the multi-directional (MD) task on a iPhone 6 display with resolution 750 × 1334 px. Note that targets do not appear at the corners of the display.
Besides the ID range, a second limitation of the MD task is that target selection is not performed at the corners of the display. For small devices, all regions of the display are important. Therefore, the tasks should include targets positioned at the corners of the display.
6.2. Multi-directional Corner Task
For the multi-directional corner (MDC) task, the circular sequence of trials is divided into four subspaces, one for each corner of the display (see Fig. 10). The user is required to move the cursor back and forth between a corner target and targets spaced along a circular arc opposite the corner target. This is repeated for each subspace. The movement from the last target in a subspace to the first target in the next subspace does not count as a trial since the movement amplitude is different. The pattern of selections over the four subspaces is shown in Table 2.
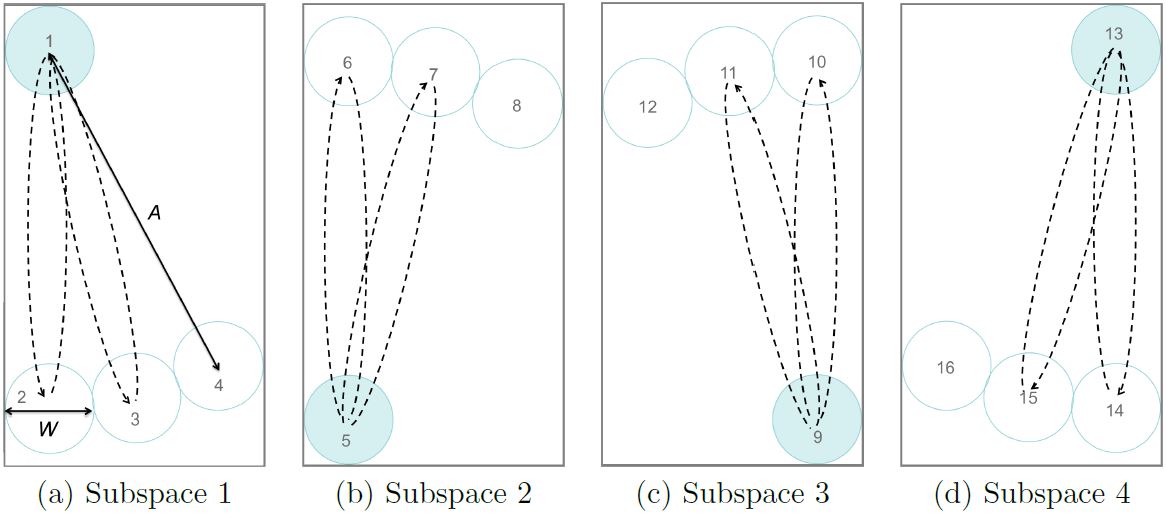
Fig. 10. Multi-directional corner (MDC) task showing four subspaces with targets positioned at the corners of the display. (Numbers added to identify targets. See Table 2 for sequence of selections.)
Example sequence of 24 trials for the multi-directional corner (MDC) task. (See Fig. 10 for target positions.)
| Subspace 1 | Subspace 2 | Subspace 3 | Subspace 4
| ||||||||
|---|---|---|---|---|---|---|---|---|---|---|---|
| Trial | Targets | Trial | Targets | Trial | Targets | Trial | Targets
| ||||
| Begin | End | Begin | End | Begin | End | Begin | End
| ||||
| - | Center | 1 | - | 1 | 5 | - | 5 | 9 | - | 9 | 13 |
| 1 | 1 | 2 | 7 | 5 | 6 | 13 | 9 | 10 | 19 | 13 | 14 |
| 2 | 2 | 1 | 8 | 6 | 5 | 14 | 10 | 9 | 20 | 14 | 13 |
| 3 | 1 | 3 | 9 | 5 | 7 | 15 | 9 | 11 | 21 | 13 | 15 |
| 4 | 3 | 1 | 10 | 7 | 5 | 16 | 11 | 9 | 22 | 15 | 13 |
| 5 | 1 | 4 | 11 | 5 | 8 | 17 | 9 | 12 | 23 | 13 | 16 |
| 6 | 4 | 1 | 12 | 8 | 5 | 18 | 12 | 9 | 24 | 16 | 13 |
Returning to the iPhone 6 as an example, the MDC task offers a wider range of index of difficulties than the MD task. With W = 260 px for the widest target, amplitudes range from 260 px to 1040 px, corresponding to IDs of 1.00 bit (see Fig. 11a) and 2.32 bits (see Fig. 11b), respectively. Using the same amplitudes, if W = 130 px for the narrowest target, IDs range from 1.58 bits (see Fig. 11c) to 3.17 bits (see Fig. 11d), respectively. The ID range overall is therefore 1.00 to 3.17 bits. Consequently, the highest ID using the MDC task is 41% higher than the highest ID using the MD task. Despite achieving a wider ID range, it is still far off the 2 to 8 bit range proposed in ISO 9241-411. Using the MDC task, the largest amplitude is increased but the highest ID is still limited by the smallest target width for which selection is possible. For some modes of input, selecting very small targets is simply not practical, as just noted. For example, the precison of touch input is typically limited by the user's finger width at the distal joint, which is about 14 mm (MacKenzie, 2015). This is equivalent to 180 px on an iPhone 6. For head tracking input, the minimum recomended target width for good accuracy is about 130 px (Roig-Maimó et al., 2015), assuming the same pixel density. So, the inability to extend IDs up to 8 bits in the present research is due to two factors. First, the inherently small display places a limit on the maximum amplitude. Second, the mode of input precludes using very small targets. Note that the goal of the MDC task is not simply to increase the range of IDs but also to test target selection at the corners of the display, which is critical for small devices.
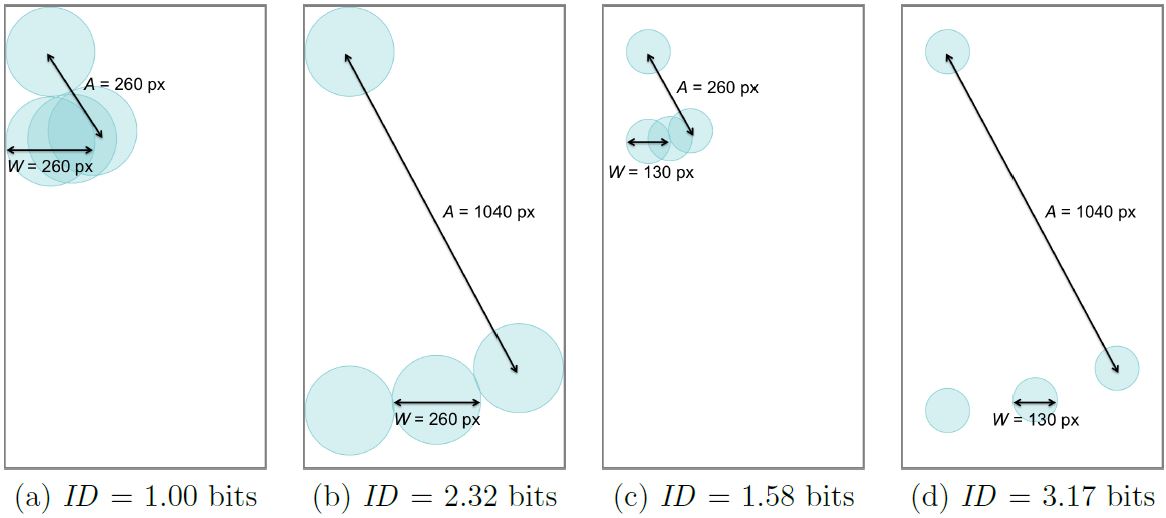
Fig. 11. Practical range of target conditions for the multi-directional corner (MDC) task on an iPhone 6 display with resolution 750 × 1334 px. Note that the examples above only pertain to subspace 1.
6.3. Method
The second study used the head-tracking interface with the head interaction mode which performed better than the device interaction mode in the first study.
The main contribution of the second user study is to introduce the multi-directional corner (MDC) task and to empirically compare it with the traditional multi-directional (MD) task that is described in the ISO 9241-411 standard.
To compare the MD and MDC tasks and to avoid confounding variables, the second experiment first used an Apple iPad Air. The MD trials were implemented in the usual manner (e.g., see experiment 1) and the MDC trials were implemented in the middle of the display in an area the size of the display on an Apple iPhone 6. The same target amplitudes and target widths were used for the MD and MDC trials. Following this and for the purpose of demonstrating and validating the MDC tests, extended trials were performed on an actual iPhone 6 using the same target amplitudes and target widths as on the iPad Air. The plan for experiment 2, showing the testing on the iPad Air and iPhone 6, is illustrated in Fig. 12.
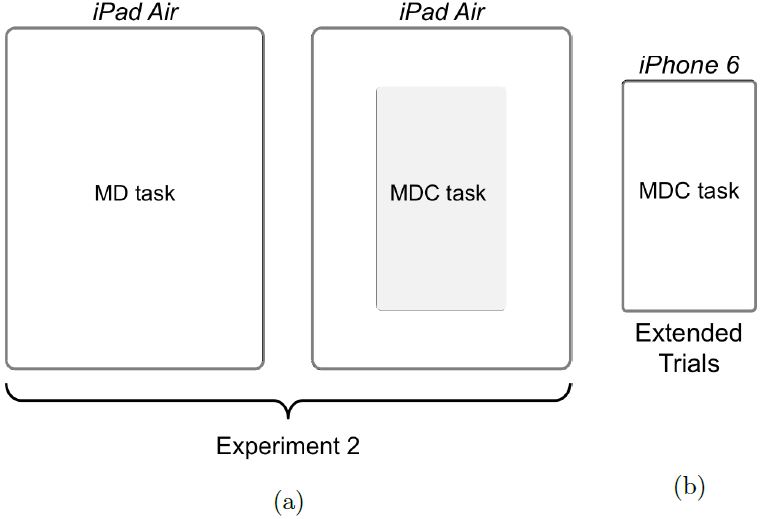
Fig. 12. (a) To avoid confounds, the MD and MDC tasks were compared on the same device, an Apple iPad Air, using the same target amplitudes and target widths. In the case of the MDC task, testing was constrained to the grey box, in an area equivalent to the display of an Apple iPhone 6. (b) Extended trials used an actual iPhone 6.
6.3.1. Participants
Fourteen unpaid participants (4 females) were recruited from the local university campus in Spain from an age group of 21 to 71. The average age was 35.6 years (SD = 15.9). None of the participants had previous experience with head-tracking interfaces.
6.3.2. Apparatus
As we were interested in comparing the MDC task with the standard MD task, we used a device with a bigger display so the MD task could be implemented using the same target conditions (see Fig. 13). In order to test the same range of IDs in the two tasks, a larger area of the display was used for the MD task, compared to the MDC task.
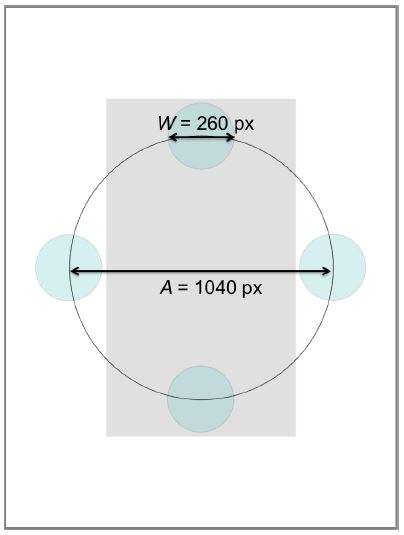
Fig. 13. Circular arrangement of the standard multi-directional task for target condition A = 1040 px, W = 260 px. Display area is shown in white for the iPad Air and in gray for the simulated iPhone 6.
And so, the experiment was conducted on an Apple iPad Air with a resolution of 2048 × 1536 px and a pixel density of 264 ppi (Note: 1 mm ≈ 10 px.). All communication with the tablet was disabled during testing.
We adapted the software of experiment 1 by adding a module for the multi-directional corner task which simulated the display of an iPhone 6 with a gray view of 750 × 1334 px centered on the display (see Fig. 14b and Fig. 15b).
6.3.3. Procedure
We followed the same procedure as in experiment 1 (see Section 5.1.3) except that participants were told to interact with the interface by moving their head (since the head interaction mode obtained the best throughput in the first experiment). Since only one interaction mode was used, participants did not answer the comfort assessment questionnaire after completing the experiment. Testing lasted about 30 minutes per participant.
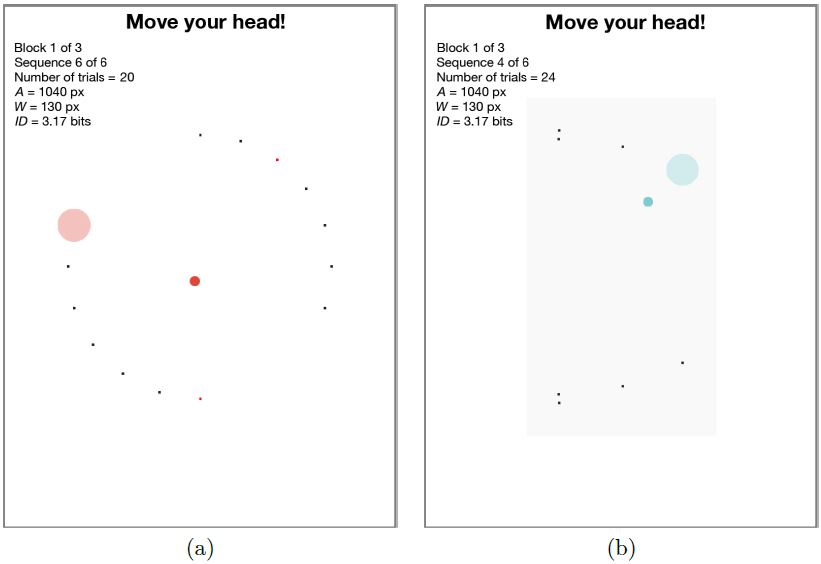
Fig. 14. Screenshots of the interface used in the experiment: (a) example target condition (A = 1040 px, W = 130 px) with the standard multi-directional task and two targets missed highlighted in red (b) example target condition (A = 1040 px, W = 130 px) with the multi-directional corner task and a gray rectangle simulating the display of an iPhone 6.
6.3.4. Design
The experiment was fully within-subjects with the following independent variables and levels:
- Task:
multi-directional (MD), multi-directional corner (MDC) - Block:
1, 2, 3 - Amplitude:
260, 520, 1040 px - Width:
130, 260 px 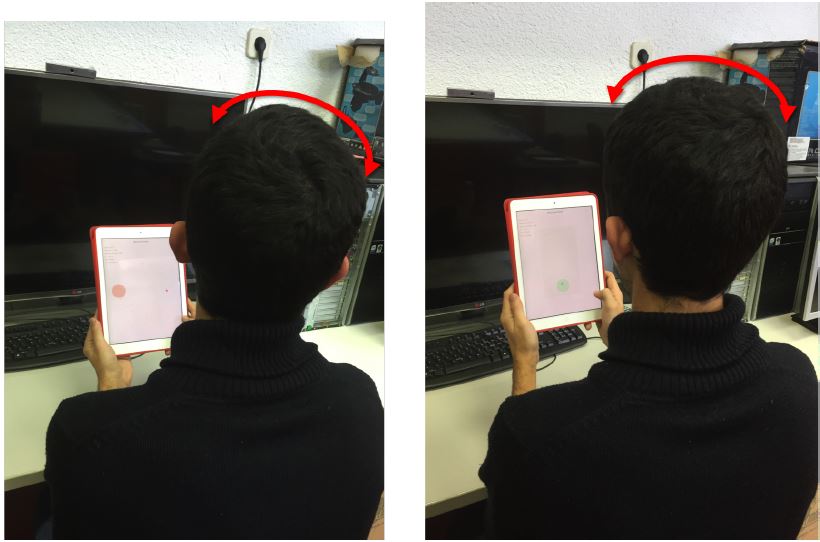
Fig. 15. Participant performing the experiment: (a) standard multi-directional task and (b) multi-directional corner task.The primary independent variable was task. Block, amplitude, and width were included to gather a sufficient quantity of data over a reasonable range of task difficulties. For the MDC task, the largest dimension of the display places a limit on the amplitude independent variable. Using an iPad Air as an apparatus, the display dimension was 1334 × 750 px. With a span of 260 px for the width independent variable, our maximum amplitude was 1334 − 260 = 1074 px and our minimum amplitude was 260 px. We settled on 260, 520, and 1040 px as the levels of the amplitude independent variable in order to differentiate by powers of two. With this, the tasks covered an index of difficulty from 1.00 to 3.17 bits.
The same amplitudes and widths were used for the MD task. Consequently, the diameter of the circle of targets was wider for the MD task. This is seen in Fig. 14 where a larger space is used for the MD task (see Fig. 14a) compared to the MDC task (see Fig. 14b).
The number of trials in a sequence was 24 for the MDC task and 20 for the MD task. The two task conditions were assigned using a Latin square with 7 participants per order. The amplitude and width conditions were randomized within blocks.
The dependent variables were throughput, movement time, and error rate. The total number of trials was 11,088; that is 14 participants × 3 blocks × 3 amplitudes × 2 widths × 20 trials = 5,040 for the MD task condition, and 14 participants × 3 blocks × 3 amplitudes × 2 widths × 24 trials = 6,048 for the MDC task condition.
6.4. Results and Discussion
In this section, results are given for throughput, movement time, and error rate. Fitts' law models are also presented. We begin with an examination of learning effects.
6.4.1. Learning Effects
As head-tracking is an unfamiliar interaction method on mobile devices and none of the participants had previous experience, a learning effect was expected.
Still, and considering the results of experiment 1 for the head interaction mode, Helmert contrasts showed no learning effect, as the block effect on throughput and movement time was not significant (see Fig. 16). Therefore, subsequent analyses are based on the pooled data from all three blocks of testing.
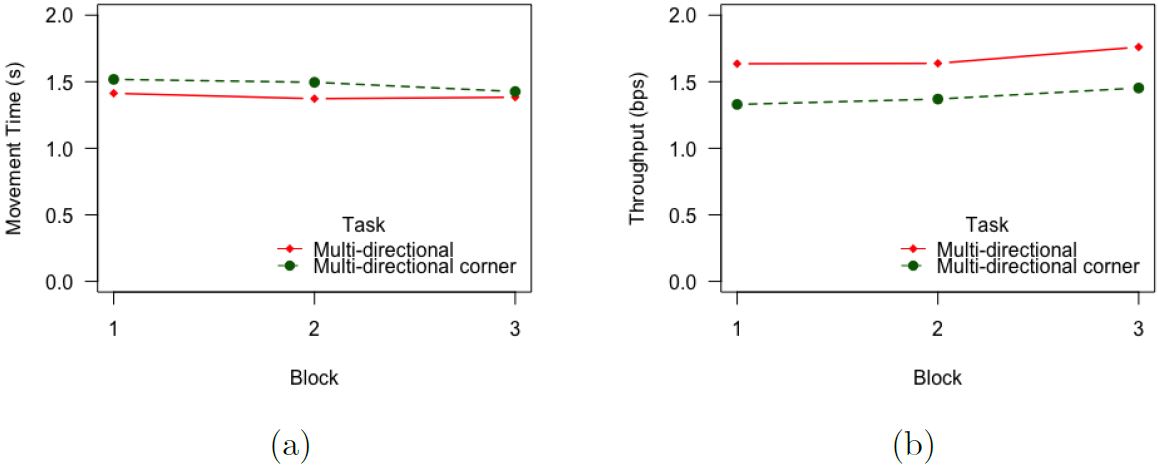
Fig. 16. Results by task and block: (a) Movement time (s) (b) throughput (bps).6.4.2. Throughput and Fitts' Law Models
The grand mean for throughput was 1.54 bps. This value is similar to the value of 1.42 bps obtained in the first experiment for the head interaction mode.
The mean throughput for the MD task was 1.68 bps, which was a 13.7% higher than the mean throughput for the MDC task (1.45 bps). The difference was statistically significant (F1,13 = 28.24, p < .001). The lower throughput for the MDC task is perhaps due to the movement
peculiarities in transitioning between the four subspaces. Furthermore, we note that the goal with the MDC task is not necessarily to achieve a higher throughput but rather to extend the range of IDs and to include target selections at the corners for small displays (which is demonstrated in the extended trials; see below).
To test whether head-tracking interfaces follow Fitts' law, we separately examined the six combinations of target width and movement amplitude, computing the effective index of difficulty (IDe) and the movement time (MT) for each combination (see Table 3). IDe was computed in the same manner as in the first experiment (see section 5.2.4).
Fig. 17 shows scatter plots and regression lines for the six MT-IDe points for each task.
Table 3
Data points for the Fitts' law models.A
(px)W
(px)ID
(bits)Multi-directional (MD) Multi-directional corner (MDC) We
(px)IDe
(bits)MT
(ms)We
(px)IDe
(bits)MT
(ms)260 130 1.58 132.2 1.57 1165 160.2 1.39 1351 260 260 1.00 148.6 1.46 910 210.4 1.16 1003 520 130 2.32 154.6 2.13 1505 187.4 1.92 1654 520 260 1.58 159.4 2.09 1135 218.4 1.76 1212 1040 130 3.17 165.0 2.87 2091 210.8 2.57 2147 1040 260 2.32 219.6 2.52 1533 232.8 2.45 1527 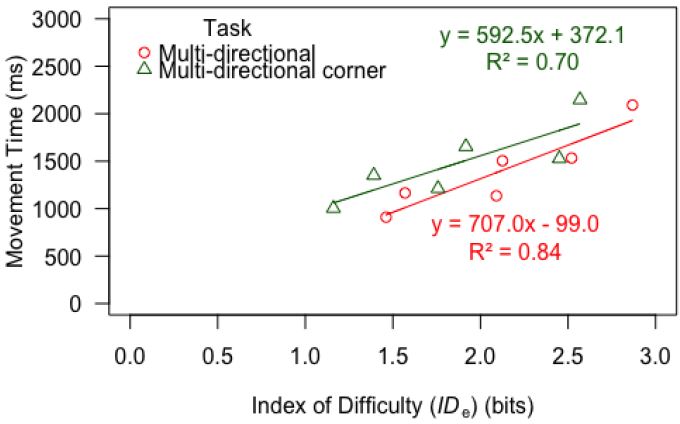
Fig. 17. Fitts' law regression results for the two tasks.As expected, the R-squared value for the MD task model is similar to the R-squared values for the models in experiment 1 (R-squared above 0.8). The R-squared value for the MDC task is lower (R-squared = 0.7) than the previous R-squared values. Despite that, the model explains 70% of the variability in the data. Therefore, we can conclude that both tasks conform to Fitts' law.
6.4.3. Movement Time and Error Rate
The grand mean for movement time was 1.41 s per trial. By task, the means were 1.39 s (MD) and 1.43 s (MDC). The difference was not statistically significant (F1,13 = 3.67, p > .05). The grand mean for error rate was 5.94%. By task, the means were 5.91% (MD) and 5.95% (MDC). The difference was not statistically significant (F1,13 = 1.20, p > .05).
Although the differences in movement time and error rate by task were not statistically significant, we observed that participants needed more time to complete the multi-directional corner and they made slightly more errors (albeit the differences were small).
It is interesting that the effect of task on throughput was significant yet the effect of task on movement time or error rate was not significant. An explanation is that the individual measurements of movement time and error rate include variability due to the speed-accuracy tradeoff; whereas, there is a canceling effect of speed variability when combined with an opposing influence of accuracy in the calculation of throughput (MacKenzie and Isokoski, 2008). Thus, within the levels of an independent variable, the measures for throughput are more stable (i.e., less variable) and consequently more likely to reveal statistical significance between levels of an independent variable.
6.5. Extended Trials on a Small Display
For the testing just described, we used an Apple iPad Air to ensure the comparison was under the same conditions for the MDC and MD tasks (see Section 6.3.2). However, as noted, the MDC task was designed for small devices. Therefore, we extended our second user study to evaluate the head-tracking interface using the MDC task with an Apple iPhone 6 – a mobile device with a small display. The extended trials aimed to validate the results obtained in the second user study for small devices.
6.5.1. Method
We attempted to use the same participants as in the first stage of the second user study, but three were not available for the extended trials. So, we tested the remaining 11 participants (average age = 37.82, SD = 17.37).
The testing was conducted on an Apple iPhone 6 with a resolution of 1334 × 750 px and a pixel density of 326 ppi (Note: 1 mm ≈ 13 px.) (see Fig. 18). All communication with the device was disabled during testing.
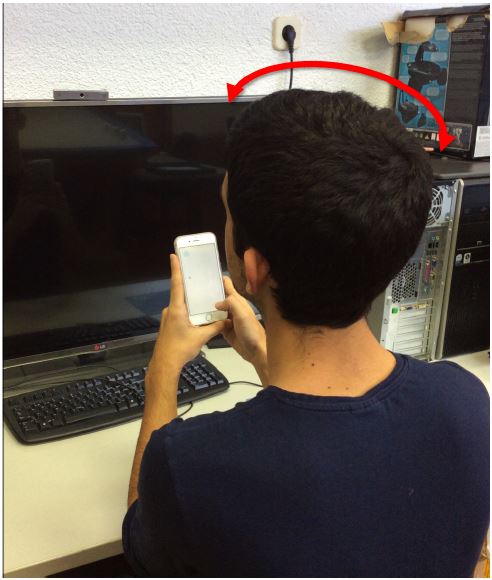
Fig. 18. Participant performing the extended trials with the small device, an Apple iPhone 6.We adapted the MDC task evaluation software described above to run on the iPhone 6 (see Fig. 19). As well, we used the MDC data for the eleven participants using the iPad Air as a point of comparision with the data for the same participants using the iPhone 6. The design was fully within-subjects with the same independent variables and levels as in the second experiment except that the primary independent variable for the extended trials was device:
- Device: iPad Air, iPhone 6
- Block: 1, 2, 3
- Amplitude: 260, 520, 1040 px
- Width: 130, 260 px
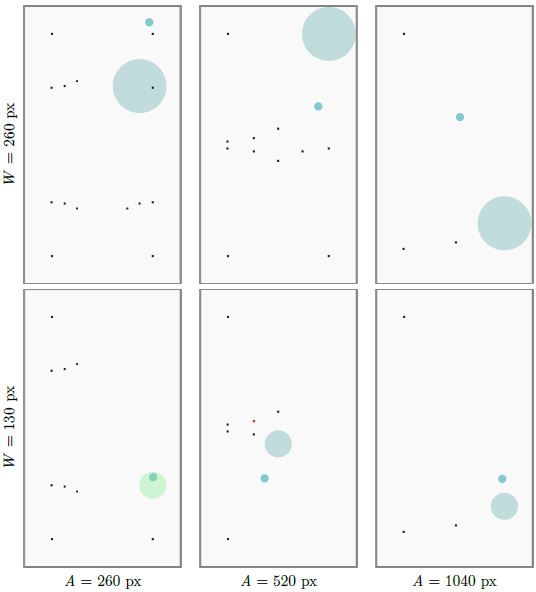
Fig. 19. Examples of target conditions on an iPhone 6 display. The rows show different widths (W = 260 px, W = 130 px), and the columns show different amplitudes (A = 260 px, A = 520 px, A = 1040 px). Note in the bottom-center example (A = 520 px, W = 130 px), a target is missed (red square). In the bottom-left example (A = 260 px, W = 130 px), the cursor is inside the target (green).For each condition, participants performed a sequence of 24 trials. The participants had already performed the iPad Air trials, and then used the iPhone 6 in the extended trials. Since the design does not include counterbalancing, there might be an inherent advantage for the iPhone 6 condition, which came second. Nevertheless, the difference in time between sessions (two months) was likely long enough to offset the advantage. Note that our primary purpose was simply to extend the results of the second experiment to a device with a small display.
The total number of extended trials was 11 participants × 3 blocks × 3 amplitudes × 2 widths × 24 trials = 4,752. The data from the extended trials were compared with the equivalent 4,752 trials on the iPad Air with the same 11 participants performing the MDC task.
6.5.2. Results and Discussion
The means for throughput, movement time, and error rate for the MDC trials on the iPhone 6 were 1.42 bps, 1.50 s, and 5.26%, respectively. These values are all within 3% of the corresponding values for the MDC trials on the iPad Air. For all three dependent variables, the difference between the means for the iPhone 6 and iPad Air was not statistically significant (p > .05). Thus, the extended trials confirm the utility of the MDC trials on a device with a small display.
As a matter of demonstration and using an example condition (A = 1040 px, W = 260 px), Fig. 20 shows the targets and selection locations for the three task conditions in experiment 2. Fig. 20a shows the MD trials on the iPad Air, where targets are in a circular arrangement in the center of the display (i.e., corner targets are not represented). Fig. 20b shows the MDC trials on the iPad Air, where targets are confined to the grey area simulating the display of an iPhone 6. Finally, Fig. 20c shows the MDC trials on the iPhone 6, where targets and selections appear in the corners of the display. Note that for the two MDC examples, only the trials in subspace 3 are shown. Fig. 20c clearly highlights one of the advantages of the MDC task: target selections are included at the corners of the display.
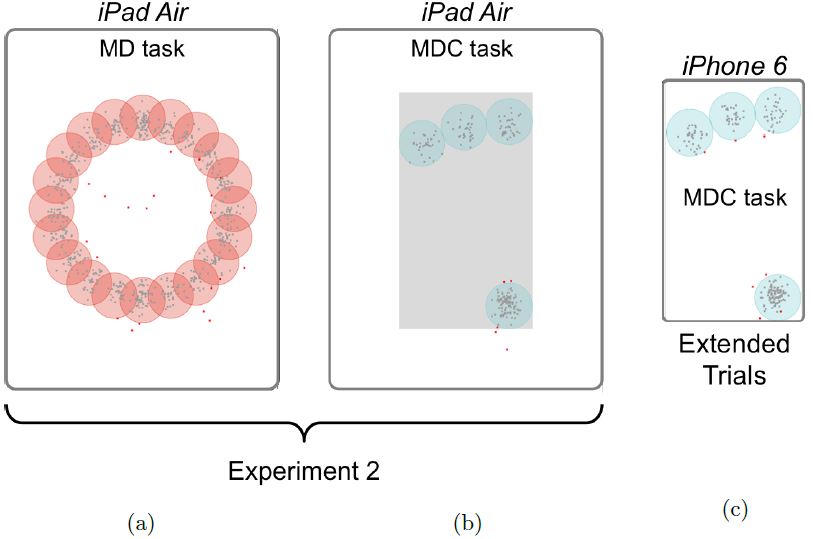
Fig. 20. Example target conditions and selections for (a) MD task on iPad Air, (b) MDC task on iPad Air, and (c) MDC extended trials on iPhone 6. Gray squares are correct selections, red squares are errors. Note in part (c) that selections are tested at the corners of the display.6.6. Conclusion (Experiment 2)
Since the tests described in the ISO standard were initially conceived for desktop environments, the multi-directional (MD) task presents limitations for evaluations on small displays. We designed an alternative task – the multi-directional corner (MDC) task – for testing and building a Fitts' law model in the context of small displays. The MDC task extends the range of IDs tested and also includes target selection at the corners of the display.
We conducted a user study to evaluate mobile head-tracking through Fitts' law using the MD task and the new MDC task. Results indicate that both tasks conform to Fitts' law, although R-squared for the MDC task was lower. The mean throughput was similar to the throughput obtained in the first experiment for the head interaction mode. The mean throughput for the MD task was 1.68 bps, which was a 13.7% higher than the mean throughput of 1.45 bps for the MDC task. A similar throughput (1.42 bps) was found in extended trials using a device with a small display, an iPhone 6. Irrespective of the lower throughput, we conclude that the MDC task is more representative of the tasks for which small devices are used, since all locations of the display surface are tested, including corners. Consequently, the MDC task is recommended for calculating throughput and building Fitts' law models when the evaluation is done on a device with a small display.
7. Summary
The integration of front cameras has brought forth head-tracking interfaces on mobile devices. However, research mostly focuses on the development of new tracking methods and their integration into prototypes without analyzing human performance. In this work, we presented two user studies focusing on user performance.
The first user study evaluated user performance with a mobile head-tracking interface through Fitts' law following the multi-directional tapping test described in ISO9241-411. Head-tracking as an input primitive was shown to conform to Fitts' law. Throughput was low compared to a desktop mouse but was within the range of desktop head-tracking interfaces and close to mobile tilt-based interaction. Since the tests described in the ISO standard were initially conceived for desktop environments, the multi-directional tapping test presented limitations for evaluations on small displays. Therefore, we designed an alternative task – the multi-directional corner task – focused on the particularities of small displays. The new task extends the range of IDs and tests target selection at the corners of the display.
The second user study used the head-tracking interface to determine user's performance via Fitts' law using a multi-directional (MD) task and a multi-directional corner (MDC) task. The MDC task had a wider range of task difficulties and required higher accuracy for targets placed on the corners. Nevertheless, this task better represents the tasks for which small devices are used and, consequently, the MDC task is recommended for building Fitts' law testing on devices with small displays.
8. Acknowledgments
This work has been partially supported by the project TIN2016-81143-R (AEI/FEDER, UE), grant BES-2013-064652 (FPI) and mobility grant EEBB-I-15-10293. Finally, we also acknowledge the support of the "Visiting lecturers on short visits" programme by the OSR (University of Balearic Islands).
References
Cuaresma, J., & MacKenzie, I. S. (2014). A comparison between tilt-input and facial tracking as input methods for mobile games. In Proceedings of the 6th IEEE Consumer Electronics Society Games, Entertainment, Media Conference - IEEE-GEM 2014 (pp. 70-76). New York: IEEE.
De Silva, G. C., Lyons, M. J., Kawato, S., & Tetsutani, N. (2003). Human factors evaluation of a vision-based facial gesture interface. In Proceedings of the Computer Vision and Pattern Recognition Workshop - CVPRW 2003 (pp. 52-52). New York: IEEE.
Fitts, P. M. (1954). The information capacity of the human motor system in controlling the amplitude of movement. Journal of Experimental Psychology, 47, 381.
Hannuksela, J., Sangi, P., & Heikkila, J. (2005). A vision-based approach for controlling user interfaces of mobile devices. In Proceedings of the Computer Vision and Pattern Recognition Workshop - CVPRW 2005 (pp. 71-71). New York: IEEE.
Hannuksela, J., Sangi, P., Turtinen, M., & Heikkilä, J. (2008). Face tracking for spatially aware mobile user interfaces. In Proceedings of the International Conference on Image and Signal Processing - ICISP 2008 (pp. 405-412). Berlin: Springer.
Henrysson, A., Billinghurst, M., & Ollila, M. (2005). Virtual object manipulation using a mobile phone. In Proceedings of the 2005 International Conference on Augmented Tele-existence - ICAT 2005 (pp. 164-171). New York: ACM.
Henze, N., & Boll, S. (2011). It does not Fitts my data! Analysing large amounts of mobile touch data. In Proceedings of the IFIP Conference on Human-Computer Interaction - INTERACT 2011 (pp. 564-567). Berlin: Springer.
Henze, N., Rukzio, E., & Boll, S. (2011). 100,000,000 taps: Analysis and improvement of touch performance in the large. In Proceedings of the 13th International Conference on Human Computer Interaction with Mobile Devices and Services - MobileHCI 2011 (pp. 133-142). New York: ACM.
Hirsch, M., Cheng, J., Reiss, A., Sundholm, M., Lukowicz, P., & Amft, O. (2014). Hands-free gesture control with a capacitive textile neckband. In Proceedings of the 2014 ACM International Symposium on Wearable Computers - ISWC 2014 (pp. 55-58). New York: ACM.
ISO (2002). 9241-9. 2000. Ergonomics requirements for office work with visual display terminals (VDTs) - part 9: Requirements for non-keyboard input devices. International Organization for Standardization.
ISO (2012). 9241-411. 2012. Ergonomics of human-system interaction - part 411: Evaluation methods for the design of physical input devices. International Organization for Standardization.
Li, R., Taskiran, C., & Danielsen, M. (2007). Head pose tracking and gesture detection using block motion vectors on mobile devices. In Proceedings of the 4th International Conference on Mobile Technology, Applications, and Systems and the 1st International Symposium on Computer Human Interaction in Mobile Technology - Mobility 2007 (pp. 572-575). New York: ACM.
López, M. B., Hannuksela, J., Silvén, O., & Fan, L. (2012). Head-tracking virtual 3-D display for mobile devices. In Proceedings of the Computer Vision and Pattern Recognition Workshop - CVPRW 2012 (pp. 27-34). New York: IEEE. MacKenzie, I. S. (1992). Fitts' law as a research and design tool in human-computer interaction. Human-Computer Interaction , 7, 91-139.
MacKenzie, I. S. (2015). Fitts throughput and the remarkable case of touch-based target selection. In Proceedings of the 17th International Conference on Human-Computer Interaction - HCII 2015 (pp. 238-249). Switzerland: Springer.
MacKenzie, I. S., & Isokoski, P. (2008). Fitts' throughput and the speed-accuracy tradeoff. In Proceedings of the ACM Conference on Human Factors in Computing Systems - CHI 2008 (pp. 1633-1636). New York: ACM.
MacKenzie, I. S., & Teather, R. J. (2012). FittsTilt: The application of Fitts' law to tilt-based interaction. In Proceedings of the Seventh Nordic Conference on Human-Computer Interaction - NordiCHI 2012 (pp. 568-577). New York: ACM.
Magee, J., Felzer, T., & MacKenzie, I. S. (2015). Camera Mouse + ClickerAID: Dwell vs. single-muscle click actuation in mouse-replacement interfaces. In Proceedings of the 17th International Conference on Human-Computer Interaction - HCII 2015 (pp. 74-84). Switzerland: Springer.
Manresa-Yee, C., Varona, J., Perales, F. J., & Salinas, I. (2014). Design recommendations for camera-based head-controlled interfaces that replace the mouse for motion-impaired users. Universal Access in the Information Society, 13, 471-482.
Park, Y. S., Han, S. H., Park, J., & Cho, Y. (2008). Touch key design for target selection on a mobile phone. In Proceedings of the 10th International Conference on Human Computer Interaction with Mobile Devices and Services - MobileHCI 2008 (pp. 423-426). New York: ACM.
Perry, K. B., & Hourcade, J. P. (2008). Evaluating one handed thumb tapping on mobile touchscreen devices. In Proceedings of the Graphics Interface 2008 - GI 2008 (pp. 57-64). Toronto: Canadian Information Processing Society.
Plamondon, R., & Alimi, A. M. (1997). Speed/accuracy trade-offs in target-directed movements. Behavioral and Brain Sciences , 20, 279-303.
Roig-Maimó, M. F., Manresa-Yee, C., & Varona, J. (2016a). A robust camera-based interface for mobile entertainment. Sensors , 16, 254.
Roig-Maim&oactue;, M. F., Manresa-Yee, C., Varona, J., & MacKenzie, I. S. (2016b). Evaluation of a mobile head-tracker interface for accessibility. In Proceedings of the 15th International Conference on Computers Helping People With Special Needs - ICCHP 2016 (pp. 449-456). Berlin: Springer.
Roig-Maimó, M. F., Varona Gómez, J., & Manresa-Yee, C. (2015). Face Me! Head-tracker interface evaluation on mobile devices. In Proceedings of the 33rd Annual ACM Conference Extended Abstracts on Human Factors in Computing Systems - CHI 2015 (pp. 1573-1578). New York: ACM.
Shan, C. (2010). Gesture control for consumer electronics. In L. Shao, C. Shan, J. Luo, & M. Etoh (Eds.), Multimedia Interaction and Intelligent User Interfaces - chapter 5. (pp. 107-128). London: Springer.
Soukoreff, R. W., & MacKenzie, I. S. (2004). Towards a standard for pointing device evaluation: Perspectives on 27 years of Fitts' law research in HCI. International Journal of Human-Computer Studies, 61, 751-789.
Varona, J., Manresa-Yee, C., & Perales, F. J. (2008). Hands-free vision-based interface for computer accessibility. Journal of Network and Computer Applications, 31, 357-374.
Williamson, J. R., Brewster, S., & Vennelakanti, R. (2013). Mo!Games: Evaluating mobile gestures in the wild. In Proceedings of the 15th ACM on International Conference on Multimodal Interaction - ICMI 2013 (pp. 173-180). New York: ACM Press.
-----
Footnotes:
1 ISO 9241-411 (ISO, 2012) is an updated version of ISO 9241-9 (ISO, 2002). With respect to performance evaluation, the two versions of the standard are the same.
2 Apple's point (pt.) is an abstract unit that covers two pixels on retina devices. On the iPad Air, one point equals 1/132 inch (Note: 1 mm ≈ 5 pt.).
3 This is equivalent to 667 × 375 Apple points.
- Block: