MacKenzie, I. S. (2003). Motor behaviour models for human-computer interaction. In J. M. Carroll (Ed.) HCI models, theories, and frameworks: Toward a multidisciplinary science, pp. 27-54. San Francisco: Morgan Kaufmann.
Motor Behaviour Models for Human-Computer Interaction
I. Scott MacKenzie
Department of Computer ScienceYork University
Toronto, Canada
1. Motivation
The movement of body and limbs is inescapable in human-computer interaction (HCI). Whether browsing the web or intensively entering and editing text in a document, our arms, wrists, and fingers are at work on the keyboard, mouse, and desktop. Our head, neck, and eyes move about attending to feedback marking our progress. This chapter is motivated by the need to match the movement limits, capabilities, and potential of humans with input devices and interaction techniques on computing systems. Our focus is on models of human movement relevant to human-computer interaction. Some of the models discussed emerged from basic research in experimental psychology, whereas others emerged from, and were motivated by, the specific need in HCI to model the interaction between users and physical devices, such as mice and keyboards.As much as we focus on specific models of human movement and user interaction with devices, this chapter is also about models in general. We will say a lot about the nature of models, what they are, and why they are important tools for the research and development of human-computer interfaces.
2. Overview: Models and Modeling
By its very nature, a model is a simplification of reality. However a model is useful only if it helps in designing, evaluating, or otherwise providing a basis for understanding the behaviour of a complex artifact such as a computer system. It is convenient to think of models as lying in a continuum, with analogy and metaphor at one end and mathematical equations at the other. Most models lie somewhere in-between. Toward the metaphoric end are descriptive models; toward the mathematical end are predictive models. These two categories are our particular focus in this chapter, and we shall visit a few examples of each. Two models will be presented in detail and in case studies: Fitts' model of the information processing capability of the human motor system and Guiard's model of bimanual control.Fitts' model is a mathematical expression emerging from the rigors of probability theory. It is a predictive model at the mathematical end of the continuum, to be sure, yet when applied as a model of human movement it has characteristics of a metaphor. Guiard's model emerged from a detailed analysis of how human's use their hands in everyday tasks, such as writing, drawing, playing a sport, or manipulating objects. It is a descriptive model, lacking in mathematical rigor but rich in expressive power.
Neither Guiard's model nor Fitts' model were motivated by issues in human-computer interaction. Yet, today, both are commonly used in the research and development of interactive systems. The reason is simple: They are useful! They are useful because they provide a simplification of the complex interactions between humans and computers. This simplification allows designers to understand and anticipate the impact of a design in a meaningful context. A founding principle of the field of human-computer interaction is that it is multidisciplinary. The field combines work in other disciplines, most notably psychology, cognitive science, and sociology. Fitts' and Guiard's models emerged from basic research in an area within experimental psychology known as psychomotor behaviour or, simply, motor control. Both are widely applicable to many disciplines. The field of human-computer interaction is a beneficiary of this basic research.
Before discussing Fitts' and Guiard's work in detail, we begin with a general discussion on predictive and descriptive models, and present a few other relevant models within these categories.
2.1. Predictive Models
Predictive models, sometimes called engineering models or performance models (Card, Moran, & Newell, 1983, p. 411; Marchionini & Sibert, 1992), are widely used in many disciplines. In human-computer interaction, predictive models allow metrics of human performance to be determined analytically without undertaking time-consuming and resource-intensive experiments. Predictions so generated are a priori: they allow a design scenario to be explored hypothetically without implementing a real system and gathering the same performance metrics through direct observation on real users. The benefits are obvious.
2.1.1. Hick-Hyman Law
There are many examples of predictive models, some specific to human-computer interaction, others guided by basic theory in perception or motor control. We have already noted that both Fitts' and Guiard's models emerged from basic research in motor control, and we shall have more to say about these shortly. Another example is the Hick-Hyman law for choice reaction time (Hick, 1952; Hyman, 1953). This law takes the form of a prediction equation. Given a set of n stimuli, associated one-for-one with n responses, the time to react (RT) to the onset of a stimulus and make the appropriate response is given by
| RT = a + b log2(n) | (eq 1) |
where a and b are empirically determined constants. The Hick-Hyman law has surfaced in a few contexts in interactive systems. Card et al. (1983, p. 74) provide an example of a telephone operator selecting among ten buttons when the light behind a button comes on. Landauer and Nachbar (1985) applied the Hick-Hyman law in measuring and predicting the time to select items in hierarchical menus. Besides confirming the suitability of the law to this category of task, they also found empirical support for their conclusion that breadth should be favoured over depth in hierarchical menus. More recently, we have found the Hick-Hyman law useful in predicting text entry rates on soft keyboards with non-Qwerty layouts (MacKenzie, Zhang, & Soukoreff, 1999; Soukoreff & MacKenzie, 1995). For non-Qwerty layouts, users must visually scan the keyboard to find the desired letter. The act of finding the desired letter among a set of randomly positioned letters is appropriately modeled by the relationship in Equation 1.
2.1.2. Keystroke-level model
There are numerous predictive models developed specifically for exploring design scenarios for human-computer interfaces. One of the earliest and certainly one of the most comprehensive is the keystroke-level model (KLM) by Card et al. (1980; 1983, chap. 8). The KLM was developed as a practical design tool, the goal being to predict the time to accomplish a task on a computer system. The model predicts expert error-free task completion times, given the following input parameters:
- a task or series of sub-tasks
- method used
- command language of the system
- motor skill parameters of the user
- response time parameters of the system
| TEXECUTE = tK + tP + tH + tD + tM + tR | (eq 2) |
Some of the operations above are omitted or repeated, depending on the task. For example, if a task requires n keystrokes, tK becomes n × tK. Each tK operation is assigned a value according to the skill of the user, with values ranging from tK = 0.08 s for highly skilled typists to tK = 1.20 s for a typist working with an unfamiliar keyboard. The pointing operator, tP , is based on Fitts' law. More on this later.
Since its introduction, the KLM has surfaced in many contexts in HCI, such as map digitizing (Haunold & Kuhn, 1994), predicting usage patterns in editors (Toleman & Welsh, 1996), generating power key assignments to reduce typing keystrokes (Nicols & Ritter, 1995), predicting user performance with hierarchical menus (Lane, Napier, Batsell, & Naman, 1993), or predicting text entry performance for physically challenged users in a word prediction system (Koester & Levine, 1994).
2.2. Descriptive Models
Descriptive models are of a vastly different genre than predictive models. Although they generally do not yield an empirical or quantitative measure of user performance, their utility is by no means second to predictive models. Simply put, descriptive models provide a framework or context for thinking about or describing a problem or situation. Often the framework is little more than a verbal or graphic articulation of categories or identifiable features in an interface. Nevertheless, the simple possession of such arms the designer with a tool for studying and thinking about the user interaction experience. A simple example is developed in the next section.
2.2.1. Key-action model
Computer keyboards today contain a vast array of buttons, or keys. Most systems use a variation of the 101-style keyboard, with a row of function keys across the top and a numeric keypad on the right. Have you ever thought about the operation of keys on a keyboard? Here's a descriptive model for this purpose. Let's call it the key-action model (KAM). In our KAM, keyboard keys are categorized as either symbol keys, executive keys, or modifier keys. Symbol keys deliver graphic symbols – typically, letters, numbers, or punctuation symbols – to an application such as a text editor. Executive keys invoke actions in the application or at the system-level or meta-level. Examples include ENTER, F1, or ESC. Modifier keys do not generate symbols or invoke actions, but, rather, set up a condition necessary to modify the effect of a subsequently pressed key. Examples include SHIFT or ALT. And that's about it for the KAM. It's a simple model, to be sure. It has a name, and it identifies three categories of keys, providing for each a name, a definition, and examples. What do you think of this model? Is it correct? Is it flawed? Do all keyboard keys fit the model? Can you think of additional categories or sub-categories to improve the model or to make it more accurate or more comprehensive? Do some keys have features of more than one category? Can you think of a graphical illustration of the model to improve its expressive power? Is the model useful?The substance of the questions above is evidence of the power of descriptive models such as the KAM. The model piques our interest and suggests aspects of keyboard operation that merit consideration, particularly if a new design is contemplated. The most important question is the last. There is no greater measure of the merit of a model than its ability to tease out critical arguments on the potential, the capabilities, and the limitations in a particular interaction domain. We will revisit the KAM later in a case study on the affordances of the desktop interface for two-handed interaction.
2.2.2. Three-state model of graphical input
Another example is Buxton's 3-state model for graphical input devices (Buxton, 1990). The model is a simple expression of the operation of computer pointing devices in terms of state transitions. It is described simply as a vocabulary to recognize and explore the relationship between pointing devices and the interaction techniques they afford (Buxton, 1990, p. 449). In this sense, it is a paradigm of descriptive modeling. The three states are identified in Figure 1, annotated for mouse interaction.
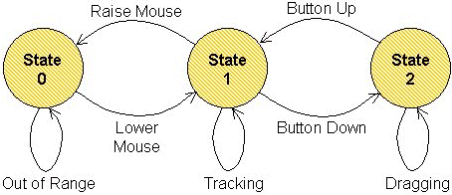
Figure 1. Buxton's 3-state model of graphical input (after Buxton, 1990).
Left-to-right in Figure 1, the states are Out of range (State 0) for clutching or repositioning a mouse on a mouse pad; Tracking (State 1) for moving a tracking symbol such as a cursor about a display, and Dragging (State 2) for moving an icon on the desktop or for grouping a set of objects or a range of text. The model seems simple and obvious, and we might question its ability to add significant insight to the existing body of pointing device research. Yet, the model can be extended to capture additional aspects of pointing device interaction such as multi-button interaction, stylus input, and direct vs. indirect input. See Buxton (1990) for further details.
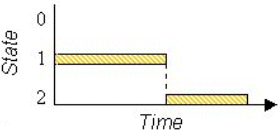
As further evidence of the utility of Buxton's work, we recently used the 3-state model to characterize an interaction technique that didn't even exist at the time the model was introduced. The insight gained lead to a redesign of an interaction technique. This work is briefly recounted here. Never shy of innovation, Apple Computer, Inc. (Cupertino, CA) took a bold step in 1994 by commercializing a new pointing device in its PowerBook 500 notebook computer: the TrackPoint touchpad (MacNeill & Blickenstorfer, 1996). And the rest is history. Today, touchpads are the dominant pointing device for notebook computers. (IBM and Toshiba are notable holdouts, preferring isometric joysticks instead.) One of the interaction techniques supported by touchpads is lift-and-tap, wherein primitives like clicking, double-clicking, or dragging, are implemented without a button. These new interaction primitives are easily represented by Buxton's 3-state model. Figure 2 provides a simple comparison of the state transitions for dragging tasks (a) using a mouse, and (b) using lift-and-tap on a touchpad.
 (b)
(b) 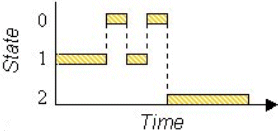
Figure 2. Dragging tasks: (a) mouse (b) lift-and-tap touchpad. Dragging
begins upon entering State 2 (after MacKenzie & Oniszczak, 1997)
Diagrams like this are evidence of the descriptive power of models such as Buxton's. Two observations follow: (1) lift-and-tap necessitates extra state transitions in comparison to a mouse, and (2) the use of state 1-0-1 transitions for lift-and-tap is confounded with clutching (not shown) which uses the same state transitions.
Among users' frustrations in using touchpads is that these primitives are difficult, awkward, or error prone. For example, if a finger touch following a lift is spatially displaced from the point of lifting, the system often incorrectly enters the Tracking state (State 1) instead of the Dragging state (State 2).
Armed with a deeper understanding of touchpad interaction, we undertook a redesign of the buttonless implementation of state transitions on touchpads. The additional pressure sensing capability of touchpads was used to implement State 1-2 transitions by "pressing harder". A built-in relay provided both tactile and aural feedback to inform the user of state transitions, much like the feedback in pressing a mouse button. Thus, clicking, double clicking, and dragging were implemented on the touchpad, without a button, yet using the same state transitions as on a mouse. The complete details are presented in the 1997 and 1998 proceedings of the ACM's SIGCHI (MacKenzie & Oniszczak, 1997; MacKenzie & Oniszczak, 1998).
2.2.3. Model for mapping degrees-of-freedom to dimensions
One final example of a descriptive model will be given. A topic of great interest in HCI is interactive graphics. The vocabulary of such systems includes terms like dimensions and degrees of freedom (DOF). These terms are often used interchangeably; however, the terms are different and the distinction between them is often poorly articulated. Before proceeding, Figure 3 is necessary to establish some terminology.
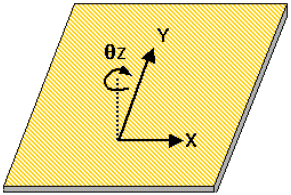
Figure 3. A mousepad is a two-dimensional surface
with three degrees of freedom: X, Y, and θZ
The figure shows a mouse pad and identifies the most common labels for the axes of motion. Left-to-right motion is translational, along the X axis; to-and-fro motion is translational along the Y axis. If the mouse is rotated on the pad, motion is rotational about the Z axis, labeled θZ in the figure. Although most users are quick to declare the mouse a two-dimensional (2-D) device (e.g., Zhai & MacKenzie, 1998), this is not quite true. Here's where we see a slight point of confusion between dimensions (D) and degrees of freedom (DOF). A true 2-D device has three degrees of freedom (3-DOF), as illustrated in Figure 3. If a mouse were a true 2-D device, then translational motion along the X and Y axes would be sensed, as well as rotational motion about the Z axis. Of course, rotational motion of the mouse is not sensed. This deficiency is illustrated in Figure 4. The left two columns show our descriptive model for mapping degrees of freedom to dimensions, using the terminology in Figure 3. The third column shows the mappings implemented for a conventional mouse.
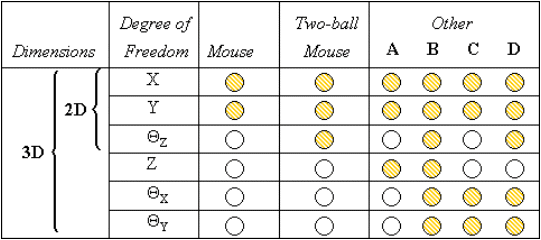
Figure 4. Mapping degrees of freedom to dimensions (see text for discussion)
The model in Figure 4 is a simple tool for illustrating the mappings of degrees of freedom to dimensions for real or hypothetical input devices. The apparent shortcoming of the standard mouse as a 2-D input device motivated us to design a new mouse to implement the missing DOF. As shown in the fourth column in Figure 4, our two-ball mouse also senses rotational motion about the Z axis. An object acquired in a graphics application with this mouse can be positioned in a single gesture both translationally along the X and Y axis and rotationally about the Z-axis, thus negating the need for a "rotate tool". See MacKenzie, Soukoreff, and Pal (1997) for details.
Figure 4 also shows the mappings of degrees of freedom to dimensions for other pointing devices. Column A identifies devices that sense only translation along the three axes. An example is the Owl by Pegasus Technologies, Ltd. (Tel Aviv, Israel). Column B identifies true 3-D input devices, such as trackers used in virtual reality systems. Such devices sense X-, Y-, and Z-axis translation and rotation. An example is the Isotrak II by Polhemus, Inc. (Colchester, VT). Column C identifies an interesting research prototype known as the Rockin'Mouse. It looks and feels like a mouse, but it has a curved bottom and senses both translation and rotation about the X and Y axes (see Balakrishnan, Baudel, Kurtenbach, & Fitzmaurice, 1997, for details). Column D identifies a hypothetical 5-DOF input device. Since it does not sense Z-axis translation, the device is operated on the mousepad, and therefore, has that special mouse-like appeal.
3. Scientific Foundations and Model Descriptions
The two models chosen for detailed study in this chapter are Fitts' law and Guiard's model of bimanual skill. As shall see, Fitts' law falls within the scope of a predictive model, whereas Guiard's model is an example of a descriptive model.
3.1. Fitts' Law
Fitts' law is one of the most robust and highly adopted models of human movement. The model is, arguably, the most successful of many efforts to model human behavior as an information processing activity. (For detailed reviews, see MacKenzie, 1991; MacKenzie, 1992; Meyer, Smith, Kornblum, Abrams, & Wright, 1990; Welford, 1968). Fitts was interested in applying information theory to measure the difficulty of movement tasks and the human rate of information processing as tasks are realized. He argued that the amplitude of an aimed movement was analogous to an electronic signal and that the spatial accuracy of the move was analogous to electronic noise. Furthermore, he proposed that the human motor system is like a communications channel, wherein movements are viewed as the transmission of signals. His analogy is based on Shannon's Theorem 17, expressing the effective information capacity C (in bits/s) of a communications channel of bandwidth B (in s-1 or Hz) as
| C = B log2(S / N + 1) | (eq 3) |
where S is the signal power and N is the noise power (Shannon & Weaver, 1949, pp. 100-103).
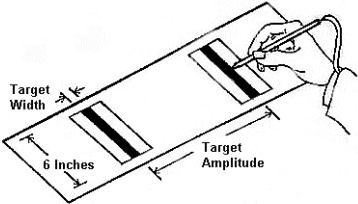
Fitts presented his analogy – now his "law" – in two highly-celebrated papers, one in 1954 (Fitts, 1954), the second in 1964 (Fitts & Peterson, 1964). The 1954 paper described a serial, or reciprocal, target acquisition task wherein subjects alternately tapped on targets of width W separated by amplitude A (see Figure 5a). The 1964 paper described a similar experiment using a discrete task, wherein subjects selected one of two targets in response to a stimulus light (see Figure 5b). It is easy to imagine how the mechanical apparatus Fitts used can be replaced by computer input devices and targets rendered on a CRT display.
 (b)
(b) 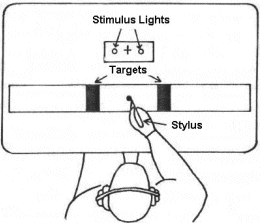
Figure 5. Experimental paradigm for Fitts' law (a) serial task (after
Fitts, 1954) (b) discrete task (after Fitts & Peterson, 1964).
Fitts proposed to quantify a movement task's difficulty – ID, the index of difficulty – using information theory by the metric "bits". Specifically,
| ID = log2(2A / W) . | (eq 4) |
The amplitude (A) and width (W) in Equation 4 are analogous to Shannon's signal (S) and noise (N) in Equation 3. The following expression for ID was introduced to improve the information-theoretic analogy (MacKenzie, 1989):
| ID = log2(A / W + 1) | (eq 5) |
Because A and W are both measures of distance, the term within the parentheses in Equation 5 is without units. The unit bits emerges from the somewhat arbitrary choice of base 2 for the logarithm. From Equation 5, the movement time (MT) to complete a task is predicted using a simple linear equation:
| MT = a + b × ID | (eq 6) |
In building a Fitts' law model, the slope and intercept coefficients in the prediction equation are determined through empirical tests, typically using linear regression. The tests are undertaken in a controlled experiment using a group of subjects and one or more input devices and task conditions.
The design of experiments for Fitts' law studies is straightforward. Tasks are devised to cover a range of difficulties by varying A and W. For each task condition, multiple trials are conducted and the time to execute each is recorded and stored electronically for statistical analysis. Accuracy is also recorded, either through the x-y coordinates of selection or through the error rate – the percentage of trials selected with the cursor outside the target. Example data sets for two devices tested in a serial task are given in Figure 6. For the purpose of this discussion the devices are simply referred to as 'A' and 'B'.1 The figure shows the controlled variables A and W, along with the computed index of difficulty (ID, see eq 5) and, for each condition, the observed error rate (ER) and movement time (MT ). Each dependent measure is based on 240 observations (12 participants × 20 trials per condition).
| A (pixels) | W (pixels) | ID (bits) | Device 'A' | Device 'B' | |||
|---|---|---|---|---|---|---|---|
| ER (%) | MT (ms) | ER (%) | MT (ms) | ||||
| 40 | 10 | 2.32 | 2.08 | 665 | 1.25 | 1587 | |
| 40 | 20 | 1.58 | 3.33 | 501 | 2.08 | 1293 | |
| 40 | 40 | 1.00 | 1.25 | 361 | 0.42 | 1001 | |
| 80 | 10 | 3.17 | 2.92 | 762 | 2.08 | 1874 | |
| 80 | 20 | 2.32 | 1.67 | 604 | 2.08 | 1442 | |
| 80 | 40 | 1.58 | 1.67 | 481 | 0.83 | 1175 | |
| 160 | 10 | 4.09 | 3.75 | 979 | 2.08 | 2353 | |
| 160 | 20 | 3.17 | 5.42 | 823 | 1.67 | 1788 | |
| 160 | 40 | 2.32 | 4.17 | 615 | 0.83 | 1480 | |
| Mean: | 2.40 | 2.92 | 644 | 1.48 | 1555 | ||
Figure 7 shows a common reporting technique for Fitts' law experiments. The nine MT-ID points for each device in Figure 6 are plotted along with the regression lines. The prediction equations for MT as a function of ID are also shown, as are the R2 statistics for the percentage of variance in the observations explained by the model. It is noteworthy of Fitts' law in general that R2 is usually very high, attesting to the strength of the model as a predictor for rapid aimed movements. For Device 'A', for example, the regression equation explains about 98% of the variance in the observed movement times.
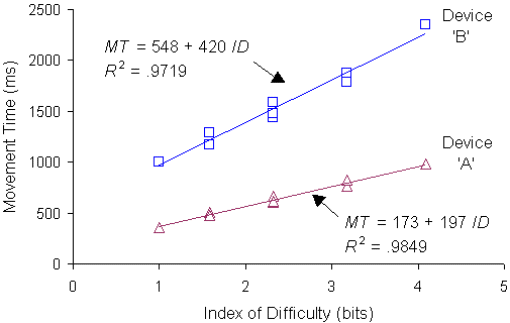
Figure 7. Scatter plots and regression lines for data sets in Figure 6
Since task difficulty is analogous to information, the rate of task execution is interpreted as the human rate of information processing. For example, if a task rated at, say, ID = 4.09 bits is executed in MT = 979 ms, then the human rate of information processing for that task is 4.09 / 0.979 = 4.18 bits/s. In fact, this very example is seen in Figure 6 for Device 'A' for the condition A = 160 and W = 10. Fitts called this measure the index of performance (IP ), although the term throughput (TP ) is more common today (Douglas, Kirkpatrick, & MacKenzie, 1999; ISO, 1999).
More likely, the mean throughput is of interest. Reading from the bottom row in Figure 6, the mean throughput across all the A-W conditions for Device 'A' is TP = 2.40 / 0.644 = 3.73 bits/s. For Device 'B', TP = 2.40 / 1.555 = 1.57 bits/s. Using throughput as a criterion, therefore, we conclude that users' performance with Device 'A' was about 3.73 / 1.57 = 2.4 times better than performance with Device 'B'.
Unfortunately, the computation of throughput is not as straightforward as just described. It is reported in many studies as the reciprocal of the slope of the regression line (e.g., Card, English, & Burr, 1978; MacKenzie, Sellen, & Buxton, 1991). By this reasoning and from Figure 7, we see that throughput for Device 'A' is TP = 1 / 0.197 = 5.08 bits/s. This figure is a non-trivial 36% higher than TP = 3.73 bits/s, computed from the same data except dividing the mean ID by the mean MT. The computation of TP is further complicated by the need to include spatial variability (viz. accuracy) to further improve the analogy to Shannon's theorem (Fitts & Peterson, 1964; Welford, 1968). This is accomplished by replacing the target width (W ) in Equation 5 with the "effective target width" (We ), computed as follows:
| We = 4.133 × SDx | (eq 7) |
where SDx is the standard deviation in the selection coordinates computed over a block of trials.2 If only discrete error rates are recorded, as shown in Figure 6, then an alternate technique is used to compute We (see MacKenzie, 1992, for details). Throughput so computed is extremely useful because in a single measure it captures both the speed and accuracy in performance, thus increasing the ability of the measure to reveal overall performance differences between devices or interaction techniques. If the primary goal in a Fitts' law experiment is to establish performance differences between devices and/or interaction techniques, then throughput is the best choice as the criterion measure. The recommended calculation is the division of means with the aforementioned adjustment for accuracy:
| TP = IDe / MT | (eq 8) |
where
| IDe = log2( A / We + 1) . | (eq 9) |
This is the formula specified in the ISO standard for evaluating computer pointing devices (ISO, 1999). If the primary goal in a Fitts' law experiment is to generate a movement time prediction equation, then Equation 6 should be used. We will put this equation to work later in a case study.
The first use of Fitts' law in HCI was the study by Card et al. (1978), and in it they empirically established the superiority of the mouse over an isometric joystick. Many other Fitts' law studies have appeared since (e.g., Accot & Zhai, 1999; Arsenault & Ware, 2000; Douglas et al., 1999; Epps, 1986; MacKenzie, Kauppinen, & Silfverberg, 2001; MacKenzie & Oniszczak, 1998).
This concludes our detailed analysis of Fitts' law. In section 4 we present a case study showing an application of Fitts' law in predicting text entry rates on mobile phones.
3.2. Guiard's Model of Bimanual Skill
Humans are not only two-handed, they use their hands differently. This fact has been the subject of considerable study in a specialized area of motor behaviour known as bimanual control or laterality (Kelso, Southard, & Goodman, 1979; Peters, 1985; Porac & Coren, 1981; Wing, 1982). Studying the between-hand division of labour in everyday tasks reveals that most tasks are asymmetric: Our hands have different roles and perform distinctly different tasks. Given this, and the knowledge that people are either right-handed or left-handed, it follows that an examination of the assignment of tasks to hands is a useful exercise. This is the essence of Guiard's work, as presented in a seminal paper in 1987 (Guiard, 1987). The result of this work is a descriptive model of bimanual skill. Although the model lacks the mathematical rigor of Fitts' law, it is by no means less valuable as a tool to aid and inform designers of interactive systems.An important goal for descriptive models is to delineate the critical characteristics in a problem space, and this is precisely what Guiard's model does. Figure 8 identifies the roles and actions of the non-preferred and preferred hands, as given by Guiard.
| Hand | Role and Action |
|---|---|
| Non-preferred |
|
| Preferred |
|
The best way to explain the points in Figure 9 is through an exemplary illustration and narrative. In Figure 9, a right-handed graphic artist is shown sketching the design of a new car. The artist acquires the template with her left hand (non-preferred hand leads). The template is manipulated over the workspace (coarse movement, sets the frame of reference). The stylus is acquired in the right hand (preferred hand follows) and brought into the vicinity of the template (works within frame of reference set by the non- preferred hand). Sketching takes place (preferred hand makes precise movements).
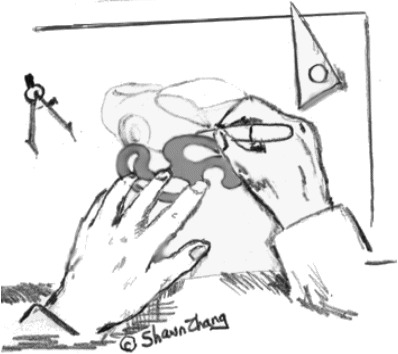
Figure 9. Two-handed interaction paradigm.
(Sketch courtesy of Shawn Zhang)
The roles and actions just described provide a provocative and fresh way of describing how humans approach common tasks. This is true both for common tasks and in the narrower context of human-computer interaction. About the same time that Guiard's model appeared, Buxton and Myers (1986) conducted an experiment to investigate two-handed input in CAD systems. Their work was undertaken independently of Guiard's work or of other work in experimental psychology on bimanual control or laterality. One of their studies describes a positioning and zooming task where the sub-tasks were performed by separate hands. The positioning task was performed using a graphics tablet "puck" in the preferred hand, while the zooming task was performed using a slider to control the size of an object. The goal was to manipulate an object so that it coincided in position and size with a similar object. Their second study describes a scrolling and selection task. The goal was to select words in a document. The document was sufficiently large that scrolling was necessary to locate the desired words. Their key findings were that subjects – without being instructed – gravitated to a two-handed interaction style, and that task completion times were less when a two-handed strategy was employed.
Unfortunately, Buxton and Myers (1986) provided very little insight into the differential roles of the hands in bimanual tasks (cf. Figure 8). They concluded only that the subjects' natural tendency toward a two-handed strategy was due to the "efficiency of hand motion" (p. 321). Watershed moments in multi-disciplinary fields like HCI often occur when researchers through due diligence locate and adopt relevant research in other fields – research that can inform and guide their own discipline.3 The union of HCI research in two-handed input and basic research in bimanual control occurred several years later, through the efforts of Paul Kabbash (Kabbash, Buxton, & Sellen, 1994; Kabbash, MacKenzie, & Buxton, 1993). The paper by Kabbash, Buxton, and Sellen (1994) was the first in HCI to cite Guiard's 1987 paper and to be guided by this important model. Subsequent HCI research in two-handed interaction has consistently used Guiard's descriptive model (see Figure 8) as a guiding principle in designing new interactive techniques that appropriately engage the hands of users.
4. Case Studies
In this section, two case studies are presented. The first is an application of Fitts' law in predicting text entry rates on mobile phones. The second is an examination of the affordances of the desktop computer interfaces in the context of two-handed input.
4.1. Case Study #1: Fitts' Law Predictions of Text Entry Rates on Mobile Phones
One recent application of Fitts' law is in predicting text entry rates on mobile phones. This is particularly relevant today because of the tremendous demand for text messaging on mobile phones. Current volumes are on the order of billions of SMS (short message service) messages per month (http://www.gsmworld.com).
4.1.1. Text entry on mobile phones
Before presenting our model, the main techniques for entering text on a mobile phone are described. Most mobile phones include a 12-key keypad similar to that in Figure 10.
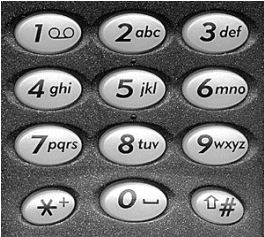
Figure 10. Standard 12-key mobile phone keypad
The keypad consists of number keys 0-9 and two additional keys (# and *). Characters a-z are spread over keys 2-9 in alphabetic order, with the SPACE character assigned to the 0 key. Since there are fewer keys than the 26 needed for the characters a-z, three or four characters are grouped on each key, and, so, ambiguity arises. There are two main approaches to text entry on a phone keypad: the multi-tap method and the one-key with disambiguation method.
Multi-tap. The multi-tap method is currently the most common text input method for mobile phones. With this approach, the user presses each key one or more times to specify the input character. For example, the 2 key is pressed once for the character a, twice for b, and three times for c (see Figure 10). As an example, quick brown fox is entered as follows:
Clearly, the multi-tap method bears substantial overhead. In the example above, 33 key presses generated 15 characters of text. Calculations using a language corpus indicate that "on average" the multi-tap method requires 2.034 keystrokes per character when entering English text (MacKenzie, 2002).477 88 444 222 55 0 22 777 666 9 66 0 333 666 99 q u i c k _ b r o w n _ f o x
The multi-tap approach suffers from the additional problem of segmentation. When a character is on the same key as the previous character, further ambiguity arises. For example, both letters in the word on are on the 6 key (see Figure 10). Successive key presses are segmented (viz. assigned to different characters) using either a timeout or a dedicated timeout kill key. We will say more about these techniques shortly.
One-key with disambiguation. An alternative way to overcome the ambiguity problem is to add linguistic knowledge to the system. We call this technique one-key with disambiguation. An example is T9 by Tegic Communications, Inc. (Seattle, WA; http://www.tegic.com/). When using T9, each key is pressed only once. For example,
Although each key maps to more than one letter, the system performs beyond-the-scenes disambiguation in determining the intended word. Naturally, linguistic disambiguation is not perfect, since multiple words may have the same key sequence. In these cases the most common word is the default. A demonstration follows: (Presses of the 0 key are omitted for clarity.)7 8 4 2 5 0 2 7 6 9 6 0 3 6 9 q u i c k _ b r o w n _ f o x
Candidate words are shown top-to-bottom, most probable at the top. Of the nine words in the phrase, eight are ambiguous, given the required key sequence. For seven of the eight, however, the most probable word is the intended word. The most probable word is not the intended word just once, with jazz being more probable in English than lazy. In this case, the user must press additional keys to obtain the desired word. Given the two input methods just described, it is worth speculating on the relative text entry rates attainable with each. For this, we can develop a prediction model using Fitts' law in combination with the probabilities of letter pairs, or digrams, in the desired language. This is described in the following section.843 78425 27696 369 58677 6837 843 5299 364 the quick brown fox jumps over the jazz dog tie stick crown lumps muds tie lazy fog vie vie
4.1.2. Predicting text entry rates using Fitts' law
Fitts' law is not an appropriate model for predicting typing speeds on a qwerty keyboard, since the task is complex and involves parallel and/or overlapping movements by two hands and ten fingers. However, if the task is reduced to input via a single finger or stylus, then the situation is completely different. With a single stream of motor actions, the task is a standard target acquisition task conforming to the Fitts paradigm.Text entry on a mobile phone, for example, consists of aiming for and acquiring (viz., pressing) a series of keys "as quickly and accurately as possible". Users typically perform this task either using their index finger or thumb. The time to press any key, given any previous key, can be readily predicted using Fitts' law. Models for pressing keys on a mobile phone are reported by Silfverberg, MacKenzie, and Korhonen (2000). For index finger input,
| MT = 165 + 52 ID | (eq 10) |
and for thumb input,
| MT = 176 + 64 ID | (eq 11) |
The only ingredients required to build a text entry prediction model are information on the position and size of keys, the letter assignment to keys, and the relative probabilities of digrams in the target language. These are close at hand. The position and size of keys are easily quantized for any mobile phone keypad using a ruler. The standard assignment of letters to keys is shown in Figure 10. Tables of digram probabilities are available from a variety of sources (e.g., Mayzner & Tresselt, 1965; Soukoreff & MacKenzie, 1995; Underwood & Schulz, 1960). A final task – laborious but simple – is to put this information together along with the Fitts' law equations in an electronic form suitable for generating the predictions. A spreadsheet application suffices.
If we limit the model to text entry using 26 letters plus the SPACE character, then there are 272 = 729 target acquisition tasks, one for each letter j given a preceding letter i. The time to enter each i-j sequence is predicted using Fitts' law, yielding MTij. The time is weighted by the probability of the digram in the target language, Pij. For English, sequences like t-h or e-SPACE have high probabilities, whereas sequences like g-k or f-v have low probabilities. The sum of the 729 weighted movement times is the mean movement time per character for the target language for the given interaction technique:
| MTL = Σ Σ (Pij × MTij ) | (eq 12) |
This is converted to a text entry rate in words per minute by multiplying by 60 seconds per minute and dividing by 5 characters per word:5
| WPM = MTL × (60 / 5) | (eq 13) |
4.1.3. Predicted text entry rates on mobile phones
There are a few additional details to accommodate before predictions are available. For the multi-tap method, keys are pressed one to four times depending on each letter's position on a key. To account for this behaviour we introduce the key repeat time, MTREPEAT , the time to press a key having just pressed the same key. This is a Fitts' law task with "zero movement amplitude" (viz. A = 0). From Equation 5, the index of difficulty is ID = log2(0 / W + 1) = 0 bits. Hence, MTREPEAT is the intercept in the Fitts' law (see Equations 6, 10, and 11). Thus, to MTij we add N × MTREPEAT, where N varies from 0 to 3.Additionally, the multi-tap method requires a special technique to segment consecutive characters on the same key, as noted earlier. One technique – wait-for-timeout – is to hesitate for a timeout interval (TTIMEOUT) between keypresses for each character. Although durations vary among manufacturers, a reasonable value is TTIMEOUT = 1500 ms. This is the setting on Nokia phones. The other technique – timeout-kill – is to press an explicit timeout kill key, thus allowing direct entry of the second character. On Nokia phones, this is implemented using the DOWN-ARROW key. For the timeout kill strategy, we use MTi-KILL + MTKILL-j instead of MTij where i and j are on the same key. The user may choose whether to use the wait-for-timeout or timeout-kill segmentation strategy; so, a prediction model is built for each strategy. Without further ado, Figure 11 gives the predicted expert text entry rates for mobile phones for the input methods and interaction techniques just described.
| Method | Predicted Expert Entry Rate (wpm) | |
|---|---|---|
| Index Finger | Thumb | |
| Multi-tap - wait for timeout - timeout kill | 22.5 27.2 | 20.8 24.5 |
| One-key with disambiguation | 45.7 |
40.6
|
mobile phones (from Silfverberg et al., 2000)
Multi-tap entry rates vary from 20.8 wpm to 27.2 wpm depending on interaction technique (index finger vs. thumb) and the timeout strategy employed. In general, index finger entry is faster than thumb entry.
A few follow-up comments are warranted. Note the prefix "expert" in Figure 11. Indeed, the predictions represent an upper bound. In particular, they do not account for the time to visually scan the keypad to find the next key to press. Zero visual scan time is reasonable for expert users, but novices must visually attend to the keypad during entry. This will push entry rates down. The predictions also assume error-free input. This simplifies the prediction model, but, in practice, users are fallible and overhead is incurred in correcting mistakes. So, all rates in Figure 11 must be viewed in the proper context: they represent only the motor component of error-free expert input.
With predictions above 40 wpm, clearly the one-key with disambiguation method is far superior to the multi-tap method. However, these rates are coincident with rather broad assumptions, and also must be viewed in the appropriate context. As noted, the rates are for error-free expert input. However, at least two additional assumptions are present for the one-key with disambiguation method: (i) all words are in the system's dictionary, and (ii) when ambiguity arises, the intended word is the most probable in the list of candidates. Clearly, violations in these assumptions will push rates down, but a detailed discussion of the mechanisms at work is beyond the scope of this paper. See Silverberg et al. (2000) for further discussion.
For our next case study, we return to Guiard's model of bimanual control.
4.2. Case Study #2: Bimanual Control and Desktop Computer Affordances
Affordances are the action possibilities an artifact offers to a user (Gibson, 1979). A keyboard's keys can be pressed, a mouse can be acquired and moved, mouse buttons can be pressed and a mouse wheel can be rotated. These are the what of desktop computer affordances. Let's consider the where.On a typical desktop keyboard, keys are spread across the device, there is a wide space bar along the bottom, and non-alpha keys are in various locations. Although slight variations exist, the 101-style keyboard is the most common today. An example is given in Figure 12 which also identifies the categories of keys as per the key-action model presented in Section 2.2.1.
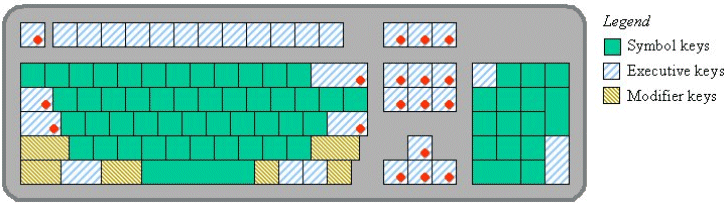
Figure 12. 101-style keyboard and key categories as per
the key-action model (see text for a discussion of the dots)
Of concern here are the "power keys", consisting of executive keys (e.g., ENTER) and modifier keys (e.g., SHIFT). On the keyboard's left we find SHIFT, CTRL, ALT, TAB, CAPS LOCK, ESC, while on the right we find no less than 18 power keys: SHIFT, CTRL, ALT, ENTER, BACKSPACE, INSERT, DELETE, HOME, END, PAGE UP, PAGE DOWN, ←, ↑, →, ↓, PRNT SCRN, SCROLL LOCK, and PAUSE. Because SHIFT, CTRL, and ALT are mirrored, they do not pose a left- or right-hand bias and are eliminated from further discussion. Only three keys on the left (ESC, TAB, CAPS LOCK) are without a right-side replica, thus, the numbers are 3 on the left, 15 on the right. These are identified by dots in Figure 12. The ratio is 1:5.
Clearly, the keyboard is entrenched with a right-side bias. This was fine in the 1970s; however, the emergence of the GUI and point-and-click interfaces in the 1980s changed everything (but not the keyboard, apparently). Most users grasp the mouse in their right hand. A simple observation is that the right hand is busy, and, arguably, overloaded.
Interactions that involve both power-key activation and pointing are exacerbated for right-handed users: their options are to "reach over" with the left hand, or to release the mouse and acquire and activate a power key with their right hand.
The scenario differs for left-handed users, however. By positioning the mouse on the left side of the keyboard and manipulating it with the left hand, the action possibilities of the desktop interface are dramatically changed (see Figure 13). The confounding of power key activation with pointing operations is greatly reduced.
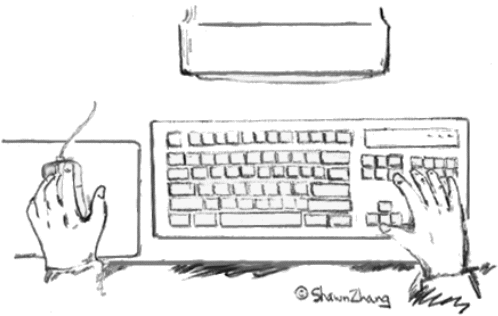
Figure 13. A left-handed user interacting with a desktop
system. (Sketch courtesy of Shawn Zhang)
The brief analyis above clearly shows that the affordances of a typical desktop system are substantially different for left-handed users who manipulate the mouse in their left hand. An important question is this: Are left-handed users well-served by the configuration in Figure 13? This question is by no means simple to answer. A detailed response would require a checklist-style examination of a myriad of tasks typical of desktop use. However, a cursory answer to this question is "yes". Let's examine why.
If we combine the earlier points on affordances and human skill in analyzing common GUI tasks, we see that the bimanual skill model is often violated (viz. preferred hand leads). Of course, there is little gained in suggesting a ground-up redesign of computer keyboards – it's too late! Faced with the unyielding affordances of current keyboards, users (both left-handed and right-handed) naturally discover and adopt strategies of optimization. In short, users find ways to optimize, often in spite of the interface. The path of discovery seems to favor left-handed users, however. Four examples are cited in Figure 14, as performed by left-handed users.
| Task | Leading Movement | Trailing/Overlapping Movement |
|---|---|---|
| Delete | Left hand – manipulate pointer with mouse and select text/object by double clicking or dragging | Right hand – press DELETE (probably with little finger) |
| Select an option in a window (see Figure 15) | Left hand – manipulate pointer with mouse and click on an option | Right hand – press ENTER (Note: OK button is the default; see Figure 15) |
| Click on a link in a browser | Right hand – navigate to link via PAGE UP and/or PAGE DOWN keys | Left hand – manipulate pointer with mouse and select link by clicking on it |
| Open a file, open a folder, or launch a program | Left hand – manipulate pointer with mouse and single click on icon | Right hand – press ENTER (Note: avoids error prone double-click operation) |
user manipulating the mouse in the left hand
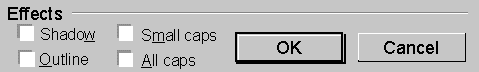
Figure 15. Selecting an option in a window (see Figure 14)
Although multiple techniques are available for the tasks in Figure 14, the example tasks are not only fast for left-handed users, they are faster for left-handed users than for right-handed users. (Right-handed readers may wish to reconsider the examples.) The unifying observation is this:
When pointing is juxtaposed with power key activation (excluding SHIFT, ALT, & CONTROL), the desktop interface presents a left-hand bias.This is evident in the Figure 14. All the tasks involve a tight coupling of pointing operations with power key activation. If right-handed users attempt the same tasks, their options are to release the mouse and activate the power key with their right hand, or to reach over the keyboard with their left hand – awkward in either case.
Importantly, the tasks are what we do all the time. Note in the 3rd column in Figure 14 that trailing movements are also identified as "overlapping". Because the sub-tasks in the 2nd and 3rd columns are performed by separate hands, there is preparatory trailing movement that overlaps the leading movement. The action point in the trailing movement immediately follows the leading movement. And so, left-handed users persistently "cash in" on small time savings. This leads to a simple conclusion that the desktop interface presents a left-hand bias.
4.2.1. Scrolling
Although Guiard's model of bimanual control alerts us to the differential roles of our hands, the analysis above is after-the-fact. It is unlikely that keyboard manufacturers will launch a re-design of the keyboard – positioning power keys on the left to facilitate right-handed interaction – based on the examples in Figure 14. However, Guiard's model does lend credence to one design deficiency worthy of correcting – scrolling. Although scrolling is an extremely common GUI task, affordances are poor for left-handed users and right-handed users.Scrolling is traditionally accomplished by dragging the "elevator" of the scrollbar positioned along the right-hand side of a application's window. Acquiring the elevator is a target acquisition task taking up to two seconds per trial. More importantly, this action is in conflict with a basic goal of good user interfaces: unobtrusiveness and transparency. That is, users should not be required to divert their attention from the primary task (reading, editing, etc.) to explicitly manipulate user interface widgets (Zhai & MacKenzie, 1998).
This we see as an opportunity for design. Scrolling is well suited to delegation to the non-preferred hand, since its relationship with other tasks conforms to Guiard's model of bimanual control. Evidence of this is presented in Figure 16, which contrasts the properties of scrolling with tasks typically performed in concert with scrolling. (The reader is invited to compare the first three bullets in Figure 16 with the first three bullets in Figure 8, which presents the guiding principles in Guiard's model of bimanual control.)
| Task | Characteristics |
|---|---|
| Scrolling |
|
| Selecting, editing, reading, drawing, etc. |
|
Desktop affordances for scrolling changed dramatically in 1996 with the introduction of Microsoft's IntelliMouse, which included a scrolling wheel between the mouse buttons. Numerous copy-cat variations have since appeared from other manufacturers. The so-called wheel mouse puts scrolling in the preferred hand. This is bad news for left-handed users, but it is even worse for right-handed users because of the higher right-side demands presented by the power-key bias noted earlier.
Figure 17 presents a scrolling concept for a right-handed user. A touch strip is shown, but a wheel could just as easily be used. There are many implementation issues, such as scrolling sensitivity and support for up/down paging, but space precludes elaboration. Our point is simply that scrolling should be delegated to the non-dominant hand. See also Buxton and Myers (1986), Kabbash et al. (1994), and MacKenzie and Guiard (2001)
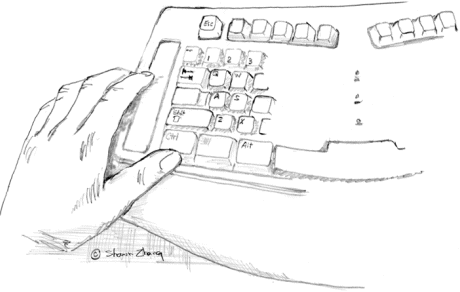
Figure 17. Scrolling interface example. (Sketch courtesy of Shawn Zhang)
In this section, we examined common GUI tasks and patterns of bimanual skill. Two important observations emerged: first, current desktop systems are biased for left-handed users, and second, scrolling should be delegated to the non-dominant hand. In the absence of a detailed functional taxonomy unifying the actions of the preferred hand and non-preferred hand with system affordances, however, further design recommendations are premature. Broadly stated, such efforts should seek to tightly couple the hands – supporting sequential, cooperative action – with tasks such as power key activation, pointing, selecting, and scrolling.
5. Current Status and Further Reading
Both Fitts' law and Guiard's model of bimanual skill continue as popular research tools in human-computer interaction. Fitts' law remains the pre-eminent model for pointing device research. Evidence of this is the recent appearance of Fitts' law in an ISO standard. The full standard, ISO 9241, is called Ergonomic requirements for office work with visual display terminals (VDTs). Part 9 is called Requirements for non-keyboard input devices (ISO, 1999). ISO 9241-9 is a comprehensive document that defines evaluation procedures for measuring user performance, comfort, and effort with pointing devices. An experimental protocol defines subject samples, stimuli, experimental design, environmental conditions, furniture adjustments, data collection procedures, and data analysis recommendations.Performance is measured on any of six exemplary tasks, three of which are standard point-select tasks conforming to the Fitts' paradigm The dependent measure for the evaluations is throughput, computed as noted earlier (see Equation 8). The use of ISO 9241-9 should go a long way in bringing consistency to empirical evaluations of computer pointing devices. In particular, across-study comparisons are strengthened if studies adopt a consistent methodology. Reviews of ISO 9241-9 are given by Douglas and Mithal (1997, chap. 8); Douglas, Kirkpatrick, and MacKenzie (1999); and Smith (1996, chap. 3). At least six pointing device studies have been published wherein the methodology conforms to ISO 9241-9 (Douglas et al., 1999; MacKenzie & Jusoh, 2001; MacKenzie et al., 2001; MacKenzie & Oniszczak, 1998; Oh & Stuerzlinger, 2002; Silfverberg, MacKenzie, & Kauppinen, 2001).
Another active area of Fitts' law research is in extending its application to a different genre of tasks. Until recently, Fitts' law was only applied in time-minimizing tasks (aka rapid aimed movements). Space-minimizing tasks are distinctly different. In a space minimizing task, users move a tracking symbol such as a cursor while trying to minimize the deviation of the symbol from a pre-defined path. Accot and Zhai effectively showed how to model this behaviour using a variation of Fitts' law aptly named the Steering law (Accot & Zhai, 1997). Examples include navigating hierarchical menus, manipulating an elevator on a scrollbar, or tracing the outline of a shape. Besides the clear need for a prediction model for this genre of tasks, this work is important because it seeks to unify distinctly different motor behaviours within a single theoretical framework. Two related follow-up studies have also appeared (Accot & Zhai, 1999; Accot & Zhai, 2001).
Guiard's work is a continuing source of inspiration for designers of systems for interactive 3-D graphics. These systems are generally high-end workstations with graphics accelerators and high-resolution displays. They often support input via graphics tablets and a stylus. The interface is complex, supporting a vast array of functionality. And, so, efforts to improve the interface through two-handed interaction are well invested. Several sources of this work are hereby cited (e.g., Balakrishnan & Hinckley, 2000; Balakrishnan & Kurtenbach, 1999; Fitzmaurice, Balakrishnan, Kurtenbach, & Buxton, 1999; Hinckley, Pausch, Proffitt, & Kassell, 1998; Hinckley, Pausch, Proffitt, Patten, & Kassett, 1997; Kurtenbach, Fitzmaurice, Baudel, & Buxton, 1997; Zhai, Smith, & Selker, 1997a; Zhai, Smith, & Selker, 1997b).
For readings on other predictive models developed with an eye to human-computer interfaces, the reader is directed to the several sources. Examples include the GOMS model by Card, Moran, and Newell (Card et al., 1983; John, 1995; John & Kieras, 1996; Kieras, Wood, & Meyer, 1997), or the programmable user model (PUM) by Young, Green, and Simon (Young, Green, & Simon, 1989).
For other descriptive models on input devices, including movement characteristics, properties sensed, stimulus-response mappings, and interaction techniques, the reader is directed to several primary sources (Buxton, 1983; Card, Mackinlay, & Robertson, 1990; Card, Mackinlay, & Robertson, 1991; Foley, Wallace, & Chan, 1984; Jacob, Sibert, McFarlane, & Mullen Jr., 1994; Mackinlay, 1990; Ren & Moriya, 2000).
6. References
Accot, J., & Zhai, S. (1997). Beyond Fitts' law: Models for trajectory-based HCI tasks. Proceedings of the CHI '97 Conference on Human Factors in Computing Systems, New York: ACM, pp. 295-302. https://dl.acm.org/doi/pdf/10.1145/258549.258760Accot, J., & Zhai, S. (1999). Performance evaluation of input devices in trajectory-based tasks: An application of the Steering Law. Proceedings of the ACM Conference on Human Factors in Computing Systems - CHI '99, New York: ACM, pp. 466-472. https://doi.org/10.1145/302979.303133
Accot, J., & Zhai, S. (2001). Scale effects in steering law tasks: Do device size and different motor joints matter? Proceedings of the ACM Conference on Human Factors in Computing Systems - CHI 2001, New York: ACM, pp. 1-8. https://doi.org/10.1145/365024.365027
Arsenault, R., & Ware, C. (2000). Eye-hand co-ordination with force feedback. Proceedings of the ACM Conferernce on Human Factors in Computing Systems - CHI 2000, New York: ACM, pp. 408-414. https://doi.org/10.1145/332040.332466
Balakrishnan, R., Baudel, T., Kurtenbach, G., & Fitzmaurice, G. (1997). The Rockin'Mouse: Integral 3D manipulation on a plane. Proceedings of the ACM Conference on Human Factors in Computing Systems - CHI '97, New York: ACM, pp. 311-318. https://doi.org/10.1145/332040.332404
Balakrishnan, R., & Hinckley, K. (2000). Symmetric bimanual interaction, Proceedings of ACM Conference on Human Factors in Computing Systems - CHI 2000 (Vol. 1, pp. 33-40): New York: ACM. https://doi.org/10.1145/332040.332404
Balakrishnan, R., & Kurtenbach, G. (1999). Exploring bimanual camera control and object manipulation in 3D graphics interfaces, Proceedings of ACM Conference on Human Factors in Computing Systems - CHI '99 (Vol. 1, pp. 56-63): New York: ACM. https://doi.org/10.1145/302979.302991
Buxton, W. (1983, January). Lexical and pragmatic considerations of input structures. Computer Graphics, 31-37. https://dl.acm.org/doi/pdf/10.1145/988584.988586
Buxton, W., & Myers, B. A. (1986). A study in two-handed input. Proceedings of the ACM Conference on Human Factors in Computing Systems - CHI '87, New York: ACM, pp. 321-326. https://doi.org/10.1145/22339.22390
Buxton, W. A. S. (1990). A three-state model of graphical input. Proceedings of INTERACT '90, Amsterdam: Elsevier Science, pp. 449-456. https://citeseerx.ist.psu.edu/document?repid=rep1&type=pdf&doi=f638fa48585ff321093454a9478373265add0082
Card, S. K., English, W. K., & Burr, B. J. (1978). Evaluation of mouse, rate-controlled isometric joystick, step keys, and text keys for text selection on a CRT. Ergonomics, 21, 601-613.
Card, S. K., Mackinlay, J. D., & Robertson, G. G. (1990). The design space of input devices. Proceedings of the ACM Conference on Human Factors in Computing Systems - CHI '90, New York: ACM, pp. 117-124. https://doi.org/10.1145/97243.97263
Card, S. K., Mackinlay, J. D., & Robertson, G. G. (1991). A morphological analysis of the design space of input devices. ACM Transactions on Office Information Systems, 9, 99-122. https://doi.org/10.1145/123078.128726
Card, S. K., Moran, T. P., & Newell, A. (1980). The keystroke-level model for user performance time with interactive systems. Communications of the ACM, 23, 396-410. https://dl.acm.org/doi/pdf/10.1145/358886.358895
Card, S. K., Moran, T. P., & Newell, A. (1983). The psychology of human-computer interaction. Hillsdale, NJ: Lawrence Erlbaum. https://doi.org/10.1201/9780203736166
Douglas, S. A., Kirkpatrick, A. E., & MacKenzie, I. S. (1999). Testing pointing device performance and user assessment with the ISO 9241, Part 9 standard. Proceedings of the ACM Conference on Human Factors in Computing Systems - CHI '99, New York: ACM, pp. 215-222. https://doi.org/10.1145/302979.303042
Douglas, S. A., & Mithal, A. K. (1997). The ergonomics of computer pointing devices. New York: Springer Verlag.
Epps, B. W. (1986). Comparison of six cursor control devices based on Fitts' law models. Proceedings of the Human Factors Society 30th Annual Meeting, Santa Monica, CA: Human Factors Society, pp. 327-331. https://doi.org/10.1177/154193128603000403
Fitts, P. M. (1954). The information capacity of the human motor system in controlling the amplitude of movement. Journal of Experimental Psychology, 47, 381-391. https://psycnet.apa.org/doi/10.1037/h0055392
Fitts, P. M., & Peterson, J. R. (1964). Information capacity of discrete motor responses. Journal of Experimental Psychology, 67, 103-112. https://psycnet.apa.org/doi/10.1037/h0045689
Fitzmaurice, G. W., Balakrishnan, R., Kurtenbach, G., & Buxton, B. (1999). An exploration into supporting artwork orientation in the user interface, Proceedings of ACM Conference on Human Factors in Computing Systems - CHI '99 (Vol. 1, pp. 167-174): New York: ACM. https://doi.org/10.1145/302979.303033
Foley, J. D., Wallace, V. L., & Chan, P. (1984). The human factors of computer graphics interaction techniques. IEEE Computer Graphics and Applications, 4(11), 13-48. https://doi.org/10.1109/MCG.1984.6429355
Gibson, J. J. (1979). The ecological approach to visual perception. Hillsdale NJ: Erlbaum. https://doi.org/10.4324/9781315740218
Guiard, Y. (1987). Asymmetric division of labor in human skilled bimanual action: The kinematic chain as a model. Journal of Motor Behavior, 19, 486-517. https://doi.org/10.1080/00222895.1987.10735426
Haunold, P., & Kuhn, W. (1994). A keystroke level analysis of a graphics application: manual map digitizing. Proceedings of the ACM Conference on Human Factors in Computing Systems - CHI '94, New York: ACM, pp. 337-343. https://dl.acm.org/doi/pdf/10.1145/191666.191779
Hick, W. E. (1952). On the rate of gain of information. Quarterly Journal of Experimental Psychology, 4, 11-36. https://doi.org/10.1080/17470215208416600
Hinckley, K., Pausch, R., Proffitt, D., & Kassell, N. F. (1998). Two-Handed Virtual Manipulation. ACM Transactions on Computer-Human Interaction, 5(3), 260-302. https://doi.org/10.1145/292834.292849
Hinckley, K., Pausch, R., Proffitt, D., Patten, J., & Kassett, N. (1997). Cooperative bimanual action. Proceedings of the CHI'97 Conference on Human Factors in Computing Systems, New York: ACM, pp. 27-34. https://dl.acm.org/doi/pdf/10.1145/258549.258571
Hyman, R. (1953). Stimulus information as a determinant of reaction time. Journal of Experimental Psychology, 45, 188-196. https://psycnet.apa.org/doi/10.1037/h0056940
ISO. (1999). Ergonomic requirements for office work with visual display terminals (VDTs) - Part 9 - Requirements for non-keyboard input devices (ISO 9241-9) (Report Number ISO/TC 159/SC4/WG3 N147): International Organisation for Standardisation. https://www.iso.org/obp/ui/#iso:std:iso:9241:-9:ed-1:v1:en:sec:A
Jacob, R. J. K., Sibert, L. E., McFarlane, D. C., & Mullen Jr., M. P. (1994). Integrality and separability of input devices. ACM Transactions on Computer-Human Interaction, 1, 3- 26. https://doi.org/10.1145/174630.174631
John, B. E. (1995). Why GOMS? Interactions, 2(4), 80-89. https://dl.acm.org/doi/pdf/10.1145/225362.225374
John, B. E., & Kieras, D. E. (1996). Using GOMS for user interface design and evaluation: Which technique? CM Transactions on Computer-Human Interaction, 2, 287-319. https://doi.org/10.1145/235833.236050
Kabbash, P., Buxton, W., & Sellen, A. (1994). Two-handed input in a compound task. Proceedings of the ACM Conference on Human Factors in Computing Systems - CHI '94, New York: ACM, pp. 417-423. https://dl.acm.org/doi/pdf/10.1145/191666.191808
Kabbash, P., MacKenzie, I. S., & Buxton, W. (1993). Human performance using computer input devices in the preferred and non-preferred hands. Proceedings of the INTERCHI '93 Conference on Human Factors in Computing Systems, New York: ACM, pp. 474-481. https://doi.org/10.1145/169059.169414
Kelso, J. A. S., Southard, D. L., & Goodman, D. (1979). On the coordination of two-handed movements. Journal of Experimental Psychology: Human Perception and Performance, 5(2), 229-238. https://psycnet.apa.org/doi/10.1037/0096-1523.5.2.229
Kieras, D. E., Wood, S. D., & Meyer, D. E. (1997). Predictive engineering models based on the EPIC architecture for a multimodal high-performance human-computer interaction task. ACM Transactions on Human-Computer Interaction, 4(3), 230-275. https://doi.org/10.1145/264645.264658
Koester, H., & Levine, S. P. (1994). Validation of a keystroke-level model for a text entry system used by people with disabilities. Proceedings of the First ACM Conference on Assistive Technologies, New York: ACM, pp. 115-122. https://doi.org/10.1145/191028.191061
Kurtenbach, G., Fitzmaurice, G., Baudel, T., & Buxton, W. (1997). The design and evaluation of a GUI paradigm based on tablets, two-hands, and transparency. Proceedings of the ACM Conference on Human Factors in Computing Systems - CHI '97, New York: ACM, pp. 35-42. https://dl.acm.org/doi/pdf/10.1145/258549.258574
Landauer, T. K., & Nachbar, D. W. (1985). Selection from alphabetic and numeric menu trees using a touch screen: Breadth, depth, and width. Proceedings of the ACM Conference on Human Factors in Computing Systems - CHI '85, ACM, pp. 73-77. https://doi.org/10.1145/1165385.317470
Lane, D. M., Napier, H. A., Batsell, R. R., & Naman, J. L. (1993). Predicting the skilled use of hierarchical menus with the keystroke-level model. Human-Computer Interaction, 8, 185-192. https://doi.org/10.1207/s15327051hci0802_4
MacKenzie, I. S. (1989). A note on the information-theoretic basis for Fitts' law. Journal of Motor Behavior, 21, 323-330. https://doi.org/10.1080/00222895.1989.10735486
MacKenzie, I. S. (1991). Fitts' law as a performance model in human-computer interaction. Unpublished Doctoral Dissertation, University of Toronto. https://www.yorku.ca/mack/phd.html
MacKenzie, I. S. (1992). Fitts' law as a research and design tool in human-computer interaction. Human-Computer Interaction, 7, 91-139. https://doi.org/10.1207/s15327051hci0701_3
MacKenzie, I. S. (2002). KSPC (keystrokes per character) as a characteristic of text entry techniques. Proceedings of the Fourth International Symposium on Human Computer Interaction with Mobile Devices, pp. 195-210. Berlin: Springer Verlag. https://doi.org/10.1007/3-540-45756-9_16
MacKenzie, I. S., & Guiard, Y. (2001). The two-handed desktop interface: Are we there yet? Extended Abstracts of the ACM Conference on Human Factors in Computing Systems - CHI 2001, New York: ACM, pp. 351-352. https://doi.org/10.1145/634067.634275
MacKenzie, I. S., & Jusoh, S. (2001). An evaluation of two input devices for remote pointing. Proceedings of the Eighth IFIP Working Conference on Engineering for Human- Computer Interaction - EHCI 2000, Heidelberg, Germany: Springer-Verlag, pp. 235-249. https://doi.org/10.1007/3-540-45348-2_21
MacKenzie, I. S., Kauppinen, T., & Silfverberg, M. (2001). Accuracy measures for evaluating computer pointing devices. Proceedings of the ACM Conference on Human Factors in Computing Systems - CHI 2001, New York: ACM, pp. 9-16. https://doi.org/10.1145/365024.365028
MacKenzie, I. S., & Oniszczak, A. (1997). The tactile touchpad. Extended Abstracts of the CHI '97 Conference on Human Factors in Computing Systems, New York: ACM, pp. 309- 310. https://doi.org/10.1145/1120212.1120408
MacKenzie, I. S., & Oniszczak, A. (1998). A comparison of three selection techniques for touchpads. Proceedings of the ACM Conference on Human Factors in Computing Systems - CHI '98, New York: ACM, pp. 336-343. https://dl.acm.org/doi/pdf/10.1145/274644.274691
MacKenzie, I. S., Sellen, A., & Buxton, W. (1991). A comparison of input devices in elemental pointing and dragging tasks. Proceedings of the ACM Conference on Human Factors in Computing Systems - CHI '91, New York: ACM, pp. 161-166. https://dl.acm.org/doi/pdf/10.1145/108844.108868
MacKenzie, I. S., Soukoreff, W. R., & Pal, C. (1997). A two-ball mouse affords three degrees of freedom. Extended Abstracts of the ACM Conference on Human Factors in Computing Systems - CHI '97, New York: ACM, pp. 303-304. https://doi.org/10.1145/1120212.1120405
MacKenzie, I. S., Zhang, S. X., & Soukoreff, R. W. (1999). Text entry using soft keyboards. Behaviour & Information Technology, 18, 235-244. https://doi.org/10.1080/014492999118995
Mackinlay, J. D., Card, S. K., & Robertson, G. G. (1990). A semantic analysis of the design space of input devices. Human-Computer Interaction, 5, 145-190. https://doi.org/10.1080/07370024.1990.9667153
MacNeill, D., & Blickenstorfer, C. H. (1996, May/June). Trackpads: Alternative input technologies. Pen Computing, 3, 42-45.
Marchionini, G., & Sibert, J. (1992). An agenda for human-computer interaction: Science and engineering serving human needs. SIGCHI Bulletin, 23(4), 17-32. https://doi.org/10.1145/126729.126741
Mayzner, M. S., & Tresselt, M. E. (1965). Table of single-letter and digram frequency counts for various word-length and letter-position combinations. Psychonomic Monograph Supplements, 1(2), 13-32. https://psycnet.apa.org/record/1967-02842-001
Meyer, D. E., Smith, J. E. K., Kornblum, S., Abrams, R. A., & Wright, C. E. (1990). Speed- accuracy tradeoffs in aimed movements: Toward a theory of rapid voluntary action. In M. Jeannerod (Ed.), Attention and performance XIII . Hillsdale, NJ: Erlbaum. https://drive.google.com/file/d/1LR0UrqQwVexXMKHDBeaTNqScADco6Xis/view
Nicols, S., & Ritter, F. E. (1995). A theoretically motivated tool for automatically generating command aliases. Proceedings of the ACM Conference on Human Factors in Computing Systems - CHI '95, New York: ACM, pp. 393-400. https://dl.acm.org/doi/fullHtml/10.1145/223904.223955
Norman, D. A. (1988). The design of everyday things. New York: Doubleday. https://dl.icdst.org/pdfs/files4/4bb8d08a9b309df7d86e62ec4056ceef.pdf
Oh, J.-Y., & Stuerzlinger, W. (2002). Laser pointers as collaborative pointing devices. Proceedings of Graphics Interface 2002, pp. 141-149. Toronto: Canadian Information Processing Society. https://citeseerx.ist.psu.edu/document?repid=rep1&type=pdf&doi=004c4356139eba0e884cd0d60321c85c38b78de5
Peters, M. (1985). Constraints in the performance of bimanual tasks and their expression in unskilled and skilled subjects. Quarterly Journal of Experimental Psychology, 37A, 171- 196. https://doi.org/10.1080/14640748508400929
Porac, C., & Coren, S. (1981). Lateral preference and human behaviour. New York: Springer Verlag. https://link.springer.com/book/10.1007/978-1-4613-8139-6
Ren, X., & Moriya, S. (2000). Improving selection performance on pen-based systems: A study of pen-based interaction for selection tasks. ACM Transactions on Computer-Human Interaction, 7(3), 384-416. https://doi.org/10.1145/355324.355328
Shannon, C. E., & Weaver, W. (1949). The mathematical theory of communications. Urbana, Il: University of Illinois Press. https://dl.acm.org/doi/abs/10.1145/584091.584093
Silfverberg, M., MacKenzie, I. S., & Kauppinen, T. (2001). An isometric joystick as a pointing device for handheld information terminals. Proceedings of Graphics Interface 2001, Toronto, Canada: Canadian Information Processing Society, pp. 119-126. https://www.yorku.ca/mack/gi2001.pdf
Silfverberg, M., MacKenzie, I. S., & Korhonen, P. (2000). Predicting text entry speed on mobile phones. Proceedings of the ACM Conference on Human Factors in Computing Systems - CHI 2000, New York: ACM, pp. 9-16. https://doi.org/10.1145/332040.332044
Smith, W. J. (1996). ISO and ANSI ergonomic standards for computer products: A guide to implementation and compliance. Upper Saddle River, NJ: Prentice Hall. https://dl.acm.org/doi/abs/10.5555/227411
Soukoreff, W., & MacKenzie, I. S. (1995). Theoretical upper and lower bounds on typing speeds using a stylus and soft keyboard. Behaviour & Information Technology, 14, 370-379. https://doi.org/10.1080/01449299508914656
Toleman, M. A., & Welsh, J. (1996). Can design choices for language-based editors be analysed with keystroke-level models? Proceedings of the HCI '96 Conference on People and Computers, Surrey, UK: Springer-Verlag, pp. 97-112. https://doi.org/10.1007/978-1-4471-3588-3_7
Underwood, B. J., & Schulz, R. W. (1960). Meaningfulness and verbal learning. Philadelphia: Lippincott. https://psycnet.apa.org/record/1961-03113-000
Welford, A. T. (1968). Fundamentals of skill. London: Methuen. https://psycnet.apa.org/record/1968-35018-000
Wing, A. (1982). Timing and coordination of repetitive bimanual movements. Quarterly Journal of Experimental Psychology, 34A, 339-348. https://doi.org/10.1080/14640748208400847
Young, R. M., Green, T. R. G., & Simon, T. (1989). Programmable user models for predictive evaluation of interface designs. Proceedings of the ACM Conference on Human Factors in Computing Systems - CHI '89, ACM, pp. 15-20. https://doi.org/10.1145/67450.67453
Zhai, S., & MacKenzie, I. S. (1998). Teaching old mice new tricks: Innovations in computer mouse design. Proceedings of Ergon-Axia '98 - the First World Congress on Ergonomics for Global Quality and Productivity, pp. 80-83. https://www.yorku.ca/mack/axia98.pdf
Zhai, S., Smith, B. A., & Selker, T. (1997a). Dual stream input for pointing and scrolling. Proceedings of the CHI '97 Conference on Human Factors in Computing Systems, New York: ACM, pp. 305-306. https://doi.org/10.1145/1120212.1120406
Zhai, S., Smith, B. A., & Selker, T. (1997b). Improving browsing performance: A study of four input devices for scrolling and pointing tasks. Proceedings of INTERACT '97, Amsterdam: Elsevier, pp. 286-292. https://doi.org/10.1007/978-0-387-35175-9_48
Footnotes
1 The data sets in Figure 6 are from the 4th block of trials in a Fitts' law experiment comparing four pointing devices, including a Microsoft Mouse 2.0 (Device 'A') and an Interlink RemotePoint (Device 'B'). See MacKenzie and Jusoh (2001) for complete details on the devices and the experimental methodology.
2 The coefficient 4.133 emerges from the term (2 π e)1/2 in Shannon's original theorem. See MacKenzie (1992) for details.
3 There are many examples in HCI, for example, Card, English, and Burr's (1978) first use of Fitts' law (Fitts, 1954), or Norman's (Norman, 1988) introduction of Gibson's affordances (Gibson, 1979).
4 This figure is computed based on entering text consisting of the 26 letters plus the SPACE character. If only letters are considered, the figure is about 2.26 keystrokes per character.
5 The average size of a word in English is about 4.5 characters. However in computing text entry throughput in "words per minute" it is customary to consider a "word" any sequence of 5 characters, including letters, spaces, punctuation, etc.