4. LITERATURE REVIEW AND SURVEYS
A comprehensive review of research using Fitts' law would be a
monumental task. A quick tally from the Social Sciences Citation
Index between 1970 and 1988 reveals 248 citations of Fitts' 1954
paper. Even this is not fully indicative of the widespread use of Fitts'
model since there exists a large body of research in fields such as
medicine, sports, and human factors which is published in journals,
books, and conference proceedings not surveyed in the SSCI.
This chapter contains four sections, each with a distinct purpose. We
begin with a somewhat cursory tour of the huge body of research
employing Fitts' law in experimental psychology. This will establish the
tremendous generality of the law. Second, results are presented of a
re-analysis of the law comparing the Fitts and Shannon formulations for
ID. The re-analysis is based on data sets from published Fitts'
law research. Third, we focus on several studies and provide an in-depth
analysis of the application of Fitts' law in the fields of human factors
and human-computer interaction. The analysis highlights the diverse
practices employed by researchers in designing experiments and reporting
results. As illustrated, these make across-study comparisons difficult
because subtle but significant differences are often present. Finally,
we examine in detail the study by Gillan et al. (1990), which, at
present, is the only application of Fitts' law to dragging tasks.
4.1 The Generality of Fitts' Law
Building upon Fitts' evidence that the rate of human information
processing (IP) is constant across a range of task difficulties,
other researchers adopted the model to determine IP in settings
far removed from Fitts' original theme. It is evident in reviewing the
literature that the factors introduced often confound the problem of
measurement; numerous studies report vastly different measures for very
similar processes.
In a study very similar to Fitts' initial report, Fitts and Peterson
(1964) measured IP for a "discrete" task in which subjects
responded to a stimulus light and tapped a target on the left or right
(see Figure 12).
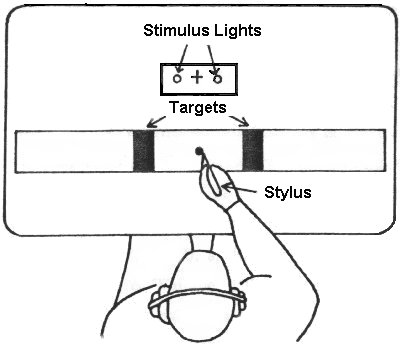
Figure 12. The discrete paradigm for movement tasks (after Fitts
&
Peterson, 1964)
In comparison to IP = 10.6 bits/s for "serial" or reciprocal
tapping tasks (Fitts, 1954), a rate of 13.5 bits/s was found for
discrete tasks (after factoring out reaction time). It is interesting
that a difference of 2.9 bits/s surfaced for two tasks which are
essentially the same, except for the serial vs. discrete nature of the
movements. Others have also found a higher IP for discrete tasks
over serial tasks (Megaw, 1975; Sugden, 1980). Keele (1968) suggests
that discrete tasks may yield a higher IP because they exclude
time-on-target, unlike serial tasks.
The role of visual feedback in controlling the accuracy of movement
has been the topic of many experiments using Fitts' law (e.g., Carlton,
1981; Crossman, 1960; Glencross & Barrett, 1983; Keele & Posner,
1968; Kvalseth, 1977; Meyer et al., 1988; Wallace & Newell, 1983).
The usual method is to cut off visual feedback a period of time after a
movement begins and compare the period of feedback deprivation with
changes in accuracy, movement time, or IP. It has been found that
movements under approximately 200 ms are ballistic and not controlled by
visual feedback mechanisms while those over 200 ms are.
Fitts' law has performed well for a variety of limb and muscle
groups. High correlations appear in studies of wrist flexion and
rotation (Crossman & Goodeve, 1983; Wright & Meyer, 1983; Meyer
et al., 1988), finger manipulation (Langolf et al., 1976), foot tapping
(Drury, 1975), arm extension (B. A. Kerr & Langolf, 1977), head
movement (Andres & Hartung, 1989a, 1989b; Jagacinski & Monk,
1985), and microscopic movements (W. M. Hancock, Langolf, & Clark,
1973; Langolf & W. M. Hancock, 1975). Underwater experiments have
provided a platform for further verification of the model (R. Kerr,
1973; R. Kerr, 1978), as have experiments with mentally retarded
patients (Wade, Newell, & Wallace, 1978), patients with Parkinson's
disease (Flowers, 1976) or cerebral palsy (Bravo, LeGare, Cook, &
Hussey, 1990), the young (Jones, 1989; B. Kerr, 1975; Salmoni, 1983;
Salmoni & McIlwain, 1979; Sugden, 1980; Wallace et al., 1978), and
the aged (Welford et al., 1969). An across species study verified the
model in the movements of monkeys (Brooks, 1979). It has been suggested
that the model would hold for the mouth or any other organ for which the
necessary degrees of freedom exist and for which a suitable motor task
could be devised (Glencross & Barrett, 1989).
Tabulating the results from these reports reveals a tremendous range
of performance indices, from less than 1 bit/s (Hartzell, Dunbar,
Beveridge, & Cortilla, 1983; Kvalseth, 1977) to over 60 bits/s
(Kvalseth, 1981b). Most studies report IP in the range of 3 to 12
bits/s.
4.2 Re-analysis of Published Data
An extensive search of Fitts' law publications was conducted to find
summary data that could be re-analysed to compare the Fitts, Welford,
and Shannon formulations. Most published research provides results in
the form of regression equations, correlations, and/or scatter plots.
Summary measures of mean movement times and error rates charted for each
A-W condition – as provided by Fitts (see Table 1) –
are generally not published.
Of several hundred publications visited, fourteen were found to
contain
one or more data sets suitable for re-analysis. The data sets were
manually
converted to machine readable format and were subjected to a correlation
analysis of movement time (MT) with each formulation for
ID.
With only one exception, the Welford formulation yielded a correlation
between
that obtained using the Fitts and Shannon formulations; therefore the
significance test for the difference between the correlations was
applied
only to the Fitts vs. Shannon combination. The results are shown in
Table 4.
Table 4
Re-analysis of Published Data Comparing the Fitts and Shannon
Formulation
1st Author
and year a
| Data
set b
| ID Range c
| Correlations by Model
| Higher
| Hotelling's t test
|
| Low
| High
| Fitts
| Shannon
| Inter-Model
| t
| n
| p
|
| Andres, 1989
| a
| 2.0
| 5.6
| .9661
| .9757
| .9986
| Shannon
| 2.81
| 9
| .05
|
| b
| 2.0
| 5.6
| .9767
| .9789
| .9986
| Shannon
| 0.49
| 9
| -
|
| t
| 2.0
| 5.6
| .9762
| .9822
| .9986
| Shannon
| 1.66
| 9
| -
|
| Annett, 1958
| a
| 4.0
| 10.0
| .9887
| .9871
| .9999
| Fitts
| 1.07
| 4
| -
|
| b
| 4.0
| 10.0
| .9980
| .9974
| .9999
| Fitts
| 0.74
| 4
| -
|
| c
| 4.0
| 10.0
| .9933
| .9919
| .9999
| Fitts
| 1.62
| 4
| -
|
| t
| 4.0
| 10.0
| .8909
| .8852
| .9999
| Fitts
| 1.87
| 4
| -
|
| Drury, 1975
|
| 0.9
| 3.3
| .9602
| .9749
| .9971
| Shannon
| 3.74
| 12
| .01
|
| Gan,1988
|
| 1.0
| 6.0
| .8113
| .8359
| .9964
| Shannon
| 3.62
| 40
| .001
|
| Glencross, 1983
| a
| 1.0
| 6.6
| .9737
| .9871
| .9965
| Shannon
| 5.39
| 16
| .01
|
| b
| 1.0
| 6.6
| .7850
| .7795
| .9965
| Fitts
| 0.38
| 16
| -
|
| Kerr, 1973
| a
| 3.6
| 7.2
| .9926
| .9926
| .9998
| Fitts
| 0.05
| 9
| -
|
| b
| 3.6
| 7.2
| .9869
| .9878
| .9998
| Shannon
| 0.69
| 9
| -
|
| t
| 3.6
| 7.2
| .9944
| .9949
| .9998
| Shannon
| 0.57
| 9
| -
|
| Kerr,1977a
|
| 3.0
| 7.3
| .6859
| .6865
| .9997
| Shannon
| 0.11
| 16
| -
|
| Kerr, 1978
| a
| 2.7
| 8.0
| .9974
| .9959
| .9994
| Fitts
| 1.64
| 9
| -
|
| b
| 2.7
| 8.0
| .9884
| .9871
| .9994
| Fitts
| 0.59
| 9
| -
|
| Kerr, 1977b
|
| 3.0
| 7.3
| .9622
| .9650
| .9997
| Shannon
| 1.63
| 16
| -
|
| Kvalseth, 1976
|
| 1.6
| 6.6
| .9870
| .9861
| .9979
| Fitts
| 0.26
| 12
| -
|
| Kvalseth, 1977
|
| 2.6
| 7.6
| .6353
| .6313
| .9993
| Fitts
| 0.43
| 12
| -
|
| MacKenzie, 1987
|
| 2.6
| 7.6
| .9792
| .9822
| .9993
| Shannon
| 1.40
| 12
| -
|
| Marteniuk, 1987
| a
| 2.0
| 5.6
| .9809
| .9877
| .9986
| Shannon
| 0.33
| 4
| -
|
| b
| 3.3
| 5.53
| .8545
| .8557
| .9997
| Shannon
| 0.10
| 4
| -
|
| Sugden, 1980
| a
| 2.0
| 5.6
| .9809
| .9877
| .9986
| Shannon
| 2.24
| 7
| -
|
| b
| 3.0
| 5.6
| .9889
| .9859
| .9997
| Fitts
| 1.84
| 6
| -
|
a see Appendix A for data sets and complete references
b a, b, c = data set; t = aggregate data
c computed using Fitts' formulation
d two-tailed text, df = n - 3
|
Of the 25 data sets (rows) in Table 4, the MT-ID correlation
was higher 14 times using the Shannon formulation vs. the Fitts
formulation. Of these, the difference between the correlations was
statistically significant at the p < .05 level (or better)
four times. Of the eleven data sets in which the Fitts formulation
correlated higher, statistical significance was never achieved.
It is worthwhile examining the range of task conditions employed. As
noted earlier, the models differ dramatically only when task conditions
include low values of ID (see Figure 3). The mean of the low
values for ID (third column in the table) is 2.7 bits. Of the
cases in which the Fitts or Shannon correlations were higher, the means
were 3.0 bits and 2.4 bits respectively. Thus, the anticipated trend of
higher correlations using the Shannon model appearing when experimental
conditions include low extremes of task ID is present in the
table.
The difference in the correlations in the experiment by Gan and
Hoffmann (1988) achieved significance at the p < .001 level.
This is largely due to the range of conditions employed. A and
ID were considered independent variables (as opposed to A
and W, as typical) and were varied over 4 and 10 levels each.
(The W value was adjusted as necessary to meet the desired levels
for ID across each level of A.) ID levels were 1,
1.5, 2, 2.5, 3, 3.5, 4, 4.5, 5, and 6 bits; thus, there were four
conditions of ID = 1 bit, four conditions of ID = 1.5
bits, and so on. Since low values of ID were well represented, it
is not surprising that a dramatic difference between the models
(t = 3.62, df = 37, p < .001) surfaced in this
experiment.
In summary, the re-analysis of published data presented in Table 4
provides further support that the Shannon formulation is empirically
superior to the Fitts formulation, although the improvement is
slight.
4.3 Human Factors and Human-Computer Interaction
Despite the large body of research evaluating the performance of
computer input devices for a variety of user tasks, the discipline of
human-computer interaction has not, as a rule, been a proving ground for
Fitts' law performance models. Most related HCI research uses "task
completion time" as the unit of study, with errors or other measures
reported in separate analyses. Two-factor repeated measures experiments
with several levels each for "task" and "device" are the norm (e.g.,
Albert, 1982; Buxton & Myers, 1986; English, Engelbart, &
Berman, 1967; Ewing, Mehrabanzad, Sheck, Ostroff, & Shneiderman,
1986; Goodwin, 1975; Gould, Lewis, & Barnes, 1985; Haller,
Mutschler, & Voss, 1984; Karat, McDonald, & Anderson, 1984; Mehr
& Mehr, 1972; Sperling & Tullis, 1988). See Greenstein and
Arnaut (1988), Milner (1988), or Thomas and Milan (1987) for reviews of
this body of research.
Six Fitts' law studies have been selected as relevant to the present
discussion. These are surveyed in reference list order, focusing
initially on the methodology and empirical results. An assessment of the
findings within and across studies is deferred to the end.
4.3.1 Card, English, and Burr, 1978
This highly cited work stands apart from other investigations by
nature of its goal to transcend the simplistic ranking of devices, and
to develop "models" useful for subsequent device evaluations. The idea
is that once a model is derived, it can participate in subsequent
designs by predicting performance in different scenarios before design
is begun.
Selection time, error rates, and learning time were measured in a
routine text selection task using four devices: a mouse, an isometric
joystick, step keys, and text keys. The step keys moved the cursor up,
down, left, or right in the usual way, whereas the text keys advanced
the cursor on character, word, or paragraph boundaries. The joystick
controlled the velocity and direction of the cursor from the magnitude
and direction of the applied force, with negligible displacement of the
stick.
For each trial, subjects pressed the space bar, "homed" their hand on
the cursor-control device, advanced the cursor to a word highlighted in
a block of text, then selected the word by pressing a button or key.
Experimental factors were device (four levels), distance to target
(A = 1, 2, 4, 8, & 16 cm), target size (W = 1, 2, 4,
& 10 characters; 1 character = 0.246 cm), approach angle
(0-22.5° , 22.5-67.5° , & 67.5-90° ),
and trial block. IDs ranged from -0.14 bits (A = 1 cm,
W = 10 characters) to 6.0 bits (A = 10 cm, W = 1
character). (The negative index is discussed later.) Target height was
held constant at 0.456 cm, the height of each character.
Using Welford's variation of Fitts' law, prediction equations were
derived for the two continuous devices. The least-squares regression
equation predicting movement time (ms) for the mouse was
with IP = 10.4 bits/s (r = .91, SE = 70 ms), and
for the joystick,
with IP = 4.5 bits/s (r = .94, SE = 130 ms).
Mean movement time was lowest for the mouse (1660 ms, SD = 480
ms) despite the fact that mean homing time was highest (360 ms,
SD = 130 ms). The joystick was a close second (MT = 1830
ms, SD = 570 ms), followed by the text keys (MT = 2260 ms,
SD = 1700 ms) and step keys (MT = 2510 ms, SD =
1640 ms).
Error rates ranged from 5% for the mouse to 13% for the step keys.
Approach angle did not affect mean movement time for the mouse, but
increased movement time by 3% for the joystick when approaching a target
along the diagonal axis.
4.3.2 Drury, 1975
Welford's variation of Fitts' law was evaluated as a performance
model in a study of foot pedal design. Using their preferred foot,
subjects tapped back and forth between two pedals for 15 cycles (30
taps). Six different amplitudes (A = 150, 225, 300, 375, 525,
& 675 mm) were crossed with two pedal sizes (W = 25 & 50
mm). The mean width of subjects' shoes (108.8 mm) was added to target
width as a reasonable adjustment since any portion of a shoe touching
the target was recorded as a hit. As such, IDs ranged from 0.53
to 2.47 bits. With A = 150 mm and W = 50 + 108.8 = 158.8
mm, the task difficulty was calculated as
log2(150.0 / 158.8 + 0.5) = 0.53 bits. This is an
extremely relevant example of a task condition in which an index of
difficulty less than 1 bit is perfectly reasonable. In effect, the
targets were overlapping.
The correlation between MT and ID was high (r =
.970, p < .01) with regression line coefficients of 187 ms for
the intercept and 85 ms/bit for the slope (IP = 11.8 bits/s).
Overall error rates were not reported; but blocks with more than one
miss were repeated. Thus, by design the error rate was less than
3.3%.
4.3.3 Epps, 1986
Six cursor control devices were compared in a target selection task
with performance models derived using Fitts' law, a power model
(Equation 13), and the following first-order model proposed by
Jagacinski, Repperger, Ward, and Moran (1980):
|
|
MT = a + b × A + c ×
(1 / W − 1).
|
(19)
|
Device types included two touchpads (relative & displacement), a
trackball, two joysticks (displacement & force; both
velocity-control), and a mouse. For each trial subjects moved a
cross-hair tracker to a randomly positioned rectangular target and
selected the target by pressing a button. Target distance varied across
four levels (A = 2, 4, 8, & 16 cm) and target size across
five levels (W = 0.13, 0.27, 0.54, 1.07, & 2.14 cm), yielding
IDs from 0.90 to 6.94 bits.
The power model provided the highest (multiple) correlation with
MT across all devices, with the first-order model providing
higher correlations for some devices but not others. The correlations
throughout were low, however, in comparison to those usually found.
Using Fitts' equation,
r ranged from .70 for the relative touchpad to .93 for
the trackball. Intercepts varied from -587 ms (force
joystick) to 282 ms (trackball). The values for IP,
ranging from 1.1 bits/s (displacement joystick) to 2.9
bits/s (trackball), are among the lowest to appear in
Fitts' law experiments.
If an error was committed, subjects had to reposition the cursor
inside the target and press the select button again. Although the
frequency of this behaviour was not noted, presumably these trials were
entered using the total time for the operation.
4.3.4 Jagacinski and Monk, 1985
Fitts' law was applied to a target acquisition task using a
displacement joystick for position control and a head-mounted sight
using two rotating infrared beams. Each trial began with the cursor in
the middle of the display and the appearance of a circular target on the
screen. Subjects moved the cursor to the target and selected it.
On-target dwell time (344 ms), rather than a button push, was the
criterion for target selection.
Experimental factors were device (two levels), target distance
(A = 2.45, 4.28, & 7.50 degrees of visual angle),
target size (W = 0.30, 0.52, & 0.92 degrees for the
joystick; W = 0.40, 0.70, & 1.22 degrees for the
helmet-mounted sight), and approach angle (0, 45, 90, 135,
180, 225, 270, & 315 degrees). Task difficulties ranged
from 2.0 to 5.6 bits for the helmet-mounted sight. Correlations
between MT and ID were very high (r = .99)
for both devices with regression coefficients for the intercept
of −268 ms (helmet-mounted sight) and −303 ms (joystick).
The regression line slope for both devices was 199 ms/bit
(IP = 5 bits/s). Mean movement times were slightly
longer along the diagonal axes for the joystick (7.2%) and for
the helmet-mounted sight (9.1%). Since the selection criterion
was dwell time inside the target, errors could not occur.
4.3.5 Kantowitz and Elvers, 1988
Fitts' law was evaluated as a performance model for two isometric
joysticks, one for cursor position control, the other for cursor
velocity control. Each trial began with the appearance of a square
target in the centre of the screen and an asterisk pre-cursor on either
side which tracked the applied force of the joystick. When the
pre-cursor changed to a cross-hair cursor, the subject moved it to the
target and selected the target. A trial terminated after one of the
following: the cursor remained stationary (±3
pixels) for 333 ms, the horizontal direction of movement changed, or 4 s
elapsed timeout. Experimental factors were device (two levels), target
distance (A = 170, 226, & 339 pixels), target size (W
= 20 & 30 pixels), and C-D gain (high & low). Four target
distance/size combinations were chosen with IDs from 3.5 to 5.5
bits.
The velocity-control joystick regression line had a steeper slope,
and therefore a lower IP, than for the position-control joystick
(IP = 2.2 bits/s vs 3.4 bits/s). There was no main effect for C-D
gain; for each device, the high and low gain regression lines were
parallel. The intercepts, however, were large and negative. Under high
gain and low gain conditions respectively, intercepts were −328
and −447 ms under position control and −846 and −880
ms under velocity control. Correlations ranged from .62 to .85. The
average error rate was very high (around 25%), although figures were not
provided across factors.
4.3.6 Ware and Mikaelian, 1987
Welford's variation of Fitts' law was applied to positioning data
from a selection task using an eye tracker (Gulf and Western series
1900). A cross-hair cursor positioned on a CRT display was controlled by
the reflection from subjects' cornea of an infrared source. Targets were
selected by three methods: a hardware button, dwell time on target (400
ms), and an on-screen button. Seven rectangles (3.2 by 2.6 cm) were
presented to the subjects in a vertical row. After fixating on the
centre rectangle for 0.5 s, one of the seven became highlighted,
whereupon subjects immediately fixated on it and selected it.
The application of Fitts' law in this study is weak. Target size was
kept constant (2.6 cm) while distance was varied over four levels (0,
2.6, 5.2, & 7.8 cm). Although IDs ranged from −1.0 bit
to 1.8 bits, no rationale was provided for the negative index at
A = 0 cm, calculated as
log2(0 / 2.6 + 0.5) = −1 bit. Correlations
and regression coefficients were omitted in lieu of a scatter plot of
MT vs. ID with regression lines for each selection
technique. For the purpose of this survey, equations were inferred from
the plots. Intercepts ranged from 680 to 790 ms and slopes ranged from
73 to 107 ms/bit. The highest IP was for the hardware button
condition (13.7 bits/s) and the lowest was for dwell time (9.3
bits/s).
Error rates were high, ranging from 8.5% (hardware button) to 22%
(on-screen button). As the investigators noted, an eye-tracker can
provide fast cursor positioning and target selection, as long as
accuracy demands are minimal.
4.4 Across-Study Comparison of Performance Measures
We now proceed with the task of assessing the findings and
comparing them across studies.
Table 5 shows for each device condition the regression coefficients,
the MT-ID correlation, and the percentage errors. Both the
slope and IP are provided for convenience, as are the values
from Fitts' (1954) tapping experiment with a 1 oz stylus (see Table 2).
The entries are ordered by decreasing IP. This is not the same
as ordering by increasing movement time since the intercepts also
contribute to MT. It is felt that IP is more indicative
of the overall performance of a device and that normalizing the
intercepts is reasonable for this comparison.
Table 5
Comparison of Performance Measures From Several Fitts' Law Studies
| Device
| 1st Author
& Year
| Regression Coefficients a
| r
| Errors
(%)
| Comments
|
Intercept,
a (ms)
| Slope, b
(ms/bit)
| IP
(bits/s)
|
| Eye Trackerb
| Ware, 1987
| 680
| 73
| 13.7
| -
| 8.5
| Hardware button
|
| Foot Pedal
| Drury, 1975
| 187
| 85
| 11.8
| .97
| <3.3
| Experiment 2
|
| Hand c
| Fitts, 1954
| 12.8
| 94.7
| 10.6
| .98
| 1.8
| Tapping, 1oz
|
| Mouse
| Card, 1978
| 1030
| 96
| 10.4
| .91
| 5
|
|
| Eye Tracker b
| Ware, 1987
| 790
| 97
| 10.3
| -
| 22
| On-screen button
|
| Eye Tracker b
| Ware, 1987
| 680
| 107
| 9.3
| -
| 12
| Dwell time
|
| Helmet Sight
| Jagacinski, 1985
| −268
| 199
| 5.0
| .99
| 0
|
|
| Joystick
| Jagacinski, 1987
| −303
| 199
| 5.0
| .99
| 0
| Isometric, position control
|
| Joystick
| Card, 1978
| 990
| 220
| 4.5
| .94
| 12
| Isometric, velocity control
|
| Joystick
| Kantowitz, 1988
| −328
| 297
| 3.4
| .62
| 25
| Isometric, position, high gain
|
| Joystick
| Kantowitz, 1988
| −447
| 297
| 3.4
| .76
| 25
| Isometric, position, low gain
|
| Trackball
| Epps, 1986
| 282
| 347
| 2.9
| .93
| 0
|
|
| Mouse
| Epps, 1986
| 108
| 392
| 2.6
| .83
| 0
|
|
| Touchpad
| Epps, 1986
| 181
| 434
| 2.3
| .74
| 0
| Absolute positioning
|
| Joystick
| Kantowitz, 1988
| −846
| 449
| 2.2
| .84
| 25
| Isometric, velocity, high gain
|
| Joystick
| Kantowitz, 1988
| −880
| 449
| 2.2
| .85
| 25
| Isometric, velocity, low gain
|
| Touchpad
| Epps, 1988
| −194
| 609
| 1.6
| .70
| 0
| Relative positioning
|
| Joystick
| Epps, 1986
| −587
| 861
| 1.2
| .81
| 0
| Isometric, velocity control
|
| Joystick
| Epps, 1986
| −560
| 919
| 1.1
| .86
| 0
| Displacement, velocity control
|
a MT = a + b ID ; MT is movement time,
ID is index of difficulty, IP is index of performance (IP = 1 / b)
b data inferred from plot
c provided for comparison pursposes only
|
The presence of nine negative intercepts in Table 5 is the first sign
of trouble. A negative intercept implies that, as tasks get easier, a
point is reached where the predicted movement time is negative. This, of
course, is nonsense and indicates a flaw in the application of the model
or the presence of uncontrolled variations in the data. Beyond this, the
most notable observation is the overall lack of consensus in the
measures. The spread of values is astonishing: Performance indices
ranged from 1.1 to 13.7 bits/s, intercepts ranged from -880 to 1030 ms.
Are these a true reflection of innate differences in the devices?
Probably not. Although differences are expected across devices, similar
measures should emerge in the table where different entries are for the
same device.
For example, the mouse was evaluated by Card et al. (1978) and Epps
(1986). The former cite IP
= 10.4 bits/s while the latter cites IP = 2.6 bits/s. These
values differ by a factor of four! Also, the intercepts differ by 922
ms. So, what is the Fitts' law prediction equation for the mouse? The
answer is up for debate.
Also, an isometric, velocity-control joystick was tested by Card et
al. (1978), Epps (1986), and Kantowitz and Elvers (1988). Again, the
outcome is disturbing. In the order just cited, the intercepts were
reported as 990, −587, and 863 ms (average), and IP was
reported as 4.5, 1.2, and 2.2 bits/s. It seems the goal cited earlier
— to develop models for evaluating devices and interaction
techniques prior to implementation — remains elusive.
4.5 Sources of Variation
We can attempt to reconcile the differences by searching out the
major sources of variation. Indeed, some of these are nascent traits of
direct manipulation systems (rather than quirks in methodology), and,
therefore, are particularly pertinent to the context of human-computer
interaction. Identifying these provides a basis for evaluating and
comparing studies. When disparities emerge it may be possible to adjust
measures or to predict comparative outcomes under hypothetical
circumstances.
4.5.1 Device Differences
If the research goal is to establish a Fitts' law (or other)
performance model for two or more input devices, then the only source of
variation that is desirable is the between-device differences. This is
what the investigations are attempting to measure. Accomplishing this
assumes, somewhat unrealistically, that all other sources of variation
are removed or are controlled for. Of course, very few studies are
solely interested in device differences. "Sources of variation" become
"factors" in many studies — equally as important to the research
as model-fitting across devices.
We can cope with the disparity in Table 5 by looking for across-study
agreement on within-study ranking rather than comparing absolute
measures. The mice and velocity-control isometric joysticks evaluated by
Card et al. (1978) and Epps (1986) provide a simple example. The index
of performance was higher for the mouse than for the joystick within
each study. One could conclude, therefore, that the mouse is a better
performer (using IP as the criterion) than the joystick, even
though the absolute values are deceiving. (Note that the joystick in
Card et al.'s study yielded a higher IP than the mouse in Epps'
study.) Furthermore, the differences between devices expressed as a
ratio was about the same: IP was higher for the mouse than for
the joystick by a factor of
10.4 / 4.5 = 2.3 in Card et al.'s (1978) study and by a factor
of
2.6 / 1.2 = 2.2 in Epps' (1986) study.
Just as the units disappear when the ratio of the performance indices
is formed, so too may systematic effects from other sources of
variation, including a myriad of unknown or uncontrolled factors present
in an experiment. Indeed, "experiment" differences are evident in Table
5: Epps' (1986) and Kantowitz and Elvers' (1988) studies have "low"
values for IP; Card et al.'s (1978) and Drury's (1975) studies
have "high" values. Thus, relative differences within studies gain
strength if across-study consensus can be found.
A larger sample of studies would no doubt reveal within-study
consensus on other performance differences. The performance increment
found in Kantowitz and Elvers' (1988) study for the position-control
joystick over the velocity-control joystick, to cite one example, was
noted in another study not in the survey (Jagacinski, Repperger, Moran,
Ward, and Glass, 1980).
We should acknowledge as performance determinants the range of muscle
and limb groups engaged by different manipulanda. Since smaller limb
groups (e.g., wrist vs. arm) have shown higher ratings for IP
(Langolf et al., 1976), performance increments are reasonable when
complex arm movements are avoided. With fewer degrees of freedom for the
head or eyes than for the arm, the relatively high rates for the eye
tracker and helmet-mounted sight in Table 5 may be warranted. This does
not, however, account for the high ranking of the foot pedals.
It is felt that Fitts' law performance differences can be attributed
to other characteristics of devices, such as number of spatial
dimensions sensed (1, 2, or 3), or property sensed (pressure, motion, or
position); however, our sample is too small to form a basis for
generalization. Besides, the studies surveyed may contain stronger
sources of variation.
4.5.2 Task Differences
It is naive, perhaps, to suggest that there exists a generic task
which can accommodate simple adjustments for other factors, such as
"device". One might argue that Fitts' tapping task is remote and
inappropriate: It is not a particularly common example of user
interaction with computers. Its one dimensional simplicity, however, has
advantages for model building, not the least of which is access to a
substantial body of research. For example, there is evidence that a
serial task yields an index of performance 2 to 3 bits/s lower than a
similar discrete task (e.g., Fitts & Peterson, 1964). Discrete tasks
may be more akin to direct manipulation systems, but experiments are
easier to design and conduct using a serial task. Knowledge of a 2 to 3
bit per second increment for discrete operation after conducting a
serial task experiment is a valuable resource for researchers.
Of the six studies surveyed, all but one used a discrete task.
Drury's (1975) serial foot tapping experiment yielded IP = 11.8
bits/s, but may have shown a rate around 14 bits/s had a discrete task
been used. Although this would tend to disperse further the rates in
Table 5, indices in the 15 to 20 bits/s range are not uncommon in Fitts'
law studies.
Five of the six studies used a simple target capture task while one,
Card et al. (1978), used a text selection task. The cognitive load on
subjects may have been higher in the latter case due to the presence of
additional text on the screen. Perhaps the burden of finding and keeping
track of highlighted text within a full screen of text continued
throughout the move. This "task difference" would reduce performance but
one can only speculate on where the effect would appear. The evidence
leans toward the intercept since they were highest in this study (1030
& 990 ms).
4.5.3 Selection Technique
The method of terminating tasks deserves separate analysis from other
aspects of tasks. In the studies by Card et al. (1978) and Epps (1986),
the target selection button for all devices except the mouse was
operated with the opposite hand. Ware and Mikaelian (1987) also used a
separate hand-operated button as one of the selection conditions with
the eye tracker. There is evidence that task completion times are
reduced when a task is split over two hands (e.g., Buxton & Myers,
1986), suggesting that parallel cognitive strategies may emerge when
positioning and selecting are delegated to separate limbs. This may
explain the trackball's higher IP over the mouse in Epps' (1986)
experiment –
the mouse task was one-handed, the trackball task was two-handed.
Unfortunately, this speculation does not extend to Card et al.'s (1978)
study where IP was significantly higher for the mouse
(one-handed) than for the joystick (two-handed).
Conversely, and as mentioned earlier, target selection time may be
additive in the model, contributing to the intercept of the regression
line, but not to the slope. This argument has some support in Epps'
(1986) study where the intercept is second highest out of five for the
mouse. Both the mouse and the joystick yielded similar intercepts in
Card et al.'s (1978) study, thus lending no support either way.
There are presently versions of each device that permit manipulation
and target selection with the same limb. Therefore, a "devices" by "mode
of selection" experiment could examine these effects on the intercept
and slope in the prediction equation. In fact, mode of selection was a
factor in Ware and Mikaelian's (1987) study. Based on this study, one
would conclude that IP increases when selection is delegated to a
separated limb (as it did for the hardware button condition vs. the
dwell time or on-screen button conditions; see Table 5).
4.5.4 Range of Conditions and Choice of Model
In Fitts' (1954) tapping experiments, subjects were tested over four
levels each for target amplitude and target width with the lowest value
for target amplitude equal to the highest value for target width (see
Table 1). In all, subjects were exposed to sixteen A-W conditions
with IDs from 1 to 7 bits. Table 6 shows the range of target
conditions employed in the studies surveyed.
Table 6
Range of Conditions Employed in Several Fitts' Law
Studies
1st Author
& Year
| Amplitudes
(high/low)
| Widths
(high/low)
| Number of
Conditions
| Index of Difficulty (bits)
|
| Low
| High
| Range
|
| Card, 1976 a
| 1, 2, 4, 8, 16 cm (16)
| 1, 2, 4, 10 char. b (10)
| 20
| −0.14
| 6.03
| 6.18
|
| Drury, 1975 a
| 150, 225, 300, 375, 525,
675 mm (4.5)
| 133.8, 158.8 mm (1.2)
| 12
| 0.53
| 2.47
| 1.94
|
| Epps, 1986
| 2, 4, 8, 16 cm (8)
| 0.13, 0.27, 0.54, 1.07, 2.14 cm (16)
| 9
| 0.90
| 6.94
| 6.04
|
| Jagacinski, 1985
| 2.45, 4.28, 7.50 degrees (3.1)
| 0.30, 0.52, 0.92° visual angle
for joystick (3.1)
| 9
| 2.41
| 5.64
| 3.22
|
0.40, 0.70, 1.22° visual angle
for helmet (3.1)
| 9
| 2.01
| 5.23
| 3.22
|
| Kantowitz, 1988
| 170, 226, 339, 453 pixels (2.7)
| 20, 30, pixels (1.5)
| 4
| 3.50
| 5.50
| 2.00
|
| Ware, 1987 a
| 0, 2.6, 5.2, 7.8 cm (-)
| 2.6 cm (1)
| 4
| −1.00
| 1.80
| 2.80
|
| Fitts, 1954 c
| 2, 4, 8, 16 in. (8)
| 0.25, 0.5, 1, 2 in. (8)
| 16
| 1.00
| 7.00
| 6.00
|
a Welford formulation used for calculation of ID (see Equation 8)
b 1 character = 0.246 cm
c from Fitts (1954); included for comparison purposes only
|
Some stark comparisons are found in Table 6. Kantowitz and Elvers (1988)
and Ware and Mikaelian (1987) limited testing to four A-W
conditions over a very narrow range of IDs (2.00 bits and 2.80
bits, respectively). Although Drury (1975) used 12 A-W
conditions, the range of IDs was only 1.94 bits. This resulted
because the spreads for A and W were small. Despite using
6 levels for A, the ratio of the highest value to the lowest
value was only 4.5, and the same ratio for W was only 1.2. (When
a scatter plot is limited to a very narrow range, one can imagine a line
through the points tilting to and fro with a somewhat unstable slope!)
The narrow range of IDs in Kantowitz and Elvers' (1988) study,
combined with the observation that the lowest ID was very high
(3.50 bits), could explain the large negative intercepts. (After
travelling 3.5 bits to the origin, a line swivelling about a narrow
cluster of points could severely miss its mark!) Note that the predicted
movement time when ID = 1 bit with Kantowitz and Elvers' (1988)
velocity-control joystick under low-gain conditions is 449(1) −
880 = −431 ms. Although ID = 1 bit is not unreasonable
(e.g., see Table 1), a negative prediction for movement time is. Had
this experiment included a wider range of IDs, extending down to
around 1 bit, no doubt the regression line intercepts would be higher
and the slopes would be lower.
Card et al. (1978) and Epps (1986) used a reasonable number of
conditions (20 & 9, respectively) over a wide range of task
difficulties (6.18 & 6.04 bits). These represent a strong complement
of conditions which should yield results bearing close scrutiny.
Although a non-zero intercept can be rationalized a variety of ways,
the studies by Card et al. (1978) and Ware and Mikaelian (1987) present
a special problem. In these, IDs < 0 bits represent conditions
that actually occurred; thus, it is certain that an appreciable positive
intercept results. A contributing factor in the Card et al. (1978) study
is the confounding approach angle (discussed below). In both studies,
however, the negative IDs would disappear simply by using
Shannon's formulation for ID (Equation 9). This would reduce the
regression line intercepts because the origin would occur left of the
tested range of IDs (where it should) rather than in the
middle.
It is also possible that Fitts' law is simply the wrong model in some
instances. Card et al. (1978) noted in the scatter plot for the joystick
a series of parallel lines for each target amplitude condition.
Certainly, this is not predicted in the model: A and W
play equal but inverse roles; and, at a given ID, only random
effects should differentiate the outcomes. Noting the systematic effect
of amplitude, separate prediction equations were devised for each value
of A. The result was a series of parallel regression lines with
slopes around 100 ms/bit (IP = 10 bit/s) and with intercepts
falling as A decreased. With this adjustment, the joystick and
mouse IPs were about the same. However, this is a peculiar
situation for the model – in essence, target amplitude ceases to
participate.
The range of conditions also bears heavily on the coefficient of
correlation. Although r is extremely useful for comparisons
within a study, across-study comparisons are all but impossible unless
the conditions are the same. As noted earlier, correlations are
uncharacteristically low when a sample is drawn from a restricted range
in a population. This could explain the relatively low correlations in
Table 5 for Kantowitz and Elvers' (1988) study.
The extent of data aggregation also affects r. In the vast
majority of Fitts' law studies, movement times are averaged across
subjects and a single data point is entered into the analysis for each
A-W condition. Epps (1986) did not average across subjects and
entered 240 data points into the analysis (12 subjects × 5
amplitudes
× 4 widths). The extra variation introduced may be the cause of
the relatively low correlations in this study.
4.5.5 Approach Angle and Target Width
In the Card et al. (1978) study the use of approach angle as an
experimental factor in conjunction with the consistent use of wide,
short targets (viz., words) provides the opportunity to address directly
a theoretical point raised earlier: What is "target width" when the
approach angle varies?
When target distance was 1 cm and target width was 10 characters
(2.46 cm), the index of difficulty was calculated in this study using
Welford's formulation as log2(A / W + 0.5) =
log2(1 / 2.46 + 0.5) = −0.14 bits. This troublesome
value, although not explicitly cited, appeared in the scatter plot of
MT vs. ID (Figure 6, p. 609). Since character height was
0.456 cm, a better measure of ID may have been log2(1
/ 0.456 + 0.5) = 1.43 bits. With a slope of 96 ms/bit for the mouse
regression line, this disparity in IDs increases the intercept by
as much as (1.43 − (−0.14)) × 96 = 151 ms. The
contribution could be even more in a regression analysis using We since
adjusting target width generally increases the regression line slope and
increases ID for easy tasks (cf. Figure 2 & Figure 5).
Thus, the negative IDs and the very large intercepts in the
Card et al. (1978) study are at least partially attributable to the
one-dimensional limitations in the model and to the use of a formulation
for ID which allows for a negative index of task difficulty. As
the investigators noted, however, the time spent in grasping the device
at the beginning of a move and the time for the final button-push were
also contributing factors.
Epps (1986) and Jagacinski and Monk (1985) also varied approach
angle. Since the targets were squares or circles, however, there is no
obvious implication to the calculation of task difficulty or to the
regression coefficients.
4.5.6 Error Handling
Response variability (viz., errors) is an integral part of rapid,
aimed movements. Unfortunately, the role of "accuracy" is often
neglected in the application of Fitts' law. Jagacinski (1989) notes the
following:
It is difficult to reach any conclusions when one system has exhibited
faster target acquisitions, but has done so with less accuracy in
comparison with another system. Both systems might have the same
speed-accuracy function, and the experimental evaluation might have
simply sampled different
points along this common function. (p. 139)
A simple way out of this dilemma is to build the model using the
effective target width (We) in the calculation of
ID. The adjustment normalizes target width for a nominal error
rate of 4%, as described earlier. However, none of the studies surveyed
included the adjustment. Unfortunately, post hoc adjustments cannot be
pursued at this time because error rates across levels of A and
W were not reported. Although speculation is avoided on possible
adjustments to the regression coefficients, it is instructive to review
the strategies adopted for error handling.
Card et al. (1978) excluded error trials from the data analysis.
Drury (1975) included error blocks in the data analysis provided at most
1 miss in 30 trials was committed. Although Kantowitz and Elvers (1988)
and Ware and Mikaelian (1987) reported very high error rates (up to
25%), it was not stated if error trials were included in the regression
analyses. Presumably they were.
In Kantowitz and Elvers' (1988) study, subjects were not allowed to
reverse the horizontal direction of movement. If a reversal was detected
the trial immediately terminated and a miss was recorded if the cursor
was outside the target. This precludes potential accuracy adjustments at
the end of a trial, which, no doubt, would increase movement time.
Jagacinski and Monk (1985) and Epps (1986) introduced selection
criteria whereby errors could not occur — a trial continued until
the target was captured. If the cursor was outside the target when the
select button was pressed, subjects in Epps' (1986) study repositioned
the cursor and re-selected the target. Although the frequency was not
reported, the inclusion of trials exhibiting such behaviour is most
unusual.
4.5.7 Learning Effects
Learning effects are a nagging, ubiquitous source of variation
in experiments that seek to evaluate "expert" behaviour. Often
research pragmatics prevent practicing subjects up to expert
status. Fortunately though, Fitts' serial or discrete paradigm
is extremely simple and good performance levels are readily
achieved. Of the six studies surveyed, three made no attempt
to accommodate learning effects. Of those that did, each used
a different criterion to establish when asymptotic, or expert,
levels were reached. The most accepted statistical tool for
this is a multiple comparisons test (e.g., Newman-Keuls,
Scheffé, Tukey) on mean scores over multiple sessions of
testing (Glass & Hopkins, 1984, chap. 17).
Only Epps (1986) included such a test. Although the design was fully
within-subjects, only two hours of testing were needed for each subject.
This was sufficient to cross all levels of device (six), session (five),
amplitude (four), and width (five). Subjects were novices and were given
only two repetitions of each experimental condition; yet a multiple
comparisons test (Bonferroni's t test; see Glass and Hopkins,
1984, p. 381) showed no improvement overall or for any device after the
second session. The data analysis was based on sessions three to
five.
Jagacinski and Monk (1985), who practiced subjects for up to 29 days,
used the criterion of four successive days with the block means on each
day within 3.5% of the four-day mean. Card et al. (1978) developed a
similar criterion based on a t test.
4.5.8 Summary
Other potential sources of variation abound. These include the
instructions to subjects, the number of repetitions per condition, the
order of administering devices, the sensitivity of device transducers,
the resolution and sampling rate of the measuring system, the update
rate of the output display, and control-display gain. However, our
analysis will not extend further. The discussions on error handling and
learning effects highlighted the vastly different strategies employed by
researchers; but speculating on the effect of these in the model is
digressive. These and other sources are felt to introduce considerable
variation, but with effects which are, for the most part, random.
Systematic effects may be slight, unanticipated, or peculiar to one
design.
The range of conditions selected at the experimental design stage is
a major source of variation in results. Experiments can benefit by
adopting a wide and representative range of A-W conditions (e.g.,
1 to 7 bits; see Table 1). This done, the investigators can proceed to
build valid information processing models when other factors such as
"device" or "task" are added. Adopting the Fitts paradigm for serial
tasks (Figure 1) or discrete tasks (Figure 12) offers the benefit of a
simple experimental setup and invites access to a large body of past
research.
Experiments that vary approach angle and use rectangular or
other "long and narrow" targets can avoid the problem of negative
task difficulty by using the Shannon formulation of Fitts' law
(Equation 9, Figure 3) and/or adopting a new notion of target
width in the calculation of ID (Figure 7). Extending
the model to accommodate varying approach angles and target
shapes is one area in need of further research, particularly
in light of the two-dimensional nature of user input tasks
on computers.
The variety of schemes to terminate tasks and select or acquire a
target undoubtedly affects the outcome of a regression analysis. There
are reasonable grounds for expecting a distinct, additive component to
appear in the intercept; however, evidence is scant and inconclusive.
Further research is needed.
A major deficiency in the application of Fitts' law in general is the
absence of a sound and consistent technique for dealing with errors.
Although not demonstrated in any of the studies surveyed, the model can
be strengthened using the effective target width in calculating
ID (Figure 4). Doing so normalizes response variability (viz.,
errors) for a nominal error rate of 4%. This theoretically sound (and
arguably vital) adjustment delivers consistency and facilitates
across-study comparisons. The adjustment can proceed using the error
rate or the standard deviation in end-point coordinates, as shown
earlier.
Experiments are strengthened by practicing subjects until a
reasonable criterion for expert performance is met. The three studies
that tested for learning effects did so using mean movement times. It
may be more appropriate, however, to also test subjects' "rate of
information processing" (viz., IP) as a criterion variable. This
test could be strengthened using We in the calculation
of ID (see Table 1) to accommodate both the speed and accuracy of
performance. The direct method of calculating IP (viz., IP
= ID / MT ; see Table 1) is easier and probably better since
it nulls the intercept, blending the effects into IP. This would
accommodate separate, distinct learning effects for the intercept which
would be unaccounted for if IP = 1 / b (from a regression
analysis) is used.
The prediction equations in the Fitts' law studies surveyed reveal
large inconsistencies, making it difficult to summarize and offer de
facto standard prediction equations for any of the devices tested.
Despite high correlations (usually taken as evidence of a model's
worth), the failings in across-study comparisons demonstrate that
extracting a Fitts' law prediction equation out of a research paper and
embedding it in a design tool may be premature as yet.
4.6 Fitts' Law in Dragging Tasks
The study by Gillan et al. (1990) is at present the only study to
extend Fitts' law to dragging tasks and to explore alternative measures
for target width. Since the results are of particular relevance to the
present research, a separate, detailed review is warranted.
Two experiments were described, both employing the same task but
under slightly different conditions. Two tasks were employed:
point-select and point-drag-select. In the point-select task, subjects
moved the cursor to a block of highlighted text and selected it by
pressing and releasing the mouse button. In the point-drag-select task,
subjects selected the left character in a block of text with a
button-down action, then "dragged" through to the right-most character
and terminated the move with a button-up action. Factors in the first
experiment were task (two levels), distance to target (A = 2, 7,
5, & 13,75 cm), and width of target (W = 1, 5, 14, & 26
characters; 1 character ≈ 0.25 cm). The height of targets was
held constant at 0.5 cm, the height of each character. Although each of
the four diagonal angles was used as a direction of movement, approach
angle was not analysed as a factor. The intent in Gillan et al.'s (1990)
study was to establish the appropriate target width to use in models for
pointing tasks and dragging tasks.
Some unusual and puzzling views of the data were presented. For
example, in the point-drag-select task they built a Fitts' law model
with pointing time as the predicted variable and Welford's ID as
the controlled variable. ID was calculated using pointing
distance as A and dragging distance as W. This is
counter-intuitive. Since pointing ends when dragging begins, there is no
reasonable ground to expect dragging distance to serve as W in a
model for pointing time. It is not surprising that the model yielded a
very low r of .50 (p. 230).
Nevertheless, there are some valuable results found in this study. In
the point-select task, a "status quo" Fitts' law model was compared with
a variation that replaced target width with the constant 0.5 cm,
corresponding to the height of words. Using Welford's formulation they
found
|
|
MT = 795 + 83 log2(A / W + 0.5) ms
|
(20)
|
with r = .75 using the status quo model, and
|
|
MT = 497 + 180 log2(A / 0.5 + 0.5) ms
|
(21)
|
with r = .94 using a constant for target width (p. 230).
Initially, it appears odd that the model with an extra free variable was
outperformed by the model substituting a constant (r = .75 vs.
r = .94); but this is perfectly reasonable both in a statistical
sense and in a pragmatic sense. Statistically, if A and W
were separate variables participating in a multiple regression model, it
is certain that W, as a free variable (with its own regression
coefficient), would improve the correlation of the model in comparison
to a model substituting a constant for W. However, this is not
the case with Fitts' law since A and W combine to form
Fitts' index of difficulty in a one-variable regression model. Each
variable taken alone does not necessarily improve the correlation of the
model.
In a pragmatic sense, the lower correlation found using the status
quo model is better understood by examining
Figure 13, taken from Gillan et al.'s (1990) report (p. 229). For each
amplitude condition, pointing time was longer for the W = 1
character = 0.25 cm condition than for the W = 5, 14, or 26
character conditions. However, there was no apparent change in movement
time over the larger three target width conditions. This, of course, is
not predicted in Fitts' model. A higher r would have resulted for
the status quo model only if decreases in movement time were found as
W increased, as consistent with the relative roles of W
and A in Fitts' index of difficulty.
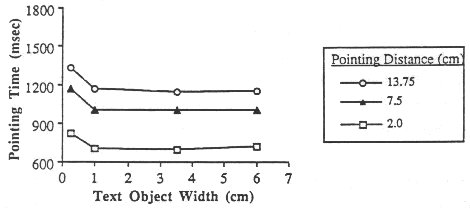
Figure 13. Pointing time vs. A and W (from Gillan
et al., 1990)
The improved correlation found when substituting a constant equal to
the height of the characters lends support to the "smaller-of" theory
mentioned earlier (see p. 29). Since words are short and wide, the
height of the words may be a more appropriate measure of the precision
requirement of the task, and may better serve the role of target width
in the model. Furthermore, had a smaller-of model been used in Gillan et
al.'s (1990) analysis, target width would have been assigned the value
0.25 cm (the width of a single character) when W = 1 character
and the value 0.5 cm (the height of characters) when W = 5, 14,
and 26 characters. The extra time taken to select single-character
targets (see Figure 13), in conjunction with the similarity in times to
select the 5, 14, and 26 character targets, raises the possibility that
the smaller-of model might have outperformed the model using W =
0.5 cm for all target widths.
Gillan et al. (1990) did build a model for the dragging operations
(although it is mentioned in a subordinate way and not featured in their
tables). They found movement time (ms) during dragging was well
expressed (r = .99) by
|
|
MT = 684 + 328 log2(A / 0.5 + 0.5),
|
(22)
|
which suggests an information processing rate of IP = 3.0
bit/s. (The variable A in this model corresponds to the dragging
distance.) The constant 0.5 cm was again substituted for target width.
Since the height of characters is measured perpendicular to the line of
motion in dragging tasks, the substitution is of questionable merit. The
width of a single character (0.25 cm), corresponding to the width of the
region where the terminating button- up action occurred, may be a better
choice.
Since substituting a constant equal to the height of words for target
width served well in the first experiment, Gillan et al. (1990) varied
the height of words in the next experiment. Factors were task, pointing
distance (A = 2.5, 7.0, & 11.75 cm), target width (W =
1.0, 3.5, & 6.0 cm), and target height (H = 0.4, 0.5, &
1.2 cm). Again, the direction of movement varied but was not included in
the analysis.
For the point-drag-select task, two models for dragging time were
tested, one using the constant 0.5 cm for target width, and one using
H for target width. In the former case, movement time (ms) while
dragging was predicted as
|
|
MT = 594 + 349 log2(A / 0.5 + 0.5)
|
(23)
|
with r = .77. This is similar to the result from the first
experiment, suggesting an information processing rate around 3 bits/s
during dragging. The correlation was higher in the latter case, however,
yielding
|
|
MT = 611 + 383 log2(A / H + 0.5)
|
(24)
|
with r = .98. Considering the argument just presented (that
the width of the terminating character in a drag operation is a better
substitute for target width), the improved correlation is fully expected
because character width was positively correlated with character height.
Characters with heights of 0.4, 0.5, and 1.2 cm had widths of 0.17,
0.21, and 0.51 cm respectively.
For the point-select tasks, four models were tested in an effort to
explore further the nature of target width in Fitts' model when targets
are words. The status quo model was tested, as was a model substituting
the target height for W. It was also conjectured that the "border
of the text object closest to the start" (p. 231) might also be a
reasonable substitute for target width; and so, W+H was entered
as a candidate model. The area of the target, W×H, was also
tested. In order of correlations, the models yielded the following
prediction equations for movement time (ms):
| Width |
Prediction Equation |
Correlation |
| H |
MT = 742 + 179 log2(A / H + 0.5) |
.93 |
| W+H |
MT = 1185 + 128 log2(A / (W + H) + 0.5) |
.62 |
| W×H |
MT = 1347 + 169 log2(A / (W × H) + 0.5) |
.61 |
| Status quo |
MT = 1216 + 179 log2(A / W + 0.5) |
.46 |
The results above are consistent with the smaller-of theory in that
the model substituting H for W had no conditions in which
the target was narrower than it was high (unlike the first experiment
for W = 1 character). Surprising, however, is the extremely poor
showing of the status quo model. An r as low as .46 is very rare
in Fitts' law research. Besides, the conditions used in this experiment
were very similar to those in the text selection task used by Card et
al. (1978), who obtained r = .91 with the same model.