1. Select Zentral Limit Demonstration from the main menu.
2. Choose the total Number of Samples you want the computer to randomly select (a number between 1,000 and 10,000).
3. Choose the Sample Size - the number of observations that you want the computer to select for each sample (a number between 1 and 40).
4. Choose the population from which the computer draws its samples (normal, uniform, triangular or v-shaped).
5. Choose OK and the computer will build the distribution of z scores. Before the computer adds a point to the distribution, it shows you the sample values that contribute to each mean, and the transformation of each mean into a z score. Pressing the number keys 1 - 9 will cause a delay of from 1 /10 to 8 seconds , respectively, for each sample. If you press the 0 (zero) key, the demonstration will finish as fast as possible. Pressing the Escape key will abort the demonstration. When the End key is pressed, the computer displays a dialog box, "Pause Again?", and pauses until any key is pressed or 'YES' or 'NO' is clicked -- If 'YES' was clicked or the End key was pressed again, the computer pauses again.
Your selections will be displayed in the top corners of the window, the sample values that contribute to each mean and the transformation of each mean into a z score will appear at the bottom of the screen, and the Distribution of Z Scores will begin to form. If you have selected a sample size between 1 and 10, then, for each sample, the computer displays the values that it has randomly selected as well as their mean and z score. For sample sizes greater than 10 only the mean is displayed. When the distribution of z scores is complete, the computer superimposes an idealized normal curve onto it.
Try generating several z-score distributions by varying the number of samples that goes into each. (Make one with 1,000 samples, one with 10,000 samples, and a couple of distributions using a number of samples that falls between those two amounts.) You will see that the greater the number of samples, the better the shape of the resulting distribution approximates a normal one. (The computer limits you to 10,000 samples.)
The Shape of the Distribution of Z Scores, and the Importance of Sample Size
Like the distribution of sample means (in Central Limit Demonstration), the shape of the distribution of z is dependent on 3 things: the shape of the population from which the samples are drawn, the number of samples, and the size of the samples. You have varied the number of samples in the above demonstration, now let's systematically vary the other two factors.
1. Choose a small sample size (n=2), and construct a distribution of z for each of the parent populations (normal, uniform, v-shaped, and triangular) with this sample size. Choose a sufficiently large number of samples for each distribution as well, and hold it constant for each distribution (say, number of samples = 5,000).
2. Let's use the v-shaped population to demonstrate approximation to normal with larger sample sizes. Construct 4 distributions of z by a) selecting the v-shaped population as the population from which to draw the samples each time, b) keep the number of samples constant in each distribution (5,000), and c) vary the sample size for each distribution. Make your first distribution with sample size = 2, then another with sample size = 10, a third with sample size = 30, and finally, make a distribution of z scores with sample size = 40.
You should see that increasing the sample size to 10 dramatically improves the approximation to a normal shape for the distribution of z. A sample size of 30 is somewhat better, and there is little improvement in the approximation to normal with a larger sample size of 40, i.e., a sample size of 30 is sufficient for a distribution of z scores to approach a normal shape. Try this with the other non-normal distributions as well: a sample size of 30 is sufficient for approximation to normal regardless of the shape of the distribution from which the samples are drawn.
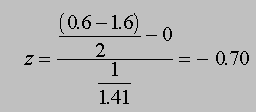
This should seem somewhat familiar, as we have visited a similar distribution in the Central Limit Demonstration. In the Central Limit Demonstration, we plotted the means of samples of a particular size (n) drawn from a particular population. Here, we're doing exactly the same thing with one exception: before being plotted in a new distribution, each mean is being transformed into a standard score (z) which is a statistic that represents how far (in standard deviation units) each mean is from the original population mean. Z is equal to the sample mean minus the population mean (mu), divided by the standard error of the distribution of sample means. So for example, if the original population mean = 0, and the standard deviation = 1, and we draw a sample of 2 numbers from this population (0.6 and -1.6), then
This means that the mean of these two numbers in our random sample (-.5) is .70 standard deviation units below the original mean of 0.
Our original population mean and standard deviation don't have to be 0 and 1. We could draw the same values for example, from a population with a mu of -6.0 and a standard deviation of 3. In this case, the sample mean (-.5) would be 2.6 standard deviations above the population mean of -6.0:

For the Distribution of Z, we aren't just transforming a single mean into a z score, we're transforming all means, from as many samples as pratical of a given size, from a given population, into z scores.