 Adapted from Wright &
Pitt, 1934
Adapted from Wright &
Pitt, 1934Wavelength Discrimination
 Adapted from Wright &
Pitt, 1934

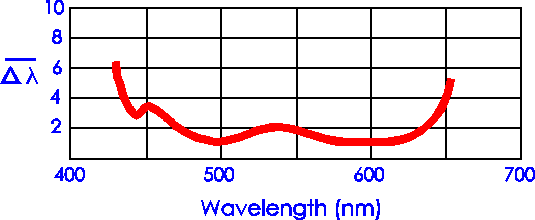
The above graph shows the minimum difference between two wavelengths (delta lambda)
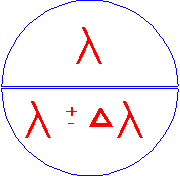
that can just be discriminated. The figure on the left shows the field of view seen
by the observer. The top half of the hemifield contains the reference
wavelength. The observer adjusts the wavelength of the bottom half, which is equal in
brightness to the top until it is just noticeably different from the top half. The
wavelength in the bottom is reduced (-) half of the time and increased (+) half of the
time to make these just noticeable difference adjustments.
The delta lambda with the bar over it in the graph represents the average of the
increase and decrease wavelength difference that is just noticeable. Notice that near 500
nm and 600 nm observers can detect wavelength differences of about 1 nm. Near the ends of
the
spectrum the top and bottom halves of the field need to be about 6 nm apart to be just
noticeably different.
These data are appropriate to the conditions under which they were collected. The field 2 degrees and the retinal illuminance about 70 trolands. Bedford and Wyszecki cited in COLOR SCIENCE by Wyszecki and Stiles, 1982, showed that changing the retinal luminance and visual angle of the stimulus changes the function. The major changes are in vertical shifts.
Table of Contents
Subject Index