7. SUMMARY AND CONCLUSIONS
This research has examined the theory, prediction power and relevance of Fitts' law, citing its limitations and suggesting improvements. Three experiments were conducted to test the improvements and to explore the model's performance under different device and task conditions.
The research hypotheses are summarized below, followed by a brief statement of the outcome. The major findings are expanded on in the concluding remarks which follow.
H1: Correlation between MT and ID is independent of model (Fitts, Welford, or Shannon) for index of difficulty.
REJECTED. There is substantial evidence that the formulations differ. In particular, the Shannon formulation performs significantly better than the Fitts formulation (when tasks with ID < 3 bits are included).
H2: Correlation between MT and ID is the same using ID calculated from the effective target width (in 1-D or 2-D) rather than the specified target width.
NOT REJECTED. The use of the effective target width did not yield consistently higher or lower correlations than the specified target width. (There are, however, other benefits in using We. See below.)
H3: MT is independent of approach angle.
H4: Error rate is independent of approach angle.
REJECTED. Movement times and error rates increase by about 4% when approaching on the diagonal axis compared to the horizontal or vertical axis.
H5: Correlation between MT and ID is independent of several methods of calculating W in the index of difficulty.
REJECTED. The method of calculating target width has significant effect on the model's performance when movements are two-dimensional.
H6: Movement time is independent of device or task.
H7: Error rate is independent of device or task.
H8: Index of performance is independent of device or task.
REJECTED. Movement time, error rate, and the index of performance are all affected by the choice of device or task.
H9: Point-drag-select tasks can be modeled as two separate Fitts' law tasks.
NOT REJECTED. When modeling a point-drag-select sequence as two separate Fitts' law tasks, correlations were very high for both tasks.
7.1 The Shannon Formulation
The Shannon formulation for the index of difficulty (ID = log2(A / W + 1)) was introduced accompanied by the claim that it is both theoretically and empirically superior to Fitts' formulation. Theoretical benefits were cited on the basis that the new formulation is a direct copy of Shannon's Theorem 17, substituting target amplitude for signal power and target width for noise power. This is the analogy that Fitts intended; however, his formulation was based on an approximation of Shannon's theorem – an approximation useful only when the signal-to-noise ratio is high. The analogous amplitude-to-width ratio turns out to be quite small in many movement tasks, however.
Three empirical tests were undertaken to compare the prediction power of the Fitts, Welford, and Shannon formulations. The first was a re-analysis of the four data sets in Fitts' (1954) original publication. The MT-ID correlation was higher using the Shannon formulation vs. the Fitts formulation in all four instances, with statistical significance in the difference appearing twice. The data sets not yielding a significant difference were unique in two ways: First, the tasks were highly feedback regulated without the potential for errors; and second, the "easy" tasks did not have sufficiently low amplitude-to-width ratios to distinguish the two formulations. (The Welford formulation consistently yielded correlations between those for the Fitts and Shannon formulations; therefore, comparisons were reported only between the latter two formulations.)
The second analysis used 25 data sets from other published Fitts' law research. The correlation was higher 14 times using the Shannon formulation, 11 times using Fitts' formulation. While statistical significance was never achieved in favour of the Fitts' formulation, four data sets showed significant differences favouring the Shannon formulation. A recurring pattern was evident: A significant difference surfaces only when experimental conditions include easy tasks, with amplitude-to-width ratios under about 4:1 (or ID < 3 bits, using Fitts' formulation).
Finally, the first experiment described herein crossed three devices with two tasks, thus providing six data sets for further comparisons. Each data set was analysed using both the specified target width (W) and the effective target width (We) in the calculation of ID. The Shannon formulation yielded a higher MT-ID correlation in all twelve instances; however statistical significance in the difference appeared only twice.
Taken together, the three analyses provide substantial evidence of the improved fit using the Shannon formulation. Although the practical benefits of a small (albeit significant) improvement are slight, the new formulation has another benefit which is important in the context of performance modeling: The index of difficulty cannot be negative. Both the Fitts and Welford formulations yield a negative ID for small A:W ratios (see below). A negative rating for task difficulty is difficult to interpret, and is arguably a weakness in present applications of the model. Instances from published research were cited where ID was negative. A re-calculation using the Shannon formulation was shown to produce a positive rating.
7.2 Target Width
Another goal of the present research was to derive a practical extension to Fitts' law for selecting rectangular targets when the approach angle varies. Such two-dimensional tasks present a special problem – identifying the "width" of targets. By a "status quo" model, the horizontal extent of the target is the width, regardless of the approach angle. This is consistent with the model's original and inherent one-dimensionality, and with most applications of the model.
In the second experiment, two alternative interpretations of target width performed significantly better than the status quo view when selecting rectangular targets from angles of 0° , 45° , and 90° . The first substituted for target width the span of the target along an approach vector through the target's centre (the W' model). The second substituted for W the smaller of the target's width or height (the smaller-of model).
Although the W' model is felt to be theoretically superior (because it retains the model's one-dimensionality), it is more difficult to apply since predictions require four parameters: amplitude, width, height, and approach angle.
The smaller-of model, on the other hand, is applied without considering the approach angle. The theoretical basis for the smaller-of model is weak, however. It is based on the intuitive notion that a task's precision requirement is set by the smaller of the two target dimensions, width or height.
The status quo model is the easiest to apply (because predictions are based only on A and W); however, the model is demonstrably weak in some instances. In text selection tasks, for example, when a short-and-wide target (such as a word or group of words) is selected from close range, the status quo model was shown to produce unrealistically low estimates of ID. (If Fitts' formulation is used, ID is sometimes negative, even though the distance to the target may be appreciable.)
The smaller-of model should be of practical value in applications of Fitts' law to interactive computer systems. Predictions are based only on A, W, and H. Nevertheless, the W' model holds the distinction of being the closest to the original model. In particular, when non-rectangular targets are used or when movements and targets are three-dimensional, the W' model should perform quite well.
7.3 Normalizing for Spatial Variability
The technique described by Welford (1968) was demonstrated for adjusting target width based on the spatial variability of subjects' responses, for a nominal error rate of 4%. The adjustment yields an "effective target width", or We. Models derived from normalized data are claimed to improve the validity of performance comparisons across experimental factors. In the first experiment, the mouse, tablet-with-stylus, and trackball were tested on pointing and dragging tasks. Normalized data produced different results than un-normalized data (e.g., the rank order of devices changed on the index of performance criterion).
A survey of six Fitts' law studies showed a great variety of performance measures across factors such as device, task, and selection technique. Comparative evaluations are difficult to undertake when faced with such disparities, and several methodological factors were cited as contributing to the problem. A key factor is the inconsistent treatment of errors. Most experimental procedures do not guide subjects to a specific and consistent error rate; so performance comparisons are of questionable worth in the absence of adjustments. Although the effective target width is rarely used, it can assist in building valid Fitts' law performance models.
7.4 Device and Task Differences
Fitts' law models were derived for the mouse, tablet-with-stylus, and trackball for serial pointing and dragging tasks. The MT-ID correlations were very high (r > .9800) and the standard error of estimates were very low (SE < 80 ms) for all combinations except for the trackball during dragging (r = .9226, SE = 190 ms).
Performance comparisons across device-task conditions commonly use Fitts' index of performance (in bits/s) as the criterion variable; however, it was demonstrated that IP measures are sensitive to the method of calculation. The most representative ratings, taken alone, are felt to be those obtained using the direct method (IP = ID/MT) rather than linear regression (IP = 1/b), although the two are similar when the regression line intercept is small. Furthermore, ID should be calculated using the Shannon formulation and the effective target width.
Using the above method for calculating IP, significant main effects and interactions were found for the device and task factors. The mouse and tablet-with-stylus performed similarly during pointing (5.6 bits/s vs. 5.7 bits/ s respectively); however, during dragging, a significantly lower rating emerged for the mouse (3.5 bits/s) than for the tablet-with-stylus (4.0 bits/s). The trackball was a poor performer for both pointing (3.2 bits/s) and dragging (2.1 bits/s). These results suggest that the tablet-with-stylus may be preferable to the mouse in interactive systems employing State 1 (pointing) and State 2 (dragging) actions. The trackball's performance is poor for both tasks.
In the third experiment, Fitts' law was tested on a compound task of pointing followed by dragging. Three approach angles (0° , 45° , & 90° ) were used for the pointing phase of the task, followed by a left-to-right dragging operation. High correlations (r > .9600) were obtained using a smaller-of model for pointing (2-D) and a status quo model for dragging (1-D). This result, along with those from the first experiment, support the claim that State 1 and State 2 actions follow Fitts' law, whether the tasks occur individually or as a State 1 action followed by a State 2 action.
7.5 Serial vs. Discrete Tasks
The Fitts' law models derived in the first experiment were for serial pointing and dragging tasks, while those derived in the second and third experiments were for discrete tasks. The subsequent application of a serial model to discrete tasks, no doubt, presents some problems.
Although discrete tasks have been found to yield higher IPs than serial tasks, a better understanding of the difference is needed. If a consistent difference exists, this needs to be quantified under different conditions.
Each move in a serial task is probably anticipated and prepared for, to a certain extent, near the end of the previous move. This aspect of movement tasks could be investigated in an experiment with "sequence" (serial vs. discrete) as a factor. The procedure would be somewhat unusual since the serial trials would proceed in rapid succession while the discrete trials would be spaced out. Ten trials might take 10 seconds for a serial task, but may take a minute or two for a discrete task (including the time between trials). Nevertheless, evidence of specific and predictable effects may allow a discrete model to be built following a serial experiment (or vice versus).
7.6 Error Rate as a Parameter
The role of errors, or spatial variability, in Fitts' law needs closer examination. If the technique for normalizing responses is applied, the resulting model has an assumed error rate of 4%. In certain applications, however, an error rate of, say, 1% or 10% may be more appropriate. Accommodating error rate as a parameter would be a useful extension to the model.
Normalizing for spatial variability proceeds with the assumption of normality, multiplying the standard deviation in spatial responses by 4.133 to obtain We (see p. 19). It so happens that 4.133 × σ encompasses the central 96% of a normal distribution; hence, the 4% assumed error rate. Factors other than 4.133 could be used to derive prediction equations for other error rates. For example, with reference to a table of z-scores, 1% and 10% prediction equations would follow using the factors 5.15 and 3.29 respectively. This is a rough approach in need of testing. There may be deeper information-theoretic considerations warranting a more rigorous derivation.
7.7 Using Fitts' Law: An Example
One challenge in reporting on research such as this is relating the findings to real-world problems confronting practitioners in the field. Despite recognition as one of the more successful models for human movement, Fitts' law has not migrated from research labs into tools for optimizing human performance in interactive systems. The promise is there, but the tools are not. In this section, the practical potential for Fitts' law models is explored and a specific example is developed.
First, we must acknowledge when not to use Fitts' law. The law is a prediction model for rapid, aimed movements. A variety of user input activities do not fit this description, including drawing, inking, writing cursive script, and other temporally constrained tasks (see p. 31). Furthermore, some devices may be ill-suited to Fitts' law. Isometric joysticks are force sensing and undergo negligible motion. As a model for human movement, it seems odd to apply Fitts' law where no limb movement takes place. Card et al. (1978) found that performance data for an isometric joystick was poorly described by Fitts' law. After the data were decomposed by amplitude, however, the model fit well, yielding a series of parallel lines for each amplitude condition. Other devices, such as those for velocity control, may also display characteristics inappropriate for a Fitts' law model. For the more common pointing devices (such as the mouse, trackball, or stylus), and for common point-select or drag-select tasks, however, Fitts' law has the potential to assist in the design and evaluation of graphical user interfaces. Questions of the form "How long will this task take?" can be answered using Fitts' law prediction equations if certain conditions exist. If the tasks are rapidly executed with negligible mental preparation time, system response time, device homing time, etc., then there's a good chance Fitts' law can assist in evaluating alternative methods.
To illustrate, an example is offered. Consider the case of deleting a file (icon) on the Apple Macintosh computer. Three potential methods are listed below.
METHOD 1. Drag the icon to the trashcan. (This is the traditional method on the Macintosh.)
METHOD 2. Select the file icon with a point-select operation, then select the trashcan icon with a second point-select operation.
METHOD 3. Stroke through the icon. This method consists of a button-down action beside the file icon followed by dragging (stroking) through the icon and a button-up action on the opposite side of the icon.
The third method is an example of input which mimics a natural gesture in manuscript editing (Kurtenbach & Buxton, in press). A reasonable assumption for the stroking gesture is that the button-down operation occurs on the left of the icon in the centre of a region the same shape as the icon, and that the button-up action occurs similarly in a region on the right of the icon.
A possible screen layout is shown in Figure 26.
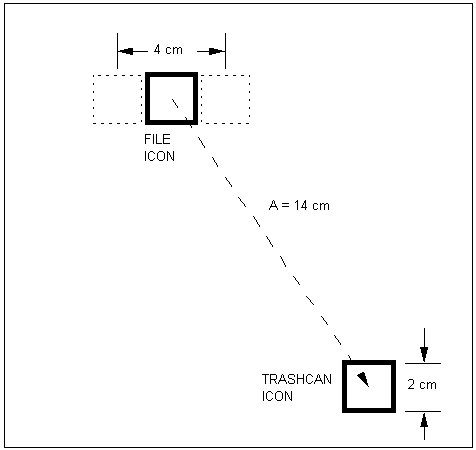
Figure 26. Screen layout for Fitts' law example
The trashcan icon is located at the bottom right corner of the screen. The file icon is placed in the middle of the screen at a distance of 14 cm from the trashcan. Both icons are 2 cm square. The button-down and button-up regions for the stroking gesture are shown in dotted lines. The calculations proceed using Equation 26 for pointing and Equation 25 for dragging (see Table 15). The pointing equation is used in Method 2, while the dragging equation is used in Methods 1 and 3. Note also that for Method 3, the amplitude is 4 cm, rather than 14 cm. Once the initial move to the icon is completed, the time to delete the icon using each method is calculated as follows:
METHOD 1 |
MT = a + b log2(A/W + 1) = 135 + 249 × log2(14/2 + 1) = 135 + 249 × 3 = 882 ms |
(drag-select) |
METHOD 2 |
MT = a + b log2(A/W + 1) = 230 + 166 × log2(14/2 + 1) = 230 + 166 × 3 = 728 ms |
(point-select) |
METHOD 3 |
MT = a + b log2(A/W + 1) = 135 + 249 × log2(4/2 + 1) = 135 + 249 × 1.58 = 528 ms |
(stroke-through) |
This result suggests, using a Fitts' law analysis, that the traditional method of deleting a file on the Macintosh is slower than two alternate methods. The example is simplistic, however. Other issues such as the methods for deleting multiple files or for un-deleting files must be considered too.
Even though the rate of information processing is lower during dragging than during pointing, the stroke-through method, which is a dragging operation, is faster than the point-select method. This is due to the combined effect of the intercepts in the prediction equations and the different movement amplitudes. Using the stroke-through method, the predicted MT is independent of the distance (A) between the file icon and the trashcan icon, since the movement amplitude is nominally set at twice the file icon's width. However, the predicted MT decreases with A for the point-select method. This suggests there may be a cross-over point below which the point-select method is faster. Knowledge of this may play a critical role in selecting an appropriate method. In the current example, the cross-over point is calculated by equating the predictions for Method 2 and Method 3 as follows:
238 + 166 × log2(A / 2 + 1) = 135 + 249 × log2(A / 2 + 1).
The cross-over point is found by solving for A. After a little effort, this yields A = 2.72 cm. So, the point-select method is faster than the stroke-through method only for A < 2.72 cm. Certainly, this is a minority of movement amplitudes that are likely to arise. Other possibilities could be explored too, such as increasing the size (W) of the trashcan icon relative to file icons. This example has demonstrated how Fitts' law models could be used by HCI practitioners in the design and evaluation of alternative implementations for a graphical user interface.
7.8 Future Directions
The ideas presented in this research reveal many aspects of Fitts' law that have not been implemented or tested in any significant way. Certainly more experimentation is required before a general Fitts' law performance model emerges that can participate in the design of optimal human-computer interfaces.
When issues such as those described above have been addressed, a small piece of the puzzle is in place. The models envisioned in the present study are of value only in the prediction of task completion time from a set of input conditions and task constraints. The models are valid but limited; they do not call into account numerous other parameters, such as system response time, mental preparation time for the user, homing time, selection rules for alternative methods, etc. These intermediate and high-level activities have been addressed in the Keystroke-Level Model and GOMS model of Card, Moran, and Newell (1980, 1983). In this study the focus has been modeling the low-level tasks of pointing and dragging.
In the hard science-soft science debate, Newell and Card (1985) hold that "striving to develop a theory that does task analysis by calculation is the key to hardening the science" (p. 237). Indeed, future applications of Fitts' law may include "embedded models" as an integral part of user interface design and management systems. The scenario envisioned goes something like this: A user interface is patched together in story-board fashion with a series of screens (with their associated soft buttons, pull-down menus, icons, etc.) and interconnecting links. The designer puts the embedded model into "analyze mode" and "works" the interface – positioning, drawing, selecting, and "doing" a series of typical operations. When finished, the embedded model furnishes a predicted minimum performance time for the task (or a range of times across error rates or other parameters). The designer moves, changes, or scales objects and screens and requests a re-analysis of the same task.
This is a rough first approximation of the possibilities. At a higher level, an embedded model is an "agent" in beta testing, monitoring activities and building a profile of performance measures. The profile catalogs a variety of facets of the interface. For example, a "locus of control" could identify frequently used screens. It follows that "tight links" are needed for high-use screens. Or, a high-use region on a display could be identified. In a word processing system, for example, depending on the implementation for scrolling, a user may spend more time working at the bottom of the display than at the top. Knowledge of this may imply that a menu bar should be placed close to the bottom of the display.
A more powerful embedded model performs sequence analysis. How long does it take to get from point A to point B through a series of intermediate steps? Or, of the alternate ways to get from point A to point B, which is the fastest? Hypermedia environments with embedded links facilitate such analyses, since an explicit and external state-transition description may not be needed. The agent acts on the screen definitions and links (as they exist in the application) in evaluating alternative or optimal paths.
An embedded model is obviously more than a software routine with Fitts' law built into it. System and user performance constants, similar to those in the Keystroke-Level Model, are needed. A parametric analysis could identify bottlenecks or optimal combinations. For example, decreasing pointing time by 10% vs. decreasing user keystroke time by 10% may have vastly different effects on overall task completion time. If a task can be accomplished two ways (e.g., 4 point-select operations vs. 20 keystrokes), which is the fastest? A parametric analysis could identify cross-over points across settings (as shown in the example in the previous section). The designer could establish ranges and weights for parameters, and an agent, armed with embedded models, would take it from there.
Fitts' law may have a role in user-adaptive systems – systems with a human-interface which changes in real time to accommodate a user's capabilities and limitations (Rouse, 1988). Control systems for air traffic, ground traffic, power generation or industrial processes are potential instances. One can imagine several human operators interacting with a complex system by manipulating iconic controls in response to system events. As system dynamics change, the demands on operators change. A Fitts' law model could assist in measuring the load on operators and predicting their performance. In safety-critical settings, Fitts' law could help assign each operator's work to maintain a desired sub-maximum level of performance.
Human-computer interaction has advanced by leaps and bounds in recent years. We can attribute this primarily to the improved interfaces advanced through the technologies of mouse input and bit-mapped graphic output. There is an ongoing and valuable need for the prediction and modeling of user activities within such environments. As human-machine dialogues evolve and become more "direct", the processes and limitations underlying man's ability to execute rapid, precise movements emerge as performance determinants in interactive systems. Powerful models such as Fitts' law can provide vital insight into strategies for optimizing performance in a diverse design space.