 (where
Fourier Optics: a study of diffraction patterns in the focal plane of a lens
This worksheet deals with the generation of diffraction patterns produced by various apertures illuminated by monochromatic light.
Following Smith-Thomson: Optics (2nd ed.), chapter 9, we use as a convenient variable
(where
![]() is the diffraction angle and
is the diffraction angle and
![]() the wavelength).
the wavelength).
For illustration purposes we begin with the Fraunhofer diffraction pattern for a pair of narrow slits displaced by
d
(Young's expt.). We use dimensionless quantities, and should use the displacements
d
which are larger than the wavelength
![]() . We can think of the length unit as being microns, in which case a typical (yellow) wavelength equals 1/2. The aperture width (or slit separation for Young's experiment) should be at least several microns.
. We can think of the length unit as being microns, in which case a typical (yellow) wavelength equals 1/2. The aperture width (or slit separation for Young's experiment) should be at least several microns.
> restart;
> lambda:=1/2;
![]()
> d:=100/4;
![]()
The amplitude as a function of the diffraction angle
![]() in radians:
in radians:
> Am:=theta->cos(Pi*d/lambda*sin(theta));
![]()
> plot(Am(theta)^2,theta=-Pi/50..Pi/50,numpoints=500);
![[Maple Plot]](images/FourierOptics9.gif)
Exercise 1:
Vary the length parameters (wavelength
![]() and slit separation
d
) and observe the change in the intesity pattern as a function of
and slit separation
d
) and observe the change in the intesity pattern as a function of
![]() which is measured in radians.
which is measured in radians.
We can look at the intensity pattern at larger angles:
> plot(Am(theta)^2,theta=Pi/4-Pi/50..Pi/4+Pi/50,numpoints=500);
![[Maple Plot]](images/FourierOptics12.gif)
The nonlinearity of the expression in theta becomes more apparent at even larger theta:
> plot(Am(theta)^2,theta=3*Pi/8-Pi/25..3*Pi/8+Pi/25,numpoints=500);
![[Maple Plot]](images/FourierOptics13.gif)
Diffraction gratings and Ronchi rulings
To observe diffraction patterns for gratings and Ronchi rulings we calculate the Fourier transform of the respective aperture functions. The distance parameter d plays the role of the spacing between the slits. For a diffraction grating the aperture function is smooth: a cos-squared behaviour of the transmissivity as a function of separation y across the aperture is produced (using holography in modern times) and the periodicity is controlled by d . Following eqns. (9.10-9.11) from the reference we calculate the amplitude first for a 'single' slit.
We set up the cos-squared profile such that the distance d contains the full width of a slit that includes the perfectly transmitting part up to the perfectly blocking parts on both sides (the zeroes of the cosine) at |y|=d/2
> d:='d';
![]()
> Af:=x->evalc(int(cos(Pi*y/d)^2*exp(I*2*Pi*x*y),y=-d/2..d/2));
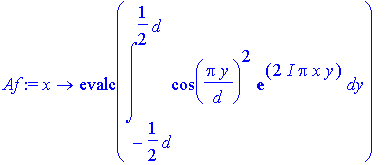
> Af(x);
Note the behaviour of the result at | x |=1/d: a 0/0 expression results as for x =0, however the 1/ x factor yields some suppression of the amplitude compared to x =0.
> plot(subs(d=10,Af(x)^2),x=-Pi/2..Pi/2);
![[Maple Plot]](images/FourierOptics17.gif)
It is useful to look at a logarithmic representation of the amplitude:
> plot(subs(d=10,log10(Af(x)^2)),x=-Pi/2..Pi/2,numpoints=500);
![[Maple Plot]](images/FourierOptics18.gif)
A log-plot can also be produced directly using the plots-package:
> with(plots):
Warning, the name changecoords has been redefined
> logplot(subs(d=10,Af(x)^2),x=-Pi/2..Pi/2,numpoints=500);
![[Maple Plot]](images/FourierOptics19.gif)
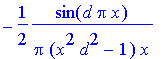
Nothing dramatic happened at | x |=1/ d . Now we add more slits gradually by extending the range of integration. First just one:
> Af1:=x->evalc(int(cos(Pi*y/d)^2*exp(I*2*Pi*x*y),y=-3*d/2..3*d/2));
> plot(subs(d=10,Af1(x)^2),x=-Pi/8..Pi/8,numpoints=500);
![[Maple Plot]](images/FourierOptics21.gif)
Observe how a strong pair of peaks appears at | x |=1/ d . This is shown below for d =20:
> plot(subs(d=20,log10(Af1(x)^2)),x=-0.3..0.3,-3..3,numpoints=1000);
![[Maple Plot]](images/FourierOptics22.gif)
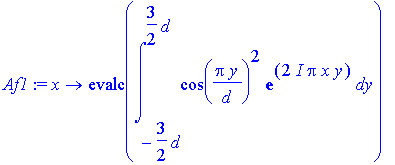
We are ready to calculate the result for an aperture with n cycles ('slits'):
> Afn:=(x,n)->evalc(int(cos(Pi*y/d)^2*exp(I*2*Pi*x*y),y=-n*d/2..n*d/2));
Observe that the intensity ratio between the central and side peaks is close to the value of 4:
> plot(subs(d=4,Afn(x,19)^2),x=-Pi/8..Pi/8,numpoints=500);
![[Maple Plot]](images/FourierOptics24.gif)
> plot(subs(d=10,Afn(x,19)^2),x=-Pi/8..Pi/8,numpoints=500);
![[Maple Plot]](images/FourierOptics25.gif)
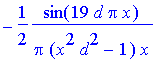
The special role played by | x |= 1/ d is evident from the analytical result:
> Afn(x,3);
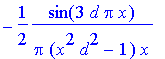
> Afn(x,9);
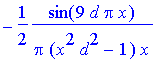
> Afn(x,19);
Now we set up the calculation for the Ronchi ruling (a set of equidistant black lines).
We choose d as the spacing of a line and a gap (the aperture).
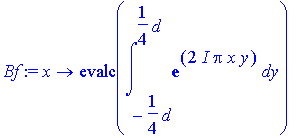
First the single slit. The aperture has a width of d /2 and is chosen to be symmetric around y =0.
> Bf:=x->evalc(int(exp(I*2*Pi*x*y),y=-d/4..d/4));
> plot(subs(d=10,Bf(x)^2),x=-Pi/2..Pi/2);
![[Maple Plot]](images/FourierOptics30.gif)
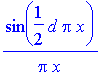
We found the intensity pattern for a single slit (cf. page 134):
> Bf(x);
To combine more steps we simply add more sections of the integral. The calculation is straightforward and can be done easily by hand!
A graph of the aperture function (showing the transmissivity):
> Step:=(a,b)->Heaviside(b-y)*Heaviside(y-a);
![]()
> plot(subs(d=1,Step(-5*d/4,-3*d/4)+Step(-d/4,d/4)+Step(3*d/4,5*d/4)),y=-7/4..7/4);
![[Maple Plot]](images/FourierOptics33.gif)
A straightforward implementation of the required integral:
> Bf1:=x->evalc(int((Step(-5*d/4,-3*d/4)+Step(-d/4,d/4)+Step(3*d/4,5*d/4))*exp(I*2*Pi*x*y),y=-5*d/4..5*d/4));
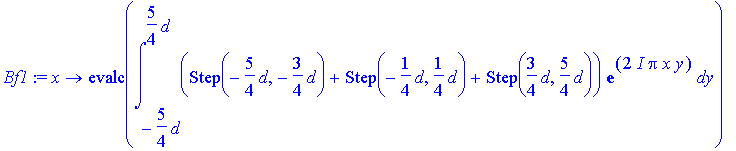
This integral is not worked out by Maple unless the following assumption is made:
> assume(d>0);
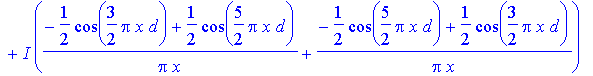
> Bf1(x);

We can also define a new function that performs the sum of required integrals.
> Bf1:=x->evalc(int(exp(I*2*Pi*x*y),y=-d/4..d/4)+int(exp(I*2*Pi*x*y),y=-5*d/4..-3*d/4)+int(exp(I*2*Pi*x*y),y=3*d/4..5*d/4));
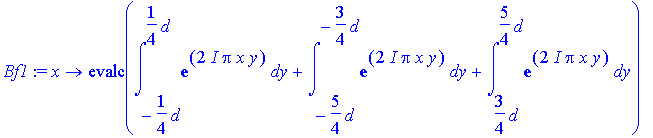
> Bf1(x);

> res:=evalc(subs(d=10,Bf1(x)^2));
![]()

> plot(log10(res),x=-Pi/4..Pi/4,numpoints=500);
![[Maple Plot]](images/FourierOptics41.gif)
Observe the dominant peaks: strong side peaks at | x |=1/ d , further strong ones at | x |=3/ d ,5/ d , etc. These are high Fourier components that result from the analysis of a step function. The change of the dominant side peak location from 2/ d to 1/ d compared to the cosine-squared transmission profile of the aperture is just a result of defining:
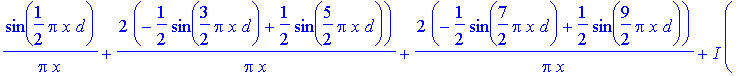
> Bfn:=(x,n)->evalc(int(exp(I*2*Pi*x*y),y=-d/4..d/4)+sum(int(exp(I*2*Pi*x*y),y=-(4*i+1)*d/4..-(4*i-1)*d/4),i=1..n)+sum(int(exp(I*2*Pi*x*y),y=(4*i-1)*d/4..(4*i+1)*d/4),i=1..n));
> Bfn(x,1);

> simplify(Bfn(x,1)-Bf1(x));
![]()
> Bfn(x,2);

> #Bfn(x,3);
> #Bfn(x,4);
> res:=evalc(subs(d=10,Bfn(x,2)^2));


> plot(log10(res),x=-0.6..0.6,-3..3,numpoints=500);
![[Maple Plot]](images/FourierOptics51.gif)
#n=3:
> plot(log10(evalc(subs(d=10,Bfn(x,3)^2))),x=-0.6..0.6,-3..3,numpoints=500);
![[Maple Plot]](images/FourierOptics52.gif)
> plot(log10(evalc(subs(d=10,Bfn(x,5)^2))),x=0..1.6,-3..4,numpoints=500);
![[Maple Plot]](images/FourierOptics53.gif)
Exercise 1:
Explore the pattern for different values of d .
The observed pattern for a Ronchi ruling shows spots of weak intensity interspersed in the above pattern. We investigate whether they are possibly caused by an asymmetry of the aperture function, i.e, that the spacing of the gaps (perfect transmission) is not identical to the thickness of the black lines.
We introduce slightly thicker lines:
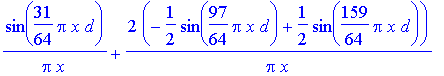
> Cfn:=(x,n)->evalc(int(exp(I*2*Pi*x*y),y=-d/4+d/128..d/4-d/128)+sum(int(exp(I*2*Pi*x*y),y=-(4*i+1)*d/4+d/128..-(4*i-1)*d/4-d/128),i=1..n)+sum(int(exp(I*2*Pi*x*y),y=(4*i-1)*d/4+d/128..(4*i+1)*d/4-d/128),i=1..n));
![]()
> Cfn(x,1);
> plot(log10(evalc(subs(d=10,Cfn(x,2)^2))),x=-0.8..0.8,-3..3,numpoints=500);
![[Maple Plot]](images/FourierOptics58.gif)
> plot(log10(evalc(subs(d=10,Cfn(x,5)^2))),x=0..1,-2..4,numpoints=500);
![[Maple Plot]](images/FourierOptics59.gif)
Thus, it is evident that small imperfections in the pattern (thickness of lines vs. gaps, but perfectly reproduced over 11 rulings in the above calculation) have a dramatic effect on the diffraction pattern.
One should keep in mind that illumination of Ronchi rulings and diffraction gratings by laser beams represents a the use of a grating with a finite number of aperture slits. The laser spot covers a finite area on the grating, which for a fine grating includes a large number of 'lines', but for a Ronchi ruling can represent a finite number.
Exercise 2:
Explore diffraction patterns for rulings with different aperture functions ('duty cycles' of the square-wave train).
>