

Lassonde Professor Gene Cheung partners with a fintech agricultural company to improve crop yield predictions using graph signal processing and deep learning.
While many are aware of the use of mathematics and machine learning techniques in the fields of computer science, engineering, physics and medicine, have you ever wondered how well these techniques fare in literal fields or pastures?
Pretty well actually, as Cheung, who is from the Lassonde School of Engineering, discovered while working with Growers Edge to improve crop yield prediction using graph signal processing and deep learning.
Growers Edge is a fintech company operating in the agricultural space, providing decision-making tools, risk management and financial solutions to agricultural retailers and producers. One way they do this is by providing warranty-backed and data analytics-supported crop growing prescriptions to farmers: a combination of growing practices and the use of certain products or seeds to help maximize crop yields. “Crop yield prediction helps farmers determine benchmarks,” says Tim Eadie, data engineer at Growers Edge. “Sometimes they have production history but many times they don’t.” Crop models help fill in the gap for those who do not have a 10-year production history on their farms.
Conventional crop yield predictions use relevant features that influence crop production as inputs – for example, weather and geographic information such as soil composition, precipitation, temperature and even indices describing the degree of vegetation – to predict crop yields. However, drawing on data sources that describe diverse physical phenomena to produce an output in “bushels per acre” is complex, and thus this problem requires a data-driven or, more specifically, a deep learning (DL) approach which feeds data into a convolutional neural network (CNN), a DL model that excels in processing two-dimensional data such as images, or in this case, geographically linked data.
Although deep learning is a great solution, it also has its limitations. First, the network must be given a reference set of verified input (known as features) and actual crop yields to train the model to make predictions. This only works optimally when sufficiently large labelled datasets are used. However, in predicting crop yield, there may only be limited county-level data, numbering in the thousands. Moreover, data such as planting dates collected via farmer surveys by government entities like the U.S. Department of Agriculture (USDA), or vegetation indices computed from satellite image analysis, are error-prone, occasionally missing, or low in spatial resolution. Finally, counties are defined by geographic boundaries and therefore county-level data, unlike the pixels of a two-dimensional image, are not evenly spaced out and require additional computational effort to make it suitable for a CNN deep learning model.
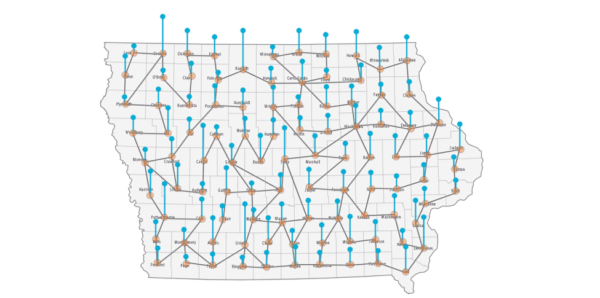
Although the team at Growers Edge was already implementing deep learning in their crop yield modelling, they needed to find a way to overcome challenges to improve prediction performance. This is where Cheung’s expertise in graph signal processing (GSP) comes in. With his help, Growers Edge can apply GSP to help reduce the noise-relevant (denoising) features before feeding the data into the deep learning model. A graph is a mathematical abstraction modeling correlated data, with nodes (representing fields/counties) and edges (encoding pairwise similarities). Graph examples in the real world include sensor networks (connecting wireless temperature in a forest), social networks (connecting friends on Facebook), etc. In this case, each node represents a particular county described by a set of environmental variables (a feature vector) such as precipitation or sunshine and vegetation indices (EVI, NDVI) of that area.
“The key insight is that one county ought to be similar to its geographical neighbours,” explains Cheung. “Both data and ultimately crop yields ought to be correlated as well.” The similarity of neighbouring nodes is reflected in the graph’s edge weights which are calculated by incorporating not only the geographic distance between the two counties but also the similarity of reliable environmental variables such as clay composition. In turn, this graph-based approach can be used to denoise unreliable features such as satellite-based EVI and NDVI by averaging out the values from neighbouring counties that are geographically near and environmentally similar.
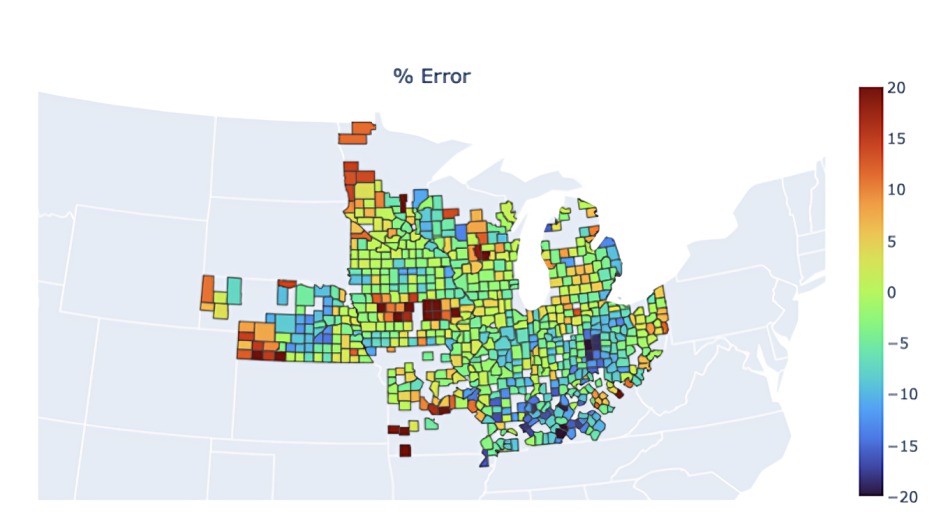
Cheung and Eadie applied this graph-based denoising to USDA corn data from 10 states in the corn belt encompassing nearly a thousand counties. They denoised the unreliable EVI features before feeding the data to their DL model and improved its accuracy by 0.434 per cent compared to the previous approach. While this percentage improvement may not seem large at face value, Eadie reminds us that these predictions are for bushels per acre and when farmers are dealing with hundreds of thousands of acres these numbers add up quickly.
By combining graphs with both spatial and temporal modelling using earth observation data in the context of crop yields, the research team is paving new ground. “Graph signal processing is an excellent approach to capture correlations,” says Cheung. “However, at this time nobody uses it for crop prediction, so we need to convince people in this field that it is a meaningful approach.”
Growers Edge is certainly on board. “Some of the best research and solutions for many of the world’s most pressing issues have been born out of academic and private partnerships,” said Growers Edge CEO Dan Cosgrove. “In collaboration with our team, Professor Cheung and his student assistants have helped build a solution that can positively impact the entire U.S. ag industry for years to come. We value the contributions of Professor Cheung made on this project and look forward to finding creative solutions to problems in the future.”
As an applied mathematician, Cheung is always looking for impactful applications and once he realized that graph signal processing was applicable to crop yield prediction, he and Eadie started to collaborate. Cheung is now an advisor on the Grower Edges Data Advisory Board, and his PhD student, Saghar Bagheri, has started a Mitacs internship at Growers Edge. Their next step is to continue refining their model and design the best possible graph for the deep learning architecture.
“It has definitely been a challenging but exciting experience,” says Eadie. “We’re discovering newer and more innovative ways to tackle a problem that ultimately helps and empowers farmers.”