Photopigment Regeneration
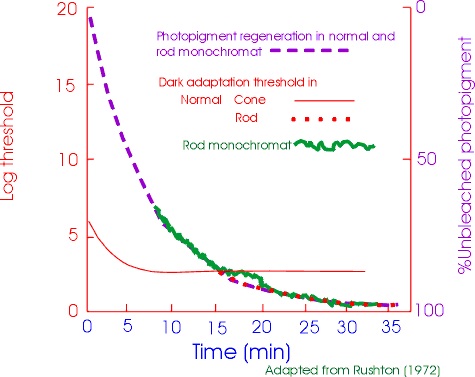
 There is quite a bit of information in this graph.
The purple, dashed line shows the course of rhodopsin
regeneration after it was completely bleached by a very bright
light. Time represents the amount of time in darkness after
bleaching. The ordinate for the dashed, purple line is on the
right and you can see that at time 0 there is almost 0%
unbleached photopigment (rhodopsin). This purple curve represents
the function for both a normal sighted person and a person that
has only rod receptors (rod monochromat). This data was collected
with a retinal densitometer.
The squiggly green line represents the psychophysical threshold
function for the rod monochromat and the solid red line is
similar to the psychophysical cone threshold function for a normal
sighted person and the red dotted curve the rod function.. The
threshold curves should be view with respect to the left-hand
ordinate.
The early stage of the psychophysical function for rod
threshold is not seen for a normally sighted person because the
cone receptors are more sensitive than the rods. You can see, in
this graph and also in the dark adaptation
graph that the cone function reaches a plateau after about 7
minutes in the dark. Rod vision takes over when it becomes more
sensitive. The significance of the graph on the right is that
because the same retinal densitometry function for rods is found
with a normal and rod monochromatic observer we can confidently
assume that the extrapolation of the early stage of rod
sensitivity shown in the dark adaptation
curve is correct.
Table of Contents
Subject Index
Table of Contents [When not using framtes]
 There is quite a bit of information in this graph.
The purple, dashed line shows the course of rhodopsin
regeneration after it was completely bleached by a very bright
light. Time represents the amount of time in darkness after
bleaching. The ordinate for the dashed, purple line is on the
right and you can see that at time 0 there is almost 0%
unbleached photopigment (rhodopsin). This purple curve represents
the function for both a normal sighted person and a person that
has only rod receptors (rod monochromat). This data was collected
with a retinal densitometer.