MacKenzie, I. S., & Ware, C. (1993). Lag as a determinant of human performance in interactive systems. Proceedings of the ACM Conference on Human Factors in Computing Systems - INTERCHI '93, 488-493. New York: ACM. doi:10.1145/169059.169431. [software]
Lag as a Determinant of Human Performance in Interactive Systems
I. Scott MacKenzie1 and Colin Ware2
1Dept. of Computing & Information ScienceUniversity of Guelph
Guelph, Ontario, Canada N lG 2W1
519-824-4120, mac@snowhite.cis.uoguelph.ca
2Faculty of Computer Science
University of New Brunswick
Fredericton, N. B., Canada E3B 5A3
506-453-4566, cware@unb.ca
Abstract:
The sources of lag (the delay between input action and output response) and its effects on human performance are discussed. We measured the effects in a study of target acquisition using the classic Fitts' law paradigm with the addition of four lag conditions. At the highest lag tested (225 ms), movement times and error rates increased by 64% and 214% respectively, compared to the zero lag condition. We propose a model according to which lag should have a multiplicative effect on Fitts' index of difficulty. The model accounts for 94% of the variance and is better than alternative models which propose only an additive effect for lag. The implications for the design of virtual rerdity systems are discussed.Keywords: Human performance modeling, lag, feedback delay, virtual reaIity, Fitts' law, speed-accuracy tradeoff
INTRODUCTION
Human interaction with computers is two-way. As participants in a closed-loop system, we issue commands through a computer's input channels and receive results fed back on output channels. Subsequent input depends on the latest output. Not surprisingly, performance is adversely affected when the feedback is subject to delay or lag. Fortunately, lag is negligible in many interactive computing tasks, such as text entry or cursor movement in word processing.The opposite extreme is remote manipulation systems, where the human operator is physically displaced from the machine under control. The lag may be due to mechanical linkages or to transmission delays in the communications channel. In controlling a space vehicle on a distant moon or planet, for example, transmission delays, or lag, maybe on the order of several minutes.
Somewhere in the middle is virtual reality (VR), a genre of interactive system relying heavily on the 3D tracking of hand, head, and/or body motion in a simulated 3D environment. The pretense of reality requires a tight link between the user's view of the environment and the actions – usually hand or head motions – that set the view. When changes in the environment lag behind input motions, the loss of fidelity is dramatic. Although this has been noted in VR research, empirical studies to measure lag and to evaluate its impact on human performance are rare. In this paper, we describe an experiment to measure and model the speed, accuracy, and bandwidth of human motor-sensory performance in interactive tasks subject to lag.
The Source of Lag
Lag is inevitable and can be attributed to properties of input devices, software, and output devices. The sampling rate for input devices and the update rate for output devices are major contributors. Input devices are usually sampled at fixed rates in the range of 10 to 60 samples per second. A 60 Hz rate (every 16.67 ms) is possible when synchronizing with the vertical retrace of many CRT displays. On average, this component of lag is half the retrace period or 8.3 ms. Alone, this is negligible. (8.3 ms is the period of flicker in a fluorescent light fixture driven by a 60 Hz full-wave rectified power source. The flicker is undetectable by the human eye.)Lag is increased further due to "software overhead" – a loose expression for a variety of system-related factors. Communication modes, network configurations, number crunching, and application software all contribute. Lag will increase dramatically when output requires substantial computation for graphic rendering. A frame rate of 10 Hz is considered minimal to achieve "real time" animation. Since the construction of the frame only begins when the position is known, the potential for parallel processing is limited. Using standard double buffering (in which the frame is only presented once fully drawn), there is a minimum 100 ms lag to the start of the frame display interval and a lag of 150 ms to the middle of the frame display interval.
In VR, lag is very much present. It is associated mostly with three-dimensional tracking devices attached to the hand or head, as well as the lag caused by the low frame rates. Typical devices include the Polhemus lsotrak (used on the VPL DataGlove) and the Ascension Bird. These devices (i.e., their interfaces) must transmit six degree-of-freedom position and orientation data to the host computer at a high rate while acting in concert with competing processes in the complete VR environment. Maintaining negligible lag is usually not possible.
In one of the few empirical studies on lag, Liang, Shaw, and Green [9] describe an experiment to measure the lag on a Polhemus lsotrak. They found lags between 85 ms and 180 ms depending on the sampling rate (60 Hz vs. 20 Hz) and communications mode (networked, polled, continuous output, direct, and client-server). Although the software was highly optimized to avoid other sources of lag, their results are strictly best-case since an "application" was not present. A filtering algorithm was proposed to compensate for lag by anticipating head motion.
The communication link becomes more of a bottleneck as the number of sensors and their resolution increases. The CyberGlove by Virtual Technologies provides greater resolution of finger position than many gloves by including more sensors – up to 22 per glove. However, correspondingly more data are required. At the maximum data rate of 38.4 kilobaud, it takes about 5 ms just to relay the data to the host. Although, individual sensors can be disabled to increase throughput for simple motions, a tradeoff is evident between the desire to resolve intricate hand formations and the requisite volume of "immediate" data. If we speculate on future interaction scenarios with full body suits delivering the nuances of complex motions – a common vision in VR – then it is apparent that lag will substantially increase simply due to the quantity of data.
The Effect of Lag
Although lag has been acknowledged and quantified as a compromising parameter in VR systems, and its effect on human performance appears to be considerable, the evidence for this is mostly anecdotal.In a recent newspaper article touting the promise of VR as a tool for artists [4], lag was cited as a hindrance to user interaction. "The display is low-resolution and cartoonish and because of the enormous computing power needed to generate the environments, there tends to be a brief but noticeable time lag between turning your head and seeing the new point of view" (p. Cl). Specific effects on human performance were not cited, however.
On intuitive grounds, Pausch notes that low-latency is significantly more important than high-quality graphics or stereoscope [13]. His low-end VR system emphasized presence (i.e., low lag) over output graphics by maintaining seven screen updates per second with wire frame images. In an experiment with force feedback, Brooks, Ouh-Young, Batter, and Kilpatrick [1] concluded that screen updates are needed 15 times per second minimum in maintaining the illusion of continuous change in the force sensed. Even at this rate, subjects objected to the "sponginess" of the feel. Others cite "motion sickness" as a by-product of lag with head-mounted displays [6, 8].
The cognitive co-processor architecture from Xerox PARC [3], in order to maintain the illusion of reality, adopts a "governor" mechanism to ensure the screen is updated every 100 ms – the time for perceptual processing. If loading increases, cooperating rendering processes reduce the quality of the output to maintain the 10 frame per second refresh rate. This is in keeping with Pausch's claim that maintaining low lag is more important than high-resolution graphic output.
Empirical measurements of effect of lag on human performance are rare. There was some research in the 1960s (e.g., [7, 14]) relating to the design of controllers for remote manipulations systems; however the lags tested were extremely long (up to several seconds). In one instance, the apparatus was mechanical [14], and in another lag was programmed as an exponential time constant preventing the cursor from fully reaching a target unless a deliberate overshoot was programmed [7]. In both cases movement time increases due to lag were dramatic – well in excess of the amount of lag. Since lag is on the order of a few hundred milliseconds in VR, its effect on human performance is less apparent.
Lag and the Speed-Accuracy Tradeoff
Certainly, the presence of lag in interactive environments will increase the time to complete motor-sensory tasks; but the extent of the "cost" is uncertain. Error rates may also increase due to lag.As the difficulty of tasks increases, the degradation in performance may increase non-linearly with lag. To test this, we call on Fitts' law [5], whereby the difficulty of a target acquisition task is rated in "bits" as
| ID = log2(A / W + 1) | (1) |
where A is the amplitude or distance to the target and W is the width or size of the target. Equation 1 is a variation known as the Shannon formulation [10].
In repeated trials, if the mean difficulty of a range of tasks (ID, in bits) is divided by the mean movement time to complete the tasks (MT, in seconds), then the dependent variable bandwidth (BW, in bits/s) emerges. (Fitts called this the index of performance, IP.) Furthermore, if ID is calculated using the effective target width (We), adjusted for errors or spatial variability in responses, then bandwidth encompasses speed and accuracy.l This provocative measure – somewhat analogous to efficiency – holds tremendous promise for measurement and evaluation in human-computer interfaces (e.g., [2]). Adjusting for error rates, the effective index of difficulty is
| IDe = log2(A / We + 1) | (2) |
and
| BW = IDe / MT | (3) |
The prediction model for movement time may be obtained through linear regression as follows:
| MT = a + b × IDe | (4) |
The slope reciprocal, 1 / b, is often interpreted as bandwidth. Provided the intercept is small, l / b in Equation 4 will be very similar to the bandwidth calculated using Equation 3.
It has been suggested that target acquisition may consist of a succession of discrete movements, each subdividing the target space until the probe is within the target, similar to a binary search. The index of difficulty can be interpreted as a measure of the number of movements required (averaged over a number of trials). The effect of lag, therefore, should occur at each of the discrete movement stages. To accommodate lag in our model, we multiply by the index of difficulty. Thus, we replace the conventional single parameter Fitts' law model (Equation 4) with
| MT = a + (b + c × LAG ) IDe | (5) |
where the additional coefficient, c, is the weighting for the lag × ID interaction. Conveniently, in the absence of lag Equation 5 reduces to Equation 4.
In the next section we describe an experiment using a target acquisition task to measure the effect of lag on the speed, accuracy, and bandwidth of human performance in motor-sensory tasks on interactives ystems.
METHOD
Subjects
Eight subjects from the University of British Columbia (where the second author was on sabbatical) served as paid volunteers. All subjects had prior experience using a mouse.
Apparatus
A Silicon Graphics personal IRIS with a standard CRT and an optical mouse was used. The C-D gain of the mouse was set to one.The cursor was a 7 × 7 pixel green square with a 1 pixel black dot in the centre (1 pixel = 0.035 cm). The goal was to get the central dot within the target boundaries. The software was optimized to reduce overhead. All mouse samples and screen updates were synchronized to the vertical retrace of the CRT (60 Hz). Lag was introduced by buffering mouse samples and delaying processing by multiples of the screen refresh period (16.67 ms increments). The minimum lag was, on average, half the retrace period, or 8.3 ms.
Procedure
The following discrete target acquisition task was used. At the initiation of a trial the cursor appeared 300 pixels from the left side of the screen, and the target appeared to the right of that position by the appropriate amplitude for that trial. Target width varied but target height was consistently 400 pixels. The subject completed a trial by moving the cursor so that the black dot in the centre of the cursor was somewhere over the target. The target was selected by pressing one of the mouse buttons.To initiate the next trial, the subject lifted the mouse, moved it to the right of the mouse pad, and swept it across to the left side of the mouse pad. This correctly positioned the mouse to start the next trial, which followed after an interval of 2 seconds.
Subjects were demonstrated the task and allowed warm-up trials prior to each change in experimental condition.
Design
A 4 × 3 × 4 fully within-subjects repeated measures design was used. The factors were lag (8.3, 25, 75, & 225 ms), target amplitude (A = 96, 192 & 384 pixels), and target width (W = 6, 12, 24, & 48 pixels). The A-W conditions yielded six levels of task difficulty, ranging from 1.58 bits to 6.02 bits.A block consisted of 56 trials arranged as follows: For each lag, testing was done for 3 amplitudes and 4 widths yielding 4 groups of 12 trials. However, at the start of each group two practice trails were given to familiarize the subject with that particular lag. Thus we obtain,
2 + 12 trials with lag 1,
2 + 12 trials with lag 2,
2 + 12 trials with lag 3, and
2 + 12 trials with lag 4.
These groups were given in a random order for each trial block.
Each subject received 24 blocks of 56 trials where the blocks consisted of the 24 possible orders of 4 lags. The 24 blocks were given in a unique random sequence for each subject. Additionally, at the start of each session, the subject received a practice block of trials, selected at random. Subjects completed all blocks in either two or three sessions.
RESULTS AND DISCUSSION
As expected, there were significant main effects for lag on movement time (F3,21 = 208.7, p < .0001), error rate (F3,21 = 4.71, p < .05), and bandwidth (F3,21 = 227.7, p < .0001). Figure 1 gives the mean scores for each level of lag as well as the percentage degradation at 225 ms lag compared to the measures at a negligible lag of 8.3 ms. (Recall that 8.3 ms is as close to zero lag as was possible given the 60 Hz sampling rate for the mouse.)
| Measure | Lag (ms) | Performance Degradation at Lag = 225 msa | |||
|---|---|---|---|---|---|
| 8.3 | 25 | 75 | 225 | ||
| Movement Time (ms) | 911 | 934 | 1059 | 1493 | 63.9% |
| Error Rate (%) | 3.6 | 3.6 | 4.9 | 11.3 | 214% |
| Bandwidth (bits/s) | 4.3 | 4.1 | 3.5 | 2.3 | 46.5% |
| a relative to lag = 8.3 ms | |||||
error rate, and bandwidth over four levels of lag.
Error rates were quite reasonable (under 5%) except at the highest lag of 225 ms where they were over 11%. The bandwidth figures of around 4 bits/s for the lags up to 75 ms are similar to those found elsewhere (e.g., [12]). A lag of 225 ms relative to 8.3 ms increased the mean movement time by 1493 − 911 = 582 ms, or 63.9%.
Similarly, error rates increased by 214% and bandwidth dropped by 46.5%. These represent dramatic performance costs. The high error rate at 225 ms lag indicates that the performance degradation is more serious than suggested solely on the basis of the extra time to complete tasks. Subjects natural tendency to anticipate motions was severely compromised by the lag. Adopting an open-loop or "wait-and-see" strategy would solve this (as noted by Sheridan & Ferrell [14]), but would further increase movement times.
Task difficulty (ID ) also had a significant effect on movement time (F5,35 = 116.8, p < .0001) and error rates (F5,35 = 6.70, p < .0005).2 As well, there was a significant lag × ID interaction effect on movement time (F15,105 = 30.4, p < .0001) and error rate (F15,105 = 2.42, p < .005). The interaction is easily seen in Figures 2 and 3. As tasks get more difficult, performance degradation increases, particularly at 75 ms and 225 ms lag.
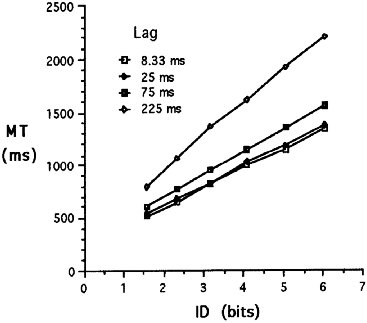
Figure 2. Movement time vs. index of task
difficulty over four lag conditions.
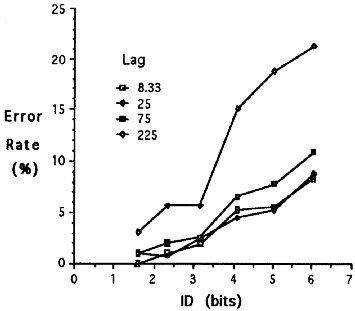
Figure 3. Error rate vs. index of task difficulty
over four lag conditions.
A Prediction Model
Rather than present Fitts' law models under each lag condition, we feel it more relevant to integrate lag with Fitts' index of task difficulty in a single prediction model. This idea is developed in the series of models shown in Figure 4.
| Model for MT (ms)a | Fitb | Variance Explained |
|---|---|---|
| MT = 435 + 190 IDe | r = .560 | 31.3% |
| MT = 894 + 46 LAG | r = .630 | 39.8% |
| MT = −42 + 246 IDe + 3.4 LAG | R = .948 | 89.8% |
| MT = 230 + (169 + 1.03 LAG) IDe | R = .967 | 93.5% |
| a LAG in ms, IDe in bits b n = 48, p < .0001 for all models | ||
lag and the index of task difficulty.
The first two entries are simple linear regression models, predicting movement time solely on the index of task difficulty (IDe, adjusted for errors) or lag. The fit is poor in both cases.
The third and fourth models in Figure 4 combine IDe and lag using multiple regression. The third entry is the traditional multiple regression model with IDe and lag entered a separate predictors. The fit is very good (R = .948) with the model accounting for 89.8% of the variance in the observed movement times. However, the fit is improved (R = .967) in the fourth model which accommodates the interaction effect seen in Figures 2 and 3 and discussed earlier. The result is a model which accounts for 93.5% of the variance in observations. Rounding the coefficient 1.03 to 1.00 yields
| MT = 230 + (169 + LAG ) IDe | (6) |
At lag = 0, this reduces to
| MT = 230 + 169 IDe, | (7) |
which is the same as a model found in a separate study also using a mouse in a discrete target selection task (see [11] Eq. 4). Each millisecond of lag in Equation 6 adds 1 ms/bit to the slope of the prediction line.
Although we must be cautious in extrapolating beyond the 225 ms lag used in the present experiment, it is easy to see that further increases in lag will bear severe costs in performance, particularly with difficult tasks. As a simple example, at lag = 500 ms and ID = 7 bits, the predicted time to complete a target selection task using Equation 5 is 5.9 s. The same task in the absence of lag will take about 1.4 s. (Note that the prediction carries a 4% probability of error because the model was adjusted for errors.)
CONCLUSIONS
Lag has been shown to degrade human performance in motor-sensory tasks on interactive systems. At 75 ms lag, the effect is easily measured, and at 225 ms performance is degraded substantially. A model has been presented showing a strong multiplicative effect between lag and Fitts' index of difficulty. The model explains 93.5% of the variation in observations.These findings are of particular and immediate value to designers of interactive 3D computing systems, such as virtual reality. The present study is only a first step, however, since we investigated 2D movements only. A 3D exploration of the human performance cost of lag is needed using a task such as grasping for objects in 3-space with an input glove while viewing the scene through a head-mounted display.
Lag must be taken seriously and recognized as a major bottleneck for usability. The current attitude of acknowledging lag but "learning to live with it" will be increasingly unacceptable as VR systems shift from research curiosities to application tools. Whether through additional parallel processors or through higher performance hardware, such systems must deliver a faithful recasting of reality in order to garner user acceptance. A major component of this is the delivery of near-immediate response of graphic output to input stimuli.
ACKNOWLEDGMENT
We gratefully acknowledge the support of the Magic Lab at the University of British Columbia in providing equipment and space for running the experiment. This research was supported by the Natural Sciences and Engineering Research Council of Canada.
REFERENCES
| 1. | Brooks, F. P., Jr., Ouh-Young, M., Butter, J. J., &
Kilpatrick, P. J. (1990). Project GROPE: Haptic
displays for scientific visualization. Computer
Graphics, 24(4), 177-185.
https://doi.org/10.1145/97880.97899
|
| 2. | Card, S. K., Mackinlay, J. D., & Robertson, G. G.
(1991). A morphological analysis of the design space
of input devices. ACM Transactions on Office
Information Systems, 9, 99-122.
https://doi.org/10.1145/123078.128726
|
| 3. | Card, S. K., Robertson, G. G., & Mackinlay, J. D.
(1991). The information visualizer: An information
workspace. Proceedings of the CHI '91 Conference on
Human Factors in Computing Systems (pp. 181-188).
New York ACM.
https://dl.acm.org/doi/pdf/10.1145/108844.108874
|
| 4. | Dafoe, C. (1992, September 5). The next best thing to
being there. The Globe and Mail, pp. Cl, C5.
|
| 5. | Fitts, P. M. (1954), The information capacity of the
human motor system in controlling the amplitude of
movement. Journal of Experimental Psychology, 47,
381-391.
https://psycnet.apa.org/doi/10.1037/0096-3445.121.3.262
|
| 6. | Foley, J. D., van Dam, A., Feiner, S. K., & Hughes, J.
F. (1990). Computer graphics: Principles and
practices (2nd cd.). Reading, MA: Addison Wesley.
https://students.aiu.edu/submissions/profiles/resources/onlineBook/a6A8H5_computer%20graphics.pdf
|
| 7. | Gibbs, C. B. (1962). Controller design: Interaction of
controlling limbs, time-lags, and gains in positional
and velocity systems. Ergonomics, 5, 385-402.
https://doi.org/10.1080/00140136208930602
|
| 8. | Laurel, B. (1991). Computers as theatre. Reading,
MA: Addison-Wesley.
https://www.cs.cmu.edu/~social/reading/Laurel-ComputersAsTheatre.pdf
|
| 9. | Liang, J., Shaw, C., & Green, M. (1991). On
temporal-spatial realism in the virtual reality
environment. Proceedings of the ACM SIGGRAPH
and SIGCHI Symposium on User Interface Software
and Technology - UIST '91 (pp. 19-25). New York
ACM.
https://dl.acm.org/doi/pdf/10.1145/120782.120784
|
| 10. | MacKenzie, I. S. (1992). Fitts' law as a research and
design tool in human-computer interaction. Human-Computer
Interaction, 7, 91-139.
https://doi.org/10.1207/s15327051hci0701_3
|
| 11. | MacKenzie. I. S., & Buxton, W. (1992). Extending
Fitts' law to two-dimensional tasks. Proceedings of the
CHI '92 Conference on Human Factors in Computing
Systems (pp. 219-226). New York ACM.
https://doi.org/10.1145/142750.142794
|
| 12. | MacKenzie, I. S., Sellen, A., & Buxton, W. (1991). A
comparison of input devices in elemental pointing and
dragging tasks. Proceedings of the CHI '91
Conference on Human Factors in Computing Systems
(pp. 161-167). New York: ACM.
https://dl.acm.org/doi/pdf/10.1145/108844.108868
|
| 13. | Pausch, R. (1991). Virtual reality on five dollars a
day. Proceedings of the CHI '91 Conference on
Human Factors in Computing Systems (pp. 265-269).
New York ACM.
https://doi.org/10.1145/108844.108913
|
| 14. | Sheridan, T. B., & Femell, W. R. (1968). Remote
manipulative control with transmission delay. IEEE
Transactions on Human Factors in Electronics, 4, 25-
29.
https://doi.org/10.1109/THFE.1963.231283
|
| 15. | Welford, A. T. (1968). Fundamentals of skill. London:
Methuen.
https://gwern.net/doc/psychology/1968-welford-fundamentalsofskill.pdf
|
Foototes
l The method for transforming W to We was first presented in 1960. See Welford [15, p. 147] or MacKenzie [10] for detailed discussions.
2 ID rather than IDe was used in the ANOVA and in Figures 2 and 3 showing the lag × ID interaction. This was necessary since effects in an analysis of variance must be nominal variables. After the transformation, IDe becomes a random variable. IDe was used in calculating BW and in building the regression models.