Ten most frequent diagrams
Digram Count Probability ---------------------------------- e-space 4904 .0457 space-t 3912 .0365 t-h 3774 .0352 h-e 3155 .0294 d-space 2627 .0245 s-space 2348 .0219 t-space 2228 .0208 space-a 1882 .0176 space-w 1787 .0167 a-n 1576 .0147 ----------------------------------- Note: Probability = Count / 107,199 |
2.2 The Upper Bound
For each of the 27 × 27 digrams in figure 1, we used Fitts' law to predict the movement time to select the second key, given the first. Fitts' law is expressed as

| (1) |
where MT is the predicted movement time, and ID is the index of difficulty of the task being modeled. The coefficients a and b are constants obtained through linear regression. The index of difficulty, in bits, is defined using the Shannon formulation (MacKenzie, 1992) as
| (2) |
A and W are parameters in the task being modeled. Specifically, A is the amplitude of the movement and W is the width of the target (ideally, measured in the direction of motion).
We are interested in movements from an initial character on the keyboard i, to a subsequent character j. Combining Equations 1 and 2 results in

| (3) |
where the variable Aij, the amplitude, represents the distance from the centre of the i key to the center of the j key across the keyboard. The variable W, the width, represents the width of the target key, which is the same for all alpha keys (see below). The variable MTij is the predicted time to move from the i key to the j key.
Notice that amplitude and width are measured in the same units and form a ratio in equation 3. This implies that a QWERTY keyboard will yield the same movement time regardless of its size, so long as the same relative scale is maintained. This will be true only within limits. For example, as keyboard size decreases, precision will be compromised as size of the targets diminishes. As keyboard size increases, movement times will increase (and precision may decrease) because forearm motion will be required where wrist-only motion was previously used.
There exists a problem with the predicted movement time as defined above. Fitts' law is only valid for movements from a start location to a target some non-zero distance away. When entering a character twice in succession, the starting character i is the same as the target character j, and the amplitude A is zero. Fitts' law does not apply. To circumvent this difficulty we modify our model:
| (4) |
where MTRepeat is the time to activate a key a second time after it has already been activated. A discussion of how a value for MTRepeat was obtained is given later.
To weight each MTij, we define Pij as the probability of occurrence of the digram ij, (the character i followed by the character j). Note that the sum of all probabilities must be one; that is
|
Then we define
| (5) |
where ![]() is the mean time between keys with an alphabet
of 27 symbols, as noted earlier.
is the mean time between keys with an alphabet
of 27 symbols, as noted earlier. ![]() is a minimum because it is
based solely on the time to move between keys and assumes
no pause for thinking or finding keys.
is a minimum because it is
based solely on the time to move between keys and assumes
no pause for thinking or finding keys.
Taking the reciprocal of the average movement time yields the average number of characters per second, which is easily transformed into words per minute:
| (6a) |
| (6b) |
Note that typists define a word as five characters, including spaces and punctuation. Equation 6 is our upper-bound model.
2.3 The Lower Bound
To compute a lower-bound typing rate, we use the Hick-Hyman law to add a visual scan time onto each entry. The Hick-Hyman law is expressed as

| (7) |
where n is the number of items to choose from, and RT is the choice reaction time, or the time required to make a choice among n items. The coefficients a' and b' are slope and intercept constants, similar to the coefficients a and b in Fitts' law.
To calculate the lower bound, we simply add the choice reaction time to the movement time per character:
| (8a) |
| (8b) |
The minimum typing speed considers not only the movement time between keys, but the time it takes on average to find each key by someone who is unfamiliar with the QWERTY layout. Equation 8 is our lower-bound model.
2.4 Coefficients in the Model
The derivation presented thus far, culminating in Equations 6 and 8, expresses our upper-bound and lower-bound models in general terms, without assigning numerical coefficients. Predictions follow once the coefficients in the models are assigned values.
2.4.1. Fitts' Law Intercept, a.
The form of Fitts' law expressed by equation 1 contains coefficients for the intercept, a, and slope, b. It is generally accepted that the intercept should be zero. If the intercept were positive then the movement time for a task with ID = 0 is not zero (see equation 1). This seems unreasonable. Similarly, with a negative intercept, a task of zero difficulty has a negative predicted movement time, which also seems unreasonable. Fitts' (1954) original relationship excluded the intercept altogether. For these reasons, we used a = 0.
2.4.2. Fitts' Law Slope, b.
Choosing an appropriate value for the slope is a problem. The reciprocal of the slope is the bandwidth, measured in bits per second (bps). Fitts (1954) original work with a stylus reported bandwidth in the range 9.5 to 11.5 bps. In later work, Fitts and Peterson (1964) suggested a range of 14 to 22 bps. In our opinion, these values are too high. (A justification appears later.) The study by MacKenzie et al. (1991) measured the bandwidth for pointing tasks using a stylus as a computer input device and found a rate of 4.9 bps. The pointing task in the latter experiment was similar to the form of typing we are investigating.
Many reasons for the lack of consensus on bandwidth relate to diverse and inconsistent experimental methods, as identified in an earlier paper (MacKenzie, 1992). The calculations that follow were performed in duplicate using 14 bps, as suggested by Fitts and Peterson (1964), and 4.9 bps, as suggested by MacKenzie et al. (1991).
2.4.3. Key Distances, Aij.
We used a facsimile of a QWERTY keyboard taken from IBM hardware documentation (IBM, 1984, pp. 4-6) to find the inter-key distances. Using an arbitrary origin, x and y coordinates were assigned to each key and inter-key distances were calculated using the Pythagorean identity. As an example, the distance across the keyboard from Q to P in our template was 18.9 cm.
As noted previously the actual size of the keyboard is irrelevant, within limits. It is assumed that the simulated QWERTY keyboard matches the proportions of the keyboard taken from the IBM documentation.
The position of the space bar cannot assume a fixed x-y coordinate, as with alpha keys, since the space bar spans the width of the keyboard. As illustrated in figure 2, the distances for the diagrams involving spaces depend on three keys, rather than two. For our lower-bound model we assume users do not optimize movements and proceed directly to the space bar at the end of each word (see figure 2a). For our upper-bound model we assume a strategy that minimizes the total distance of the letter-space-letter sequence; that is, the angle of approach to the space bar is the same as the angle of departure (see figure 2b).
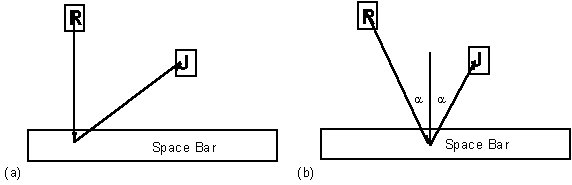
Figure 2. Distances to and from the space bar. (a) non-optimized
movements for novices (b) optimized movements for experts.
Instead of computing distances explicitly for each letter-space-letter trigram, we computed each letter-space distance as a weighted average considering all possible letters that might follow, and, similarly, computed each space-letter distance as a weighted average considering all possible preceding letters. Although this sounds messy, the formulas, once established, are easily added to the spreadsheet containing the 27 × 27 digrams.
Note that the space bar of many modern computers does not extend from the edge of the left side of the alphabetic keys to the edge of the right side. In our model, we assume the space bar spans the width of the alpha keys. This a minor adjustment; however, the assumption simplifies the calculations of letter-space-letter distances. Since the space character is the most common, it is reasonable to assume that a soft keyboard would accommodate the prominence of the space bar.
2.4.4. Key Width, W.
Recall that the width, W, is measured in the direction of motion. Because the keys of the QWERTY keyboard are rectangular, the magnitude of W differs with the angle that the stylus approaches the target key. This complicates the model; however a pragmatic solution (with empirical support) is to set W to the minimum of the height and width of rectangular targets (MacKenzie & Buxton, 1992). This applies to all keys including the space bar. Thus, we used W = 2.12 cm for the width of the alpha keys and W = 2.38 cm for the width (actually, the height) of the space bar.
2.4.5. Hick-Hyman Law Intercept, a'.
Most interpretations of the Hick-Hyman law associate the intercept, a', with a transport lag resulting from the subjects' immediate reaction to the onset of the stimulus. However, when there is no uncertainty as to when the stimulus signal arrives, as in continuous text-entry, Welford (1968) suggests that the constant, a', is zero. Therefore, we set a' = 0.
2.4.6. Hick-Hyman Slope, b'.
As in Fitts' law, the reciprocal of the slope coefficient in the Hick-Hyman law, b', is called the bandwidth and is measured in bits per second. Bandwidth, in this context, is the rate at which humans process choices.
Welford (1968) maintains that for subjects in their twenties using key presses to signal choices, the reciprocal of the slope in the Hick-Hyman law lies in the range 5 to 7 bps. Since we are searching for a lower bound, we assume that the slowest choice processing speed is appropriate, and set b' = 1/5 = 0.2 seconds per bit. This is also the figure reported by Hick (1952).
With a 27-character alphabet, n = 27, so the visual scan time for novices in the lower-bound model is

|
2.4.7. Key Repeat Time, MTRepeat.
A small informal experiment was conducted to determine a reasonable value for the mean key repeat time, MTRepeat Six subjects entered one character repeatedly into an editor for one minute. They used a stylus to tap on a soft keyboard displayed on a Wacom PL-100V digitizing display/tablet. Every ten seconds a carriage return was entered by the operator from the physical keyboard. (This was done to simplify the subsequent analysis of the number of characters entered in each ten second period.) Because the physical keyboard was used to enter the carriage returns, the participants were not disturbed from their task. Of the 2,347 characters entered by all subjects, the average number depressed per second was 6.52, with a standard deviation of 1.15 characters. No significant difference was noted in the number of characters depressed across the six different ten-second periods. The results indicate that MTRepeat = 1 / 6.52 = 0.153 seconds. This is close to the figure of 140 ms cited by Card et al. (1983, p. 60) for a typist repetitively pushing a key with a finger.
3. RESULTS OF MODEL DERIVATION
We have now completely defined all equations and coefficients for the upper-bound and lower-bound models. Since the models were developed using a spreadsheet, the results were available to us immediately upon entering the formulas. Table 2 summarizes the results. Using a bandwidth of 4.9 bps, we expect subjects can type (i.e., tap) at about 8.9 wpm without any prior experience with a QWERTY keyboard. With practice, this rate should increase to about 30.1 wpm. Using a bandwidth of 14 bps, the range is from about 11.0 wpm to 84.6 wpm. We feel the latter figure is much too high.
Upper-Bound and Lower-Bound Predictions
Lower Bound Upper Bound ----------------------- ----------------------- Characters Words Characters Words Bandwidth Per Second Per Minute Per Second Per Minute ------------------------------------------------------------ 4.9 bps 0.74 8.9 2.51 30.1 14 bps 0.92 10.98 7.05 84.56 |
4. DISCUSSION
Before comparing our results with empirical data from other studies, we present an observation that illustrates why a bandwidth of 14 bps is too high. Consider entering the sequence Z-X, which corresponds to neighbors on a QWERTY keyboard. Using 1 / b = 14 bps, the predicted time to tap X following Z is
| (9) |
Clearly this is unreasonable because it is less than half the MTRepeat time of 153 ms given earlier. For this and other reasons (see MacKenzie, 1992), we feel the bandwidth figure of 4.9 bps is more accurate.
4.1. Comparisons With Other Text Entry Methods
Figure 3 compares the results of our model with empirical data from several text-entry experiments.
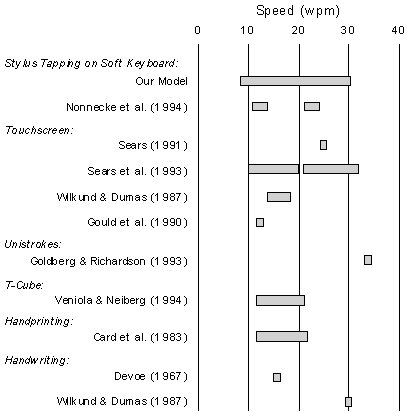
Figure 3. Performance comparison for stylus-tapping
on a soft keyboard and several other text-entry methods.
The only experiment we are aware of that tested stylus-tapping on a soft keyboard is reported in MacKenzie, Nonnecke, McQueen, Riddersma, and Meltz (1994). Two different keyboard arrangements were used: a QWERTY layout and an alphabetic (ABC) layout. In the latter case, keys were arranged alphabetically in two horizontal rows with a space bar across and below the bottom row. The ABC layout was tested because of its good use of screen real estate. Typing speeds for the QWERTY layout ranged from 21 wpm for the first block to 24 wpm for the ninth and last block. With prolonged practice, subjects would, no doubt, improve, perhaps leveling off near 30 wpm, as predicted in our upper-bound model.
Although the movement component of our model is inaccurate for the ABC layout (because the key distances were different), it is the visual scan time that dominates for novices. Therefore, the results for the ABC layout, which was unfamiliar to users, merit comparison with our lower-bound model. Typing speeds ranged from 12 wpm for the first block to 14 wpm for the ninth block. The entry rate of 12 wpm is slightly above our model's lower-bound rate of 8.9 wpm. We attribute this to the following. First, the alphabetic ordering of the ABC layout is not random; in fact, it gives subjects a good sense of where characters are located. This reduces the visual scan time that would occur for a random layout. Second, learning is "immediate". That is, after the first few entries, subjects are already gaining familiarity with the layout and cease to be novices in the strictest sense. In fact, an experiment to test our lower-bound model would require a completely new and random key assignment after each key stroke.
The closest entry method to stylus-tapping is the use of a soft keyboard on a touchscreen. Gould, Greene, Boies, Meluson, and Rasamny (1990) found entry rates of 12 wpm for experienced users. This rate seems low; however, the measurement included the extra touches to back-up the cursor, correct errors, and the time to review the input text mid-way through a block if subjects forgot the input string. Wilkund and Dumas (1987) found rates of 14-18 wpm in a similar experiment. Sears, Revis, Swatski, Crittenden, and Shneiderman (1993) measured entry rates with novice and expert users on two sizes of keyboards. Novice rates were 10 wpm on the small keyboard and 20 wpm on the large keyboard. Expert rates were 21 wpm on the small keyboard and 32 wpm on the large keyboard.
Sears (1991) found a rate of 25.4 wpm using expert subjects for a text-entry task with a touchscreen. The task was similar to that modeled here, since the only characters entered were the 26 alpha keys, a space bar, and a return key. The experiments described by Sears (1991), Sears et al. (1993), and Wilkund and Dumas (1987) allowed subjects to use two hands on the touchscreens, so comparisons with stylus-tapping are limited.
The text-entry method for pen-based computers that receives the most press is hand printing or hand writing with built-in recognition software. A "perfect" recognizer will be transparent to the user; so traditional research into hand printing and writing gives some insight into the best possible scenario for this provocative form of input. Hand printing speeds are well known to lie in the range of 12-23 wpm (Bailey, 1987; Card et al., 1983). So, even with highly accurate recognition software, entry speeds will not match experts tapping on a soft keyboard with a stylus. Although cursive handwriting rates can range from 16 wpm (Devoe, 1967) to over 30 wpm (Wilkund and Dumas, 1987), recognition errors exceed those for block printing (Wolf, 1987) and therefore exacerbate the algorithmic recognition of input.
At least two studies have attempted to re-design the Roman alphabet with simplified strokes. Goldberg and Richardson's (1993) Unistrokes assign each letter to a single stroke. This greatly simplifies the recognition software and permits eyes-free input with each stroke entered on top of preceding strokes in a dedicated scripting region. A formal experiment was not reported; however, one user attained rates of 33.6 wpm for "peak error-free" input. Veniola and Neiberg's (1994) T-Cube maps each letter to a flick gesture entered on top of a displayed radial menu. An experiment reported entry rates from 12 to 21 wpm. Notwithstanding the potential of techniques such as Unistrokes or T-Cube, the fact that a technique must be learned is a serious drawback.
Based on the results displayed in figure 3, our upper-bound prediction of 30 wpm fares quite well as a text-entry technique.
4.2. Weaknesses in our Model
Every effort was made to make our model comprehensive. Still, the predictions must be considered rough estimates. Although weaknesses in our model are easy to spot, we feel these represent less dominant aspects of the task than those that are accommodated. A few examples are offered.
Our model is limited to a 27-key soft keyboard with 26 alpha keys and a space bar. In practice, soft keyboards must accommodate the full spectra of text entry, including upper- and lower-case letters, punctuation symbols, function keys, etc. We limited our model to 27 keys because it made the task easy to define. Implementing the full complement of QWERTY keyboard features in a soft keyboard is easy, but performance predictions are difficult since they are highly task-dependent and they require a much larger table of digrams. Adding the period and comma to our table would be possible only if we undertook a very arduous process of data collection and tabulation similar to that reported by Mayzner and Tresselt (1965). Adding the less common graphic symbols (e.g., ~&"#) to our model is not worth considering, since they are not used in a consistent manner in "common English".
To obtain upper-case letters, a shift function can be implemented several ways. The simplest is to include a shift key which is touched once to transpose the next alpha key to uppercase. This method was implemented by Plaisant and Sears (1992) for a touchscreen. Caps lock may be implemented by a separate caps lock key or by double-tapping the shift key. In the latter case, caps lock ceases upon the next tap of the caps lock key.
The space bar on a QWERTY keyboard is much larger than the alpha keys and it is the most frequently entered key. Our model's formula for choice reaction time (equation 7) is a rough estimate; it assumes all choices are equally probable and are equally presented. Obviously, the space bar poses a problem in predicting visual scan time. Detailed treatments of choice reaction time replace log2(n) in equation 7 with an information metric for the entropy of the distribution of choices. This would tend to reduce RT in our lower-bound model and increase the predicted entry rate for novices.
The predictions are also weakened by the fact that the user's hand will partially obscure the keyboard after certain key-taps (for example, in the middle or upper-left regions of the keyboard for right-handers). This has a slight impact on both the RT and MT predictions in the lower-bound model. Other weaknesses have already been noted, such as the validity and accuracy of the Fitts' law model predicting the movement time for each entry.
4.3. Alternate Key Layouts
Since our model is based on a spreadsheet in which each key is assigned an x-y coordinate and movement distances are calculated using the Pythagorean identity, it is easy to predict the performance attainable with alternate key layouts. For example, it is often claimed that the Dvorak layout is preferable to the QWERTY layout because key positions were assigned along principles of time-motion studies and scientific measurements of efficiency for two-handed touch typing (Potosnak, 1988). These benefits may not necessarily transfer to typing with a stylus on a soft keyboard, however. We tested this by re-assigning the x-y coordinate for each key to match the Dvorak layout. Using our preferred bandwidth figure of 4.9 bps, we predict a lower limit of 8.6 wpm and an upper limit of 27.1 wpm, slightly below the predictions for the QWERTY layout.
Since our model is for a soft keyboard, we can go beyond simply rearranging the key positions, however. We can also adjust key sizes, with the most probable symbols assigned to "big keys" and the least probable assigned to "small keys". Such a keyboard would have a large space bar in the middle, "big" keys around the space bar around the space bar for the most probable letters (e.g., e, a, t, o), and "small" keys around the outside for the least probably letters (e.g., q, x, z).
Despite a lot of interesting research with alternate key layouts, or even chord keyboards, the momentum of the QWERTY layout is substantial. The promise of payoffs in terms of expert performance levels has had little effect in convincing users to shun the venerable QWERTY. For this reason, we have not pursued alternate key layouts further than the brief exploration noted above.
4.4. Stylus Tapping and Soft Keyboards
Stylus tapping on a soft keyboard is an entry method well-suited to pen-based computers. However, it is often ignored in the popular press which focuses on software that accepts the sloppy scrawl of the ambivalent user. The performance of recognition software is quite another issue. The gap between manufacturer's claims and the goods delivered was expounded by Kurtenbach, Moran, and Buxton (1994), for example.
From a qualitative viewpoint, one drawback of stylus tapping is the lack of kinesthetic feedback: Users must maintain eye-fixation on the screen. This is also true of hand printing if an input grid is presented. Cursive handwriting recognition promises to ease this constraint by allowing input anywhere on the input device. The input is recognized, converted to ASCII, and delivered to the application's insertion point. Another drawback of soft keyboards is that they consume screen real estate. This is particularly troublesome with the small form-factor of personal digital assistants. As with current implementations on graphical user interfaces, the soft keyboard is usually displayed only while in use. There is also the "feel" of the LCD surface. Users often note that the touch is too slippery — unlike the texture of pen-on-paper. Parallax is also a problem, as noted by Goldberg and Goodisman (1991).
In our view, pen-based computers are unsuited to applications that require extensive text input. Veniola (1994) also raises this point. Indeed, the promise of pen-based computers lies in vertical markets, wherein the application is so highly understood and constrained that input is primarily through on-screen buttons, menus, etc. For input-intensive tasks, the venerable QWERTY keyboard — like the one used to write this paper — remains unchallenged. With input rates well beyond 40 wpm for expert users, the alternate forms of input cited herein are reduced to niche applications, such as information kiosks or banking machines, or to occasional input on pen-based computers.
5. CONCLUSIONS
We have presented a model that gives upper-bound and lower-bound predictions for entry rates using a pen or stylus to tap on a soft QWERTY keyboard. The model is based on a characterization of the text-entry task based on linguistic tables of frequency probabilities of digrams (including spaces) in common English. Visual scan time is predicted by the Hick-Hyman law for choice reaction time, and movement time is predicted by Fitts' law for rapid aimed movements.
With predicted rates ranging from about 9 wpm for novices to 30 wpm for experts, stylus-tapping is a viable input method. Considering the accuracy problems that plague systems supporting hand writing recognition, stylus tapping on a soft keyboard represents a fast and easy alternative for text entry on pen-based computers.
REFERENCES
Bailey, R. W. 1989, Human performance engineering (2nd ed.), (Prentice Hall, Englewood Cliffs, NJ). https://dl.acm.org/doi/abs/10.5555/62023
Card, S. K., Moran, T. P. and Newell, A. 1983, The psychology of human-computer interaction (Erlbaum, Hillsdale, NJ). https://doi.org/10.1201/9780203736166
Devoe, D. B. (1967). Alternatives to handprinting in the manual entry of data, Transactions on Human Factors, HFE-8(1), 21-32. https://doi.org/10.1109/THFE.1967.233302
Epps, B. W. 1986, Comparison of six cursor control devices based on Fitts' law models, Proceedings of the Human Factors Society 30th Annual Meeting, 327-331. https://doi.org/10.1177/154193128603000403
Fitts, P. M. 1954, The information capacity of the human motor system in controlling the amplitude of movement, Journal of Experimental Psychology, 47, 381-391. https://psycnet.apa.org/doi/10.1037/h0055392
Fitts, P. M. and Peterson, J. R. 1964, Information capacity of discrete motor responses, Journal of Experimental Psychology, 67, 103-112. https://psycnet.apa.org/doi/10.1037/h0045689
Gibbs, M. 1993, March/April, Handwriting recognition: A comprehensive comparison, Pen, pp. 31-35.
Gregg, J. R., Leslie, L. A. and Zoubek, C. E. (eds). 1972, Gregg shorthand dictionary (McGraw-Hill, New York). https://cir.nii.ac.jp/crid/1130282271932553088
Goldberg, D. and Goodisman, A. 1991, Stylus user interfaces for manipulating text, Proceedings of the ACM SIGGRAPH and SIGCHI Symposium on User Interface Software and Technology, 127-135. https://dl.acm.org/doi/pdf/10.1145/120782.120796
Goldberg, D. and Richardson, D. 1993, Touch-typing with a stylus, Proceedings of the INTERCHI'93 Conference on Human Factors in Computing Systems, 80-87. https://dl.acm.org/doi/pdf/10.1145/169059.169093
Gould, J. D., Greene, S. L., Boies, S. J., Meluson, A. and Rasamny, M. 1990, Using a touchscreen for simple tasks, Interacting with Computers, 2, 59-74. https://doi.org/10.1016/0953-5438(90)90014-9
Hick, W. E. 1952, On the rate of gain of information, Quarterly Journal of Experimental Psychology, 4, 11-26. https://doi.org/10.1080/17470215208416600
Hyman, R. 1953, Stimulus information as a determinant of reaction time, Journal of Experimental Psychology, 45, 188-196. https://psycnet.apa.org/doi/10.1037/h0056940
IBM Corporation. 1984, IBM personal computer hardware reference library: Technical reference, revised edition [Report #6361453] (IBM Corp., Boca Raton, Florida).
Kerr, B. A. & Langolf, G. D. 1977, Speed of aiming movements. Quarterly Journal of Experimental Psychology, 29, 475-481. https://doi.org/10.1080/14640747708400623
Kurtenbach, G., Moran, T. P. and Buxton, W. 1994, Contextual animation of gestural commands, Proceedings of Graphics Interface '94, 83-90. https://doi.org/10.1111/1467-8659.1350305
Landauer, T. K. and Nachbar, D. W. 1985, Selection from alphabetic and numeric menu trees using a touch screen: Breadth, depth, and width, Proceedings of the CHI'85 Conference on Human Factors in Computing Systems, 73-78. https://doi.org/10.1145/1165385.317470
MacKenzie, I. S. 1992, Fitts' law as a research and design tool in human-computer interaction, Human-Computer Interaction, 7, 91-139.
MacKenzie, I. S. and Buxton, W. 1992, Extending Fitts' law to two-dimensional tasks, Proceedings of the CHI'92 Conference on Human Factors in Computing Systems, 219-226. https://doi.org/10.1145/142750.142794
MacKenzie, I. S., Nonnecke, B., McQueen, C., Riddersma, S. and Meltz, M. 1994, A comparison of three methods of character entry on pen-based computers, Proceedings of the 1994 Human Factors and Ergonomics Society 38th Annual Meeting. https://doi.org/10.1177/154193129403800430
MacKenzie, I. S., Sellen, A. and Buxton, W. 1991, A comparison of input devices in elemental pointing and dragging tasks, Proceedings of the CHI '91 Conference on Human Factors in Computing Systems, 161-166. https://dl.acm.org/doi/pdf/10.1145/108844.108868
Mayzner, M. S. and Tresselt, M. E. 1965, Tables of single-letter and digram frequency counts for various word-length and letter-position combinations, Psychonomic Monograph Supplements, 1(2), 13-32. https://psycnet.apa.org/record/1967-02842-001
Plaisant, C. and Sears, A. 1992, Touchscreen interfaces for flexible alphanumeric data entry, Proceedings of the 36th Annual Meeting of the Human Factors Society, 293-297. https://api.drum.lib.umd.edu/server/api/core/bitstreams/12290c08-2599-43bb-add3-8e4d0a61edb1/content
Potosnak, K. M. (1988). Keys and Keyboards. In M. Helander (Ed.). Handbook of human-computer interaction (pp. 475-494). Amsterdam: Elsevier. https://doi.org/10.1016/B978-0-444-70536-5.50026-9
Sears, A. 1991, Improving touchscreen keyboards: Design issues and a comparison with other devices, Interacting with Computers, 3, 252-269. https://doi.org/10.1016/0953-5438(91)90016-U
Sears, A., Revis, D., Swatski, J., Crittenden, R. and Shneiderman, B. 1993, Investigating touchscreen typing: The effect of keyboard size on typing speed, Behaviour & Information Technology, 12, 17-22. https://doi.org/10.1080/01449299308924362
Underwood, B. J. and Schulz, R. W. 1960, Meaningfulness and verbal learning (Lippincott, New York). https://psycnet.apa.org/record/1961-03113-000
Van Cott, H. P. and Kinkade, R. G. (eds.) 1972, Human engineering guide to equipment design (U.S. Government Printing Office, Washington). https://books.google.ca/books?hl=en&lr=&id=Ns9gtcn3xZsC&oi=fnd&pg=PA2&ots=mu3-qedNeW&sig=UNaehrjZxQA2R5QX5VojZEhVjTc&redir_esc=y#v=onepage&q&f=false
Veniola, D. and Neiberg, F. 1994, T-cube: A fast, self-disclosing pen-based alphabet, Proceedings of the CHI'94 Conference on Human Factors in Computing Systems, 265-270. https://dl.acm.org/doi/pdf/10.1145/191666.191761
Welford, A. T. 1968, Fundamentals of Skill (Methuen, London). https://gwern.net/doc/psychology/1968-welford-fundamentalsofskill.pdf
Wilkund, M. E. and Dumas, J. S. 1987, Optimizing a portable terminal keyboard for combined one-handed and two-handed use, Proceedings of the 31st Annual Meeting of the Human Factors Society, 585-589. https://doi.org/10.1177/154193128703100524
Wolf, C. G. and Morrel-Samuels, P. 1987, The use of hand-gestures for text-editing, International Journal of Man-Machine Studies, 27, 91-102. https://doi.org/10.1016/S0020-7373(87)80045-7