Isokoski, P., & MacKenzie, I. S. (2003). Metrics for text entry research: Combined model for text entry rate development. Extended Abstracts of the ACM Conference on Human Factors in Computing Systems - CHI 2003, pp. 752-753. New York: ACM.
Combined Model for Text Entry Rate Development
P. Isokoski and I. Scott MacKenzie
Unit for Computer-Human Interaction (TAUCHI)Department of Computer and Information Sciences
FIN - 33014 University of Tampere, Finland
{poika,scott}@cs.uta.fi
ABSTRACT
We combine the power law of learning and theoretical upper limit predictions to describe the development of text entry rates from users' first contact to asymptotic expert usage. The combined model makes comparing text entry methods easier. We present the rationale for the model and two candidate implementations. The first is a simple regression model with a reasonable fit to the data. The second fits measured data better, but is more complicated.Keywords
power law of learning, text entry, modeling
INTRODUCTION
The merits of text entry methods such as handwriting or touch-typing depend on the entry speed achievable. Slower methods are often justified if users lack skill in a faster method. Thus, two critical characteristics of text entry methods are expert performance and the practice required to achieve it.
A model based on the power law of learning [1] is built using text entry rate data measured in a longitudinal experiment. The model is of the form RN = aNx where N is the session number and RN is the text entry rate predicted for session N. a and x are regression constants.
Models for upper limit or expert performance include those for stylus operated soft keyboards [5], two-thumb text entry on physical keyboards [3], and unistroke writing time [2].
PROBLEMS WITH THE MODELS
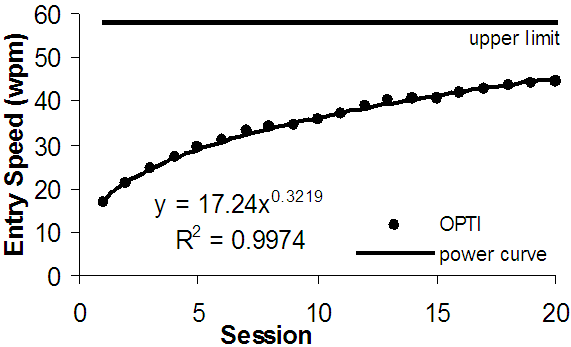
The power law curve usually fits the measured data remarkably well (see Figure 1). However, the predicted text entry rate grows to infinity given enough practice. In reality an upper limit is encountered at some point. This means the power curve is good for describing experimental results (examples in [1, 4]), but has limited reliability as a predictor (as for example in [4]).
There are procedures for calculating the upper limit, however they do not predict the time to reach the limit. The purpose herein is to fix this by estimating the whole learning process.
Upper limit models are built using variables for the minimum time for primitive actions. Consequently wrong values produce wrong predictions. The combined model described here is subject to this same limitation, thus care is warranted to ensure that the underlying assumptions are correct and appropriate given the situation that is modeled.

Figure 1. Data for the OPTI soft-keyboard, upper limit, and best fitting power curve by MacKenzie and Zhang [4].
THE COMBINED MODEL
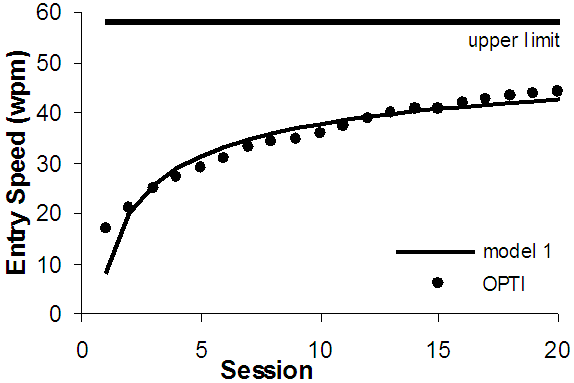
Combining the power model and the upper limit model requires a function that initially follows a power curve but is later constrained by the upper limit. A straightforward way to meet these requirements is to first recode the measured text entry rates as Rmax - Re where Rmax is the upper limit prediction and Re the measured entry rate during a session. The result in Figure 2 uses the same data as Figure 1. The "model 1" curve shows Rmax minus the value produced by the regression model. Although the model works reasonably well (R2 = 0.92), it underestimates toward the end of the data.
To improve the fit of the model we propose a second model where the text entry rate for a session is that of the preceding session plus a difference calculated using the power curve and the modeled upper limit. To simplify the following equation we use DN for the difference in consecutive sessions: DN = aNx - a(N - 1)x. With this definition our model is:

The exponent z adjusts the shape of the transfer from the power curve to the upper limit. We use z = Rmax / (Rmax - Rlast) + 1, where Rlast is the highest measured text entry rate. The goal is to keep the predictions close to the observations for the duration of the measured data and then have them approach the upper limit.

Figure 2. Model 1 and the measured data.
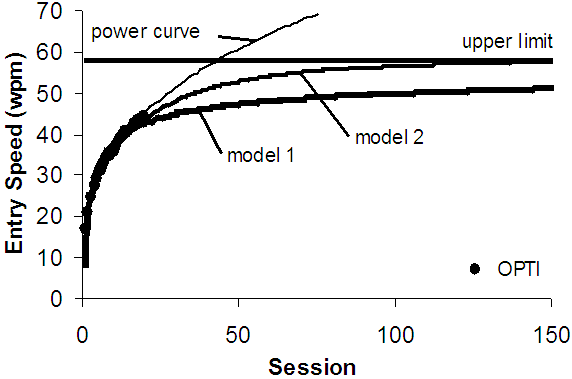
While the model seems complicated, it is easy to implement in an ordinary spreadsheet. Figure 3 shows the result using the same data. To show long-term behavior the scale extends to 150 sessions. As seen, the best fitting power curve exceeds the theoretical upper limit somewhere around session 50. Models 1 and 2 approach the upper limit at a decreasing rate, as they should. The difference is that model 1 under-estimates the last measured sessions and most likely several sessions after. Model 2 under-estimates too, but not so much.

Figure 3. Long-term behavior of the models.
DISCUSSION
We are still examining models that fit the measured data better than model 1 but are simpler than model 2. The assessment of the theoretical foundations of the models is also work in progress. However, even our current imperfect models do a better job at describing the whole learning process than either of the component models.
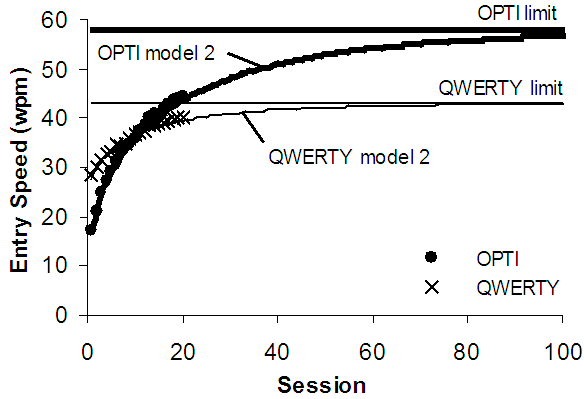
Furthermore, they provide a clear graphical representation of a text entry method that facilitates comparisons with other methods. The method with the greatest area below the modeled curve during the period of interest is the best. A good method starts high, has a high upper limit, and reaches the upper limit fast. A not-so-good method exhibits a combination of the opposite symptoms. Figure 4 is an example of this kind of comparison. The QWERTY soft keyboard layout is initially faster, but after session 11 the OPTI layout is faster and according to the models it will remain so.

Figure 4. Comparing text entry methods (data from [4]).
In the examples above we used data from only one experiment. While other data sets produce similar results, we have not yet tested our models against all available data.
CONCLUSIONS
We described models combining the traditional power law regression model and upper limit prediction model of text entry rate. We then proposed two models that satisfy these requirements. The models have both descriptive and predictive uses in comparing text entry methods.
REFERENCES
1. Card, S. K., Moran, T. P., and Newell, A., The psychology of human-computer interaction, Lawrence Erlbaum, 1983.
2. Isokoski, P., Model for unistroke writing time. Proc. CHI 2001, 357-364.
3. MacKenzie, I. S., and Soukoreff, R. W., A model of two-thumb text entry. Proc. GI 2002, 117-124.
4. MacKenzie, I. S., and Zhang, S. X., The design and evaluation of a high-performance soft keyboard. Proc. CHI '99, 25-31.
5. Soukoreff, R. W., and MacKenzie, I. S. Theoretical upper and lower bounds on typing speed using a stylus and soft keyboard. Behaviour & Information Technology, 14, 370-379, 1995.