Miniotas, D., Špakov, O., Tugoy, I., & MacKenzie, I. S. (2006). Speech-augmented eye gaze interaction with small closely spaced targets. Proceedings of the Symposium on Eye Tracking Research and Applications – ETRA 2006, pp. 67-72, 175. New York: ACM.
Speech-Augmented Eye Gaze Interaction with Small Closely Spaced Targets
Darius Miniotas1, Oleg Špakov2, Ivan Tugoy2, I. Scott MacKenzie3
1Department of Electronics EngineeringŠiauliai University
76353 Šiauliai, Lithuania
dminiotas@tf.su.lt
2Department of Computer Science
University of Tampere
33014 Tampere, Finland
{oleg, ivan}@cs.uta.fi
3Department of Computer Science
York University
Toronto, Canada M3J 1P3
mack@cs.yorku.ca
Abstract
Eye trackers have been used as pointing devices for a number of years. Due to inherent limitations in the accuracy of eye gaze, however, interaction is limited to objects spanning at least one degree of visual angle. Consequently, targets in gaze-based interfaces have sizes and layouts quite distant from "natural settings". To accommodate accuracy constraints, we developed a multimodal pointing technique combining eye gaze and speech inputs. The technique was tested in a user study on pointing at multiple targets. Results suggest that in terms of a footprint-accuracy tradeoff, pointing performance is best (≅93%) for targets subtending 0.85 degrees with 0.3-degree gaps between them. User performance is thus shown to approach the limit of practical pointing. Effectively, developing a user interface that supports hands-free interaction and has a design similar to today's common interfaces is feasible.CR Categories: H.5.2 [Information Interfaces and Presentation]: User Interfaces – Input Devices and Strategies, Interaction Styles
Keywords: eye tracking, eye-based interaction, pointing, human performance
1 Introduction
Within the community of HCI researchers and system designers, developing an efficient alternative to traditional manually operated interfaces is a major challenge. Such an interface should not depend solely on inputs from the keyboard and conventional pointing devices such as a mouse. Instead, the interface should employ as inputs other, more natural, communication abilities of the user. Speech, gestures, and eye gaze are frequent candidates for this. Even though these inputs alone are inherently ambiguous, interaction is made feasible by combining two or more inputs in an appropriate way [Oviatt 1999].Among the options for combined input, speech and eye gaze have not yet gained much popularity. Nevertheless, due to the strong synergy, a fully functional interactive system is possible – with eye gaze employed in locating objects and speech for commands. Indeed, prior work demonstrates that integrating eye tracking and speech recognition technologies yields a reasonable amount of hands-free control over a graphical user interface [Koons et al. 1993; Tanaka 1999; Zhang et al. 2004]. Practical application of such multimodal interfaces, however, still presents a challenge as described below.
In the field of eye gaze-based interfaces, there are successful implementations manifesting the ability of the eye to function as a pointing device [Jacob 1995]. Nevertheless, the design of those user interfaces renders them quite distant from what is perceived as "natural" (i.e., today's standard GUIs with their widgets). One of the major differences is the size of on-screen objects.
Most standard GUI widgets (e.g., icons in a toolbar, checkboxes, etc.) span less than one degree of visual angle. For instance, a toolbar's icon in a standard MS WindowsTM application (e.g., MS WordTM) is 24 by 24 pixels in size. This translates into approximately 0.7 degrees for a 17-inch monitor with a resolution of 1024 × 768 and a viewing distance of 70 centimeters. Meanwhile, the size of a button in a window's title bar is even smaller (only 16 by 16 pixels, or 0.46 degrees). Moreover, icons in a toolbar are usually aligned side by side: there is no space between!
In traditional applied eye tracking research, however, targets below the one-degree limit are considered too small for facile eye gaze interaction [Jacob 1995; Ware and Mikaelian 1987]. Consequently, gaze-operated objects are made substantially bigger to ensure facile interaction (i.e., to bring gaze pointing to the level of practical accuracy). This measure accommodates calibration errors of the eye tracker as well as inherent limitations in the accuracy of eye gaze.
For the same reason, objects are also spaced on the screen at relatively large distances from one another. In turn, this poses problems in managing the real estate of the screen. Therefore, it is not surprising that, apart from applications for people with disabilities, current gaze- based interfaces are still rare in solutions for the general population of computer users.
Given the constraints on the accuracy of gaze-based pointing, it is intriguing to explore the extent that user performance may approach the level of practical pointing when eye gaze is supplemented with other input modalities such as speech. Despite considerable interest in multimodal applications, there are only few empirical studies aiming to evaluate user performance in multimodal pointing tasks.
Recently, Zhang et al. [2004] experimented with a multimodal system involving eye gaze and speech. Their setup included a 6 × 5 grid of geometric figures used as targets. The figures varied in shape (rectangle, oval, triangle), size (two levels), and color (10 levels). The size of the smaller figures was 13 × 9 mm (1.1 × 0.74 degrees at a viewing distance of 70 cm).
This presents an interesting case as the target's size approaches the critical one-degree barrier. On the other hand, the distance between the centers of adjacent targets in the grid was substantially bigger than that: 40 mm (3.27 degrees) horizontally and 27 mm (2.19 degrees) vertically. In turn, this made the overall layout used in their study impractical for modeling interactions similar to those in conventional GUIs.
To obtain a more relevant model, we developed a gaze-based interface featuring tightly spaced targets reasonably close in size to that of the smallest GUI widgets. To meet the challenge of pointing at targets smaller than the one-degree limit, eye gaze input was augmented by speech.
This paper presents an experiment conducted to compare user performance in a point-select task using two modes of interaction: unimodal (i.e., gaze-only) and multimodal (gaze and speech).
2 Method
2.1 Participants
Twelve unpaid volunteers (6 male, 6 female) participated in the study. All were employees at a local university aged 22 to 43. All but one had prior experience with eye tracking, whereas only one had used speech as computer input before. One participant specified English as her first language, whereas the rest were non-native speakers of English. Six participants wore glasses, six required no correction of vision.
2.2 Apparatus
A remote eye tracking system iView XTM from SensoMotoric Instruments was used for collecting gaze data. Eye gaze input and associated events were recorded using experimental software developed in our laboratory. The screen resolution was 1024 × 768. Speech input was recorded with a conventional microphone and processed using Microsoft SAP Interface 5.1.
2.3 Procedure
Participants were seated at a viewing distance of approximately 70 cm. The experiment used a point-select task. At the onset of each trial, a home box appeared on the screen. It was visible to participants as a 30-by-30-pixel square (Figure 1). The actual size of the home box, however, was 100 × 100 pixels. The expansion in motor space facilitated homing through increased tolerance to instabilities in calibration of the eye tracker. On the other hand, making only the central portion of the home box visible ensured bringing the gaze closer to the center of the box.
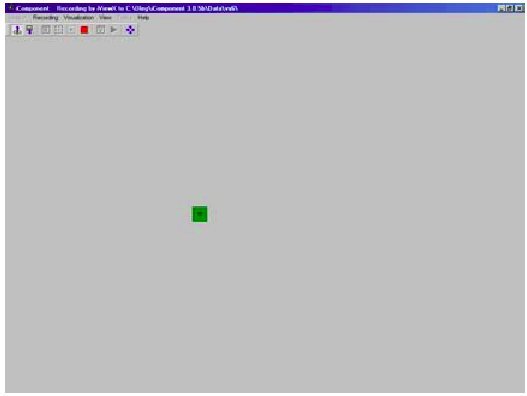
Figure 1: Home box at the onset of trial
Upon fixating on the home box for one second, a matrix of 5 × 5 squares appeared to the right of the home box (Figure 2). One of the squares was the target to be selected (marked with a cross). Participants were instructed to look at the target as quickly as possible, and fixate upon it until selection. Timing started when the matrix appeared, and ended when selection occurred. A window of five seconds was given to complete a trial. If no selection occurred within five seconds, an error was recorded. Then, the next trial followed.
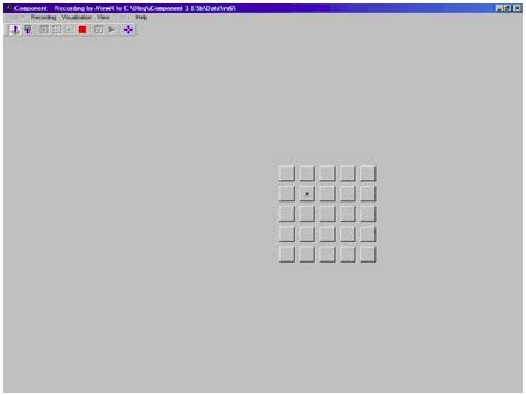
Figure 2: Matrix of 5 × 5 squares. The target for selection is the square marked with a cross.
We defined the eye's region of interest (ROI) representing the focus of visual attention as a 100-by-100-pixel square with its center attached to the current gaze point location. As the gaze approached the target, the ROI began to overlap with the matrix area. The squares within the matrix that were encompassed by the overlapping area became highlighted in different colors (Figure 3).
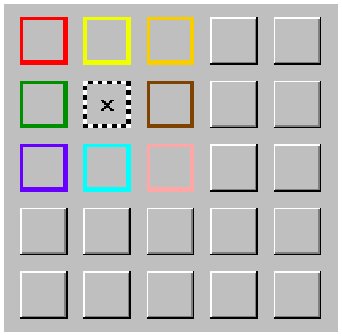
Figure 3: Highlighted squares signaling overlap of the eye's region of interest with the matrix. The black dashed outline shows the current gaze point location.
The color-coding scheme included fifteen colors listed in the following order: red, green, blue, yellow, purple, aqua, orange, brown, pink, lime, gray, olive, magenta, sky-blue (vocally referred to as "sky"), and black. The coding was arranged so that the first color in the list (i.e., red) was assigned to the first square in the matrix to enter the ROI. Then, the second square encompassed by the ROI was highlighted in green, and so on. If more than fifteen squares were inside the ROI (this quite often being the case for the smallest target size used in the experiment), only the first fifteen were highlighted in corresponding colors, whereas the remaining ones stayed unchanged.
Moreover, the color-coding scheme used was tolerant to instabilities in the gaze point location caused by inherent eye jitter (see [Jacob 1995]). As the ROI is centered on the current gaze point, random shifts in the spatial location of the ROI are also inevitable. In turn, this causes the squares within the ROI to flicker in different colors, if color mapping were simply based on the current location of the ROI.
To avoid this, the same color stayed with a target for the rest of the trial once mapped initially as long as the attention was not shifted to other areas of the screen (i.e., no saccade – sudden motion of the eye – occurred in between). If at any moment, attention moved away from the current selection of the matrix squares, the squares were de-highlighted releasing the colors for subsequent selections.
No visual feedback was provided for the gaze point unless it entered the matrix. When the gaze point landed on a square in the matrix, the square was highlighted with a black dashed outline (Figure 3).
Prior to the first session, participants were shown a table displaying the fifteen colors for color-coding of the matrix squares (Figure 4). They were asked to memorize the color names for the experimental condition involving speech input. After this initial introduction, participants practiced one block using speech commands. Then, data recording began.
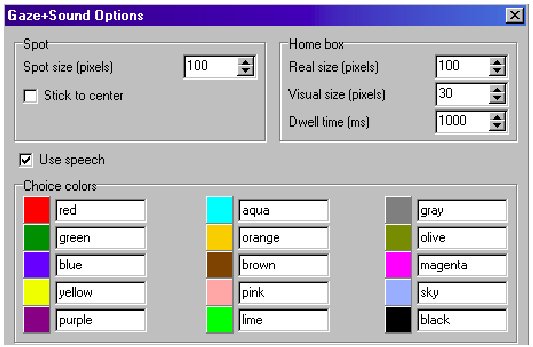
Figure 4: Table shown to participants with the fifteen colors used in the color-coding of the matrix squares
Participants were given an opportunity to look at the table with the colors to refresh their memory when needed before a block of trials started.
The strategies used by participants for target selection depended on the input modality. In the combined gaze and speech condition, if the square with the dashed outline was other than the target, participants were to say aloud the color of the target's highlight.
This way they were given an opportunity to compensate for the inherent limitations in the accuracy of eye gaze, as well as the drift in the eye tracker's calibration. Meanwhile, in the gaze-only condition, participants could do very little to prevent an erroneous selection if the gaze did not match the target.
2.4 Design
The experiment was a 2 × 3 × 3 × 3 × 9 repeated measures factorial design. The factors and levels were as follows:
| Pointing Modality | gaze & speech, gaze-only |
| Dwell Time (DT) | 1000, 1500, 2000 ms |
| Target Size (S) | 20, 30, 40 square pixels |
| Inter-target Gap (G) | 0, 10, 20 pixels |
| Trial | 1, 2…9 |
Here, G denotes gap between the sides of adjacent squares in the matrix.
Participants were randomly assigned to one of three groups. Each group received the dwell time conditions in a different order using a Latin square. Order of presenting the pointing modality conditions was also counterbalanced among participants.
For each DT condition, participants performed 6 blocks of trials (3 blocks per modality) in one session. The three sessions were run over consecutive days with each lasting approximately 20 minutes. Each block consisted of the 9 S-G conditions presented in random order. For each S-G condition, 3 trials were performed in the same block (in total, 3 trials × 3 blocks = 9 trials). Thus, a block consisted of 27 trials.
The conditions above combined with 12 participants resulted in 5832 total trials in the experiment. The dependent measures were movement time (MT) and error rate (ER).
3 Results
3.1 Pointing Performance
The grand means on the two dependent measures were 3029 ms for MT and 34.3% for ER. The main effects and interactions on each dependent measure are presented below.
3.1.1 Speed
The mean MT was 3449 ms in the gaze-only condition and 2609 ms in the gaze & speech condition. Thus, with the addition of speech, MT decreased 24%. The difference was statistically significant (F1,11 = 45.3, p < .001). While MT was high overall, it is important to remember that the dwell time selection criterion inherently adds to MT, either 1, 1.5, or 2 seconds, depending on the condition.As expected, the 1000-ms DT condition was the fastest with a mean MT of 2605 ms. The 1500-ms DT condition was slower by 17% (3041 ms), and the 2000-ms DT condition by 32% (3442 ms). The main effect for DT was statistically significant (F2,22 = 94.4, p < .001), as was the input modality × DT interaction (F2,22 = 5.9, p < .01). The main effects and interaction are illustrated in Figure 5.
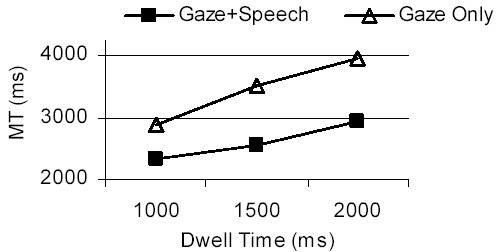
Figure 5: MT vs. DT for the two input conditions
As seen in Figure 6, target size also significantly influenced pointing time (F2,22 = 63.3, p < .001). The input modality × target size interaction was significant as well (F2,22 = 25.0, p < .001).
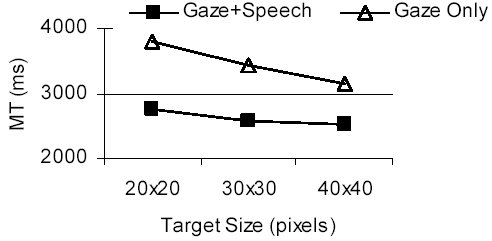
Figure 6: MT vs. target size for the two input conditions
For the largest target (40 × 40 pixels), MT was on average 3132 ms in the gaze-only condition, whereas with addition of speech it dropped to 2515 ms (a reduction by 20%). As expected, the benefit of combined input was the highest for the smallest target (20 × 20 pixels): 3793 ms vs. 2741 ms (a reduction in MT of 28%).
3.1.2 Accuracy
The mean ER was 51.1% in the gaze-only condition and 17.4% in the gaze & speech condition. Thus, with addition of speech, ER dropped on average by as much as 66%. The difference was statistically significant (F1,11 = 48.8, p < .001).The lowest error rate was in the 1500-ms condition (32%). It was followed by the 2000-ms condition at 35.2% errors, and the 1000-ms condition at 35.6%. The differences were not significant (F2,22 = 0.8, ns). The input modality × DT interaction, however, was significant (F2,22 = 5.8, p = 0.01). In the gaze-only condition, more errors occurred as dwell time increased (Figure 7). With addition of speech, however, error rate decreased markedly as dwell time increased from 1000 ms to 1500 ms, and then remained at the same level with a further increase in dwell time by 500 ms.
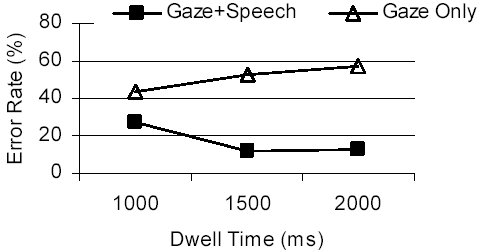
Figure 7: ER vs. DT for the two input conditions
As with pointing time, target size also had a significant effect on error rate (F2,22 = 77.6, p < .001). The input modality × target size interaction was significant as well (F2,22 = 27.3, p < .001). For the largest target (40 × 40 pixels), the error rate was on average 34.2% in the gaze-only condition, whereas with addition of speech it dropped to 12.1% (a reduction by 65%). For the two smaller sizes, a similar reduction in error rate was observed with speech employed (Figure 8).
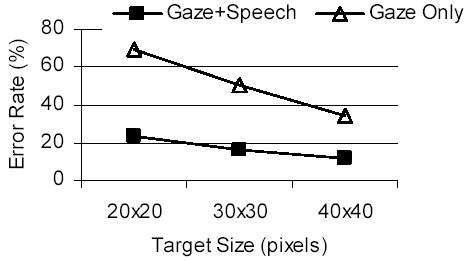
Figure 8: ER vs. target size for the two input conditions
In the combined input condition, inter-target gap also significantly affected error rate (F2,22 = 14.3, p < .01). It is not surprising that pointing accuracy was relatively poor when targets were side by side (0-pixel gap). Interestingly, however, there was no significant difference between the error rates obtained for the 10-pixel and 20-pixel gap conditions (Figure 9). In other words, for practical pointing, a 10-pixel gap between targets is almost as good as a gap twice that size.

Figure 9: ER vs. target size and inter-target gap (in pixels) for the gaze & speech condition
A further insight on the extended limits of pointing accuracy with speech-augmented eye gaze input is obtained when error rate is plotted with target size and inter-target gap for the three DT conditions separately (Figure 10).
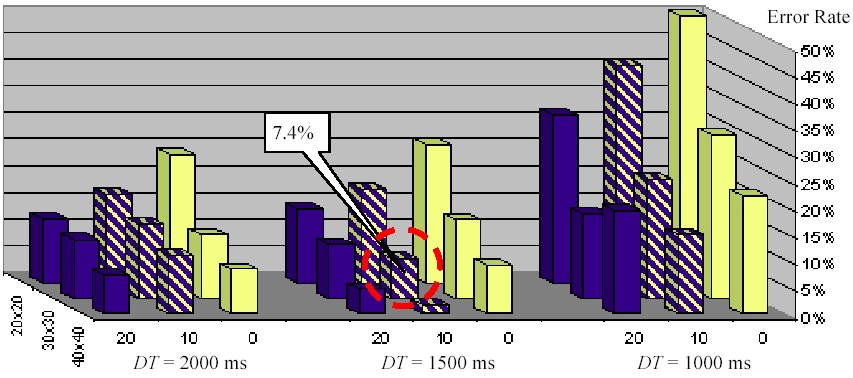
Figure 10: Error rate vs. dwell time, target size, and inter-target gap for the gaze & speech condition
When the shortest dwell time (1000 ms) was used for target selection, error rates for different combinations of target size and inter-target gap levels ranged from 15% to 50%. Error rates obtained for the other two DT conditions are much lower and do not significantly differ from one another between the conditions. They range from 2% to 26% and from 7% to 24% for the 1500-ms and 2000-ms conditions, respectively.
3.2 Performance by Colors
Some additional information on the factors contributing to errors in the present study are obtained by taking a closer look at the performance of the color-coding scheme for target identification. The five colors most frequently mapped to the target for selection were: green, blue, yellow, purple, and aqua. They each had a share of over 8% with the total share equal to 51.7%. The remaining 48.3% were split between the other ten colors (Figure 11).
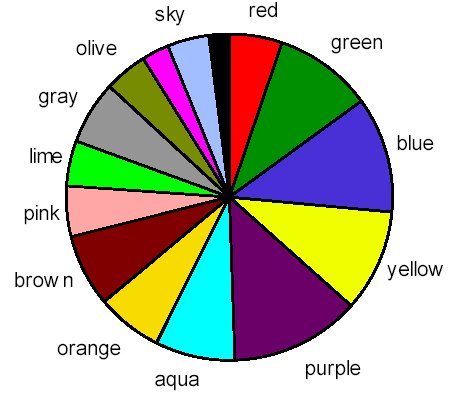
Figure 11: Distribution of target highlight colors
The percentage of the target highlight colors correctly specified by participants and recognized by the system varied among the colors. The colors with the correct selection rate above 90% were: green, blue, yellow, orange, brown, lime, sky-blue, and black (Figure 12). On the other hand, the most problematic colors for the international pool of our participants were magenta (65.1%) and purple (64.3%).
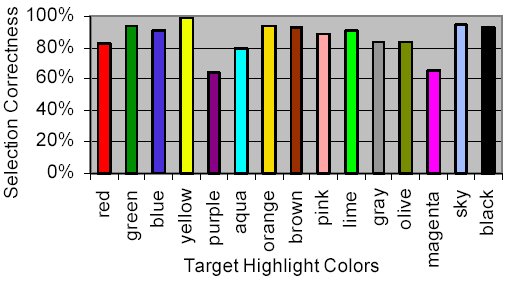
Figure 12: Correct target selection rate as a function of its highlight color
Of all the cases involving erroneous identification of magenta, pink had the biggest share. Thus, participants may have associated the less-familiar color magenta with the better-known pink. Meanwhile, purple was most frequently mistaken for blue or brown. Moreover, we noticed that false identifications of purple were quite often due to speech recognition errors, as opposed to the actual vocal output by participants.
These observations demonstrate that there are areas of improvement for the color-coding scheme. In our future designs we will be more careful when selecting colors, so that the challenges for the cognitive and vocal abilities of international users are minimized.
4 Conclusions
Our results suggest that the best performance (in terms of footprint-accuracy tradeoff) is expected using the following conditions: 1500-ms dwell time, 30-by-30-pixel target size, and 10-pixel inter-target gap. This combination (shown by dashed circle in Figure 10) yielded an average error rate of 7.4% (a mean of 108 trials in total: 12 participants × 9 trials). To better visualize the geometry on the real scale, Figure 13 displays a fragment of the experimental setup (the lower part) placed next to the actual GUI controls in the experimental software's window (the upper part).
Figure 13: The size and layout suggested for buttons in a gaze-and-speech interface compared to a toolbar's buttons in a common manually operated GUI
This is an important finding since user performance in a gaze-based selection task approaches that of practical pointing. Moreover, the finding is consistent with the level of accuracy reported for the gaze-assisted manual pointing [Zhai et al. 1999]. In effect, it means that in terms of accuracy there are no fundamental limits for combined gaze and speech input to become an alternative pointing technique just as good as manual pointing with devices such as an isometric pointing stick in notebook computers [Zhai et al. 1999].
The major shortcoming of the speech-augmented gaze pointing technique presented in this study is its relatively low speed. To match the cognitive demands associated with recalling a target's referential attribute (color in the current implementation) and then producing vocal output, dwell time for selection had to be increased substantially. According to our data, accuracy is satisfactory when dwell time reaches 1500 ms. This is in sharp contrast to the common setting for the gaze-only modality, which is on the order of a few hundred milliseconds. The cost in speed, however, is offset by a dramatic reduction in error rate. As this study shows, the use of speech reduces the overall error rate by almost two thirds compared to the outcome for pointing by eye gaze alone.
By improving the scheme for target coding, we expect to significantly reduce dwell time while maintaining pointing accuracy at the level currently achieved. In turn, this will improve the overall speed-accuracy tradeoff. Another possibility is to use a different speech-to-target mapping. For example, the eight highlighted targets in Figure 3 could be mapped to compass directions ("north", "north-east", "east", etc.).
Another important issue is an adequate definition of the eye's region of interest (ROI). In the current implementation, we used a fixed value of 100 by 100 pixels for all target sizes. Intuitively, however, the extent of the ROI should depend on target size: the smaller the target, the smaller the region to accommodate the same number of objects within the region (in other words, to keep the probability of erroneous selection at the same level). We intend to find the best solution for defining the ROI in our future studies.
Acknowledgments
This research was funded by grant #103174 to Miniotas from the Academy of Finland. Oleg Špakov was supported by the UCIT Graduate School, and Ivan Tugoy by CIMO. Support from the Academy of Finland (project 53796) for MacKenzie is also greatly appreciated.
References
JACOB, R. J. K. 1995. Eye Tracking in Advanced Interface Design. In W. Barfield & T. A. Furness (Eds.), Virtual Environments and Advanced Interface Design. New York: Oxford University Press, 258-288.KOONS, D. B., SPARRELL, C. J., and THORISSON, K. R. 1993. Integrating Simultaneous Input from Speech, Gaze, and Hand Gestures. In M. Maybury (Ed.), Intelligent Multimedia Interfaces. Menlo Park, CA: MIT Press, 257-276.
OVIATT, S. 1999. Mutual Disambiguation of Recognition Errors in a Multimodal Architecture. In Proceedings of ACM SIGCHI 99, New York: ACM Press, 576-583.
TANAKA, K. 1999. A Robust Selection System Using Real-Time Multimodal User-Agent Interactions. In Proceedings of ACM IUI 99, New York: ACM Press, 105-108.
WARE, C. and MIKAELIAN, H. H. 1987. An Evaluation of an Eye Tracker as a Device for Computer Input. In Proceedings of ACM SIGCHI+GI 87, New York: ACM Press, 183-188.
ZHAI, S., MORIMOTO, C., and IHDE, S. 1999. Manual and Gaze Input Cascaded (MAGIC) Pointing. In Proceedings of ACM SIGCHI 99, New York: ACM Press, 246-253.
ZHANG, Q., IMAMIYA, A., GO, K., and MAO, X. 2004. Resolving Ambiguities of a Gaze and Speech Interface. In Proceedings of ETRA 2004, New York: ACM Press, 85-92.