Akamatsu, M., MacKenzie, I. S., (2002). Changes in applied force to a touchpad during pointing tasks. International Journal of Industrial Ergonomics, 29, 171-182. [software]
Changes in Applied Force to a Touchpad
During Pointing Tasks
Motoyuki Akamatsu1 and I. Scott MacKenzie2
1 Human Environment System DepartmentNational Institute of Bioscience and Human Technology (NIBH)
1-1 Higashi
Tsukuba 305-8566, Japan
Email: akamatsu@nibh.go.jp
Voice: 298-61-6630
Fax: 298-61-6634
2Department of Computer Science
York University
4700 Keele Street
Toronto, Ontario
Canada, M3J 1P3
Email: smackenzie@acm.org
Voice: 416-736-2100
Fax: 416-736-5757
Abstract
We measured the force applied to a touchpad during pointing tasks for large and small targets. A mouse was also used as a baseline condition. Our set-up to measure force included a Plexiglas plate mounted on a high-sensitivity three-axis strain gauge connected to an instrumentation amplifier and a data acquisition computer. The devices were positioned and operated on top of the plate with the selection button removed and actuated by the opposite hand. An experiment used twelve participants performing point-select tasks in conformance with ISO 9241-9. At the terminal phase of the selection tasks, the applied force with the touchpad was lower than that recorded with the mouse. These differences may be the source of overall performance differences between the two devices. It is suggested that the detected finger force should be a variable in the touchpad's transfer function to afford a better blend of coarse and fine positioning strategies, with the goal being to bring the touchpad more inline with the mouse in overall user performance.Relevance to Industry: reports measurements of applied force the touchpad and mouse pointing devices; demonstrates different strategies employed by users in the final phase of cursor positioning in target selection tasks; presents opportunities to improve cursor positioning with touchpads through a transfer function optimized for the applied finger force on the pad surface.
Keywords: computer pointing devices, touchpads, transfer functions, applied finger force during touchpad interaction
1. INTRODUCTION
The popularization of the graphical user interface (GUI) began in 1984 with the Apple Macintosh. Since then, GUIs have evolved and matured. A key feature of a GUI is a pointing device and "point-and-click" interaction. Today, pointing devices are routinely used by millions of computer users.The pointing device most common in desktop systems is the mouse, although others are also available, such as trackballs, joysticks, and touchpads. For portable computers, such as laptops or notebooks, the choice of pointing device is more limited, however. Due to the constrained operating space, a mouse is generally not practical, and, so, an alternative pointing device is used.
Early portable computers used either a joystick or trackball as the pointing device. This changed in 1994 when Apple Computer, Inc. (Cupertino, CA) introduced the PowerBook 500 series of notebook computers, the first commercial computer with a built-in touchpad as a pointing device (MacNeill & Blickenstorfer, 1996). Since then, numerous notebook computer manufacturers also adopted this technology. Today, the trackball is all but extinct in notebook computers. Joystick usage is also down, with IBM and Toshiba remaining as the key players. The touchpad is now the predominant pointing technology for notebook computers.
Among the touchpad's important features are price and size. It is very inexpensive to manufacture in large quantities, and it is very thin and is easily installed within the tight confines of a notebook computer. However, comparative evaluations have established that pointing performance is poor in comparison with a mouse (Douglas et al., 1999, MacKenzie et al., 2001, MacKenzie & Oniszczak, 1998).
This research is motivated by the need to improve the touchpad as an input device — to bring it closer to a mouse in pointing performance. We investigated user interaction with the touchpad by measuring the finger force applied to the pad during pointing tasks. We also measured the force for the same tasks performed with a mouse. This paper reports the results of this investigation.
1.1. Control-Display Relationship
One of the primary functions of a system's pointing device is to control the on-screen movement of the cursor. This is characterised by the control-display relationship. Where the relationship is a simple linear one, the term C-D gain is used. For example, if 3 units of controller movement yield 4 units of cursor movement, C-D gain is 3:4, or 0.75. As noted by Greenstein and Arnaut (1988), user performance in target acquisition tasks on touch-sensitive tablets is better with gains in the range of 0.8 to 1.0 than with higher gains or lower gains.However, gain settings involve a trade-off between gross positioning time (getting to the vicinity of a target) and fine positioning time (the final acquisition), an effect first noted by Jenkins and Conner (1949). With a high gain setting, users can quickly manoeuvre the cursor to the vicinity of the target, but final acquisition of the target is exacerbated by the difficulty in precisely controlling the final position of the cursor. Low gain settings, on the other hand, facilitate fine positioning of the cursor, but increase the time to advance the cursor over large distances.
There are other factors affecting the control-display relationship, such as whether the input device operates in relative or absolute mode. Touchpads and mice operate in relative mode, wherein the relative displacement of the finger on the touchpad's surface, or the mouse on the mousepad's surface, is used to advance the cursor relative to its current position. Since the input surface is small compared with the size of the output display, a higher gain combined with a non-linear control-display relationship is often used. The effect is to reduce the amount of movement necessary with the input device to achieve large movement distances in the cursor. In these cases, the relationship is expressed by a transfer function, instead of a simple ratio. The transfer function gives the velocity of the cursor as function of the velocity, or the square of the velocity, of the finger or mouse (see MacKenzie, 1995). The idea is to optimize both the gross positioning time and the fine positioning time; however, the effect on user performance is inconclusive. Jellinek and Card (1990) found no performance improvement using several higher-order transfer functions with a mouse, and suggested that the only benefit is the smaller desktop footprint afforded by the higher-order relationship.
One of the goals of the present research is to measure and compare the force profiles for users interacting with touchpads and mice. We consider this the first step in the potential use of force in the transfer function for touchpads, the goal being to improve the control-display relationship for touchpads, making them closer to mice in overall user performance.
2. POINTING DEVICE PERFORMANCE EVALUATION
The evaluation of a pointing device is tricky at best, since it involves human subjects. There are differences between classes of devices (e.g., touchpad vs. trackball) as well as differences within classes of devices (e.g., finger-controlled trackball vs. thumb-controlled trackball). Generally, between-class differences are more dramatic, and hence more easily detected through empirical evaluations.
2.1. Gross Measures
The most common evaluation measures are task completion time (viz. speed) and accuracy. Task completion time, usually called movement time (MT ), is simply the elapsed time from the onset of a trial to the final selection of the target. Accuracy is usually reported as an error rate – the percentage of trials where the pointer's x-y coordinates upon selection were outside the target region. These measures are typically analysed over a variety of task or device conditions. Both movement time and error rate are gross measures because they are based on a single measurement at the end of a trial. We will contrast this with fine measures shortly.An ISO standard now exists to assist in evaluating pointing devices. The full standard is ISO 9241, "Ergonomic design for office work with visual display terminals (VDTs)". Part 9 is "Requirements for non-keyboard input device" (ISO, 1999). ISO 9241-9 proposes just one performance measurement: throughput. Throughput, in bits per second, is a composite measure derived from both the speed and accuracy in responses. Specifically,
| Throughput = IDe / MT | (1) |
where
| IDe = log2(D / We + 1) | (2) |
The term IDe is the effective index of difficulty, in "bits". It is calculated from D, the distance to the target, and We, the effective width of the target. The use of the "effective" width (We ) is important. We is the width of the distribution of selection coordinates computed over a sequence of trials, calculated as
| We = 4.133 × SDx | (3) |
where SDx is the standard deviation in the selection coordinates measured along the axis of approach to the target. This implies that We reflects the spatial variability (viz. accuracy) in the sequence of trials. And so, throughput captures both the speed and accuracy of user performance. See Douglas and Mithal (1997), Douglas et al. (1999), and MacKenzie (1992) for detailed discussions.
2.2. Fine Measures
Measures such as movement time, error rate, and throughput are extensively used in pointing device research (e.g., Batra et al., 1998, Card et al., 1978, Epps, 1986, Ishiyama & Yano, 2000, MacKenzie & Buxton, 1992). However, their expressive power is limited by the simple fact that they are gross measures. These measures adequately establish that there is a difference, but their power in eliciting why there is a difference is limited. Establishing why is more likely borne out in considering movement behaviour on the way to the target.For this, fine measures are needed. Most commonly, capturing refined aspects of pointing device behaviour means sampling the x-y coordinates of the pointer path during a trial. Numerous examples of this exist in the research literature and they are all motivated by the desire to examine the fine motor behaviour exhibited during pointing tasks as influenced by the pointing device. As few examples are hereby cited. Douglas and Mithal (1999) sampled the pointer coordinates during target selection tasks with an isometric joystick. They found random variations in the velocity of the pointer, and this they attributed to finger tremor. Accot and Zhai (1997) sampled the pointer coordinates during trajectory-based positioning tasks, such as moving the pointer through a hierarchical menu. They used the sampled data to build a variation of Fitts' law for movements along a constrained path. Akamatsu and MacKenzie (1995) modified a mouse to included tactile feedback. They report an evaluation in which five types of on-target feedback were compared ("normal", audio, tactile, visual, and combined). By capturing x-y sample points and the time when the pointer entered the target, they were able to quantitatively compare the effects of the feedback conditions on the final positioning time, defined as the time to select the target after first-entry of the pointer in the target region. They report that tactile feedback reduces final positioning time. MacKenzie et al. (2001) present seven new dependent measures to capture subtle aspects of pointing device performance. The measures, based on sampled x-y coordinates, capture performance features such as pointer direction changes and target re-entries during target selection tasks.
One measure that has not been captured and reported on in previous research is the force applied by the user in interacting with a pointing device. We feel this is of particular interest for the touchpad, since users control the on-screen pointer by moving their finger on the surface of the pad. Besides x-y motion, z-axis force is required to maintain tracking. As the velocity of x-y motion increases and decreases, z-axis force will change; however, the nature of this change has not been studied. We suspect that changes in applied force will reflect a change in the user strategy as movement proceeds. Furthermore, the effect may differ between the ballistic phase and the feedback-controlled phase of movement (Welford, 1968). The latter is the final phase of motion wherein the user hones-in on the target and prepares to select the target. In the following section, we report on an experiment to measure the user's applied force in interacting with touchpad pointing devices. We also used a mouse as a baseline condition.
3. METHOD
3.1. Participants
We recruited eight volunteer, un-paid participants for the experiment. All participants were employees at a local laboratory who used computers on a daily basis. There were 7 males and 1 female. Ages ranged from 27 to 51 years (mean = 37.8, SD = 8.6).
3.2. Apparatus
Hardware. The touchpad and mouse were operated on a Plexiglas plate (200 cm × 165 cm × 5 mm) instrumented with a high-sensitivity three-axis strain gauge. The strain gauge was a model LSM-1KBS-P by Kyowa Electric Instruments Co Ltd. (Tokyo, Japan). The strain gauge connected to an SAN-EI model 6M92 strain gauge instrumentation amplifier by NEC (Tokyo, Japan), which in turn connected to a DAQ Card-700 12-bit analog-to-digital card by National Instruments (Austin, TX). The weight of the device was subtracted by activating the "zero balance" function of the amplifier prior to testing.To avoid artefacts in the recorded force, the click button was separated from the devices and was operated by the index finger on the left hand. See Figure 1.
Figure 1. Experimental apparatus. A high-sensitivity three-axis strain gauge supported the devices under test. A separate click button was operated with the index finger on the left hand.

The touchpad was a Versapad by Interlink Electronics (Camarillo, CA). It was fixed directly to the plate by two shafts at diagonally-opposing corners inserted into two holes on the surface of the plate. See Figure 2a. The mouse was an ErgoMouse by Sanwa Supply (Yokahama, Japan). Both devices connected to the experimental system's serial port. When the mouse was used, the mouse pad was fixed on the plate. See Figure 2b. The strain gauge was calibrated to null the effect of the mass of each device. That is, a force of 0 newtons was registered for the apparatus, as seen in Figure 2.
(a)(b)
Figure 2. Devices under test. (a) touchpad (b) mouse. For both devices, the right forearm rested in an arm support (shown) to minimize the influence of the weight of the forearm on the measured force.

Participants were allowed to adjust the position of the device, armrest, and button for maximum comfort.
When the click button was pressed, a trial started. The trial was terminated when the participant pressed the click button again (after positioning the cursor within the target area). The signal of the strain gauge and the trace of the on-screen tracking symbol during the task were recorded at a 33.3 Hz sampling rate.
Two computer systems were used. One system operated the experimental software and collected data from the pointing devices. The other system served as a data acquisition system for the strain gauge. The system running the experimental software was a Compaq ARMADA 4125T running Windows 95. Task conditions appeared on a 15 inch CRT display. The data acquisition system was a Dell HighnoteUltra CT475 running Windows 3.1. Note that both the experimental software and the data acquisition software operated in DOS mode.
Software. We used a modified version of Soukoreff and MacKenzie's Generalized Fitts' Law Model Builder software (Soukoreff & MacKenzie, 1995). The software is DOS-hosted and runs on any conventional PC platform. The software was modified to collect pointer trace data at a controlled sampling rate (33.3 Hz, in this case). The software uses procedure calls to interact with the pointing device via the system's installed device driver. The experimental conditions presented by the software are described in the next section.
3.3. Procedure
The task was a standard target acquisition task, as described in ISO 9241-9 (ISO, 1999). The participant controlled the position of a tracking symbol — a crosshair — by manipulating the device under test in the conventional manner; namely, moving the mouse, or moving the index finger on the surface of the touchpad. The target was a circle. Two different diameters were used: 10 pixels and 40 pixels.The distance from the initial pointer position to the centre of the target was fixed at 160 pixels. Thus, there were two indices of task difficulty, based on Equation 1. For the small target:
| ID = log2(160 / 10 + 1) = 4.1 bits | (4) |
and for the large target
| ID = log2(160 / 40 + 1) = 2.3 bits | (5) |
Four directions of movement were used: 45°, 135°, 270°, 315°.
A timing chart for an example trial is shown in Figure 3. At the beginning of a trial a square and a target circle appear. The participant began a trial by clicking the button. When this was detected, the square changed to a crosshair and became the tracking symbol under control of the pointing device. The participant moved the tracker by moving her finger across the pad surface (touchpad condition) or by moving the mouse (mouse condition). When the tracker was inside the target the button was pressed again to end the trial. At the end of a trial, both the crosshair and the target disappeared. About two seconds later the next condition appeared.
Figure 3. Timing chart for one trial

3.4. Design
Each participant performed two sessions of trials over two days. We counter-balanced for device and for target size within device. Two blocks of trials were administered for each device and for each target size. A practice block of trials was administered at the beginning of each session and when switching devices within a session. See Table 1.
Sequence of Administering Experimental Conditions
| Participant | First Session (day #1) | Second Session (day #2) | |||
|---|---|---|---|---|---|
| 1 | PM-ML-MS | PT-TL-TS | PT-TL-TS | PM-ML-MS | |
| 2 | PM-ML-MS | PT-TS-TL | PT-TL-TS | PM-MS-ML | |
| 3 | PM-MS-ML | PT-TS-TL | PT-TS-TL | PM-MS-ML | |
| 4 | PM-MS-ML | PT-TL-TS | PT-TS-TL | PM-ML-MS | |
| 5 | PT-TL-TS | PM-ML-MS | PM-ML-MS | PT-TL-TS | |
| 6 | PT-TL-TS | PM-MS-ML | PM-ML-MS | PT-TS-TL | |
| 7 | PT-TS-TL | PM-MS-ML | PM-MS-ML | PT-TS-TL | |
| 8 | PT-TS-TL | PM-ML-MS | PM-MS-ML | PT-TL-TS | |
| P = practice, M = mouse, T = touchpad, L = large target, S = small target | |||||
Each letter pair in Table 1 represents a block of trials (e.g., "ML" is a block of trials for the Mouse with the Large target). Each block consisted of eight trials, two for each of the four angles. Angles were presented randomly within a block. So, with 8 participants tested in 2 sessions each containing 6 blocks of 8 trials, the total number of trials in the experiment was 8 × 2 × 6 × 8 = 768.
4. RESULTS AND DISCUSSION
4.1. Gross Measures
The grand mean for movement time, excluding practice blocks, was 1617 ms. Movement with the mouse (1411 ms) was 23% faster than with the touchpad (1823 ms). There were also differences by target size, as expected (see Figure 4).
Figure 4. Movement time (ms) by device and target size. (Note: error bars represent 1 SE)
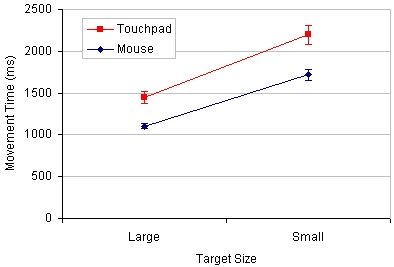
The main effect of device on movement time was significant (F1,7 = 16.6, p < .005), as was the main effect for target size (F1,7 = 54.8, p < .0001). However, the device by target size interaction was not significant (F1,7 = 2.24, p > .05).
Error rates were quite low, overall. The grand mean was 1.56%. There were more errors for the touchpad (2.34%) than for the mouse (0.78%). Within devices, there were differences for target size consistent with those for movement time. The highest error rate, at 3.91%, was for the touchpad with the small target (see Figure 5).
Figure 5. Error rate (%) by device and target size (Note: Error bars represent 1 SE.)

The only statistically significant effect was for target size (F1,7 = 9.0, p < .05). Note that each point in Figure 4 and Figure 5 is the mean score for 128 trials (8 participants × 2 blocks × 8 trials/block).
The throughput for the mouse was 2.32 bits/s for the mouse and 1.94 bits/s for the touchpad (see Equation 1). The lower throughput for the touchpad is consistent with previous studies (e.g., Douglas et al., 1999, MacKenzie et al., 2001, MacKenzie and Oniszczak, 1998).
4.2. Fine Measures
Our experimental apparatus sampled the position of the tracker and the applied force during each trail. From these data, a variety of additional analyses are possible.Trajectories. By way of example, Figure 6 shows the trajectory data as a series of sample points for a block of eight trials for the touchpad. There are two trials shown for each angle of movement.
Figure 6. Examples of trajectories for eight trials with the touchpad (Note: Units are pixels relative to the centre of the display.)
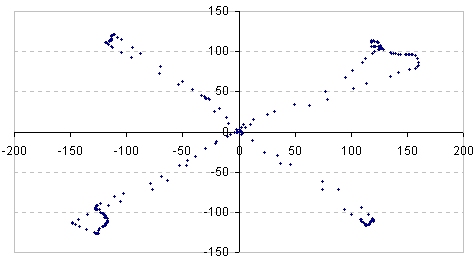
The fact that sample points are seen clustering together near the end of the trials is indicative of the deceleration expected as final selection approaches. The greater distance between sample points in the middle of the trials is also expected, as this is the ballistic phase of movement, and it is during this phase that maximum velocities are attained.
Maximum Velocity. The maximum velocity attained during each trial was calculated from the sampled x-y coordinates of the tracker and from the implicit timestamp associated with each sample (x-y samples were gathered on 33 ms intervals). The units were pixels per second. The results are shown in Figure 7.
Figure 7. Maximum velocity (pixels/s) by device and target size. (Note: Error bars represent 1 SE.)

There were no significant main effects or interactions for device or target size on maximum velocity. This is an important result. Since the maximum velocity occurs during the ballistic phase of movement, and since there was no significant difference by device in the maximum velocities, it follows that the touchpad's longer selection time was due to the need for additional or more exacting corrective movements to fix the cursor to the target.
Applied Force. The amplitudes of applied force to the device were obtained from the sum of the squares of the forces measured along the three orthogonal axes. Figure 8 shows examples of trials for (a) the mouse and (b) the touchpad. The x-axis in the figure is the distance (in pixels) to the final cursor position, while the y-axis is the measured force (in newtons).
(a)
(b)
Figure 8. Examples of recorded applied force for 8 trials (a) mouse (b) touchpad
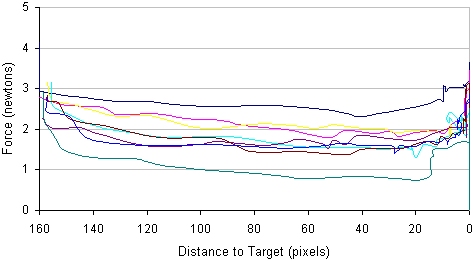

The figure shows that, in general, the applied force was reduced on the way to the target. However, just before the participant stopped the cursor, there appears to be a small increase in the force, although there is considerable variability and the effect is by no means consistent. When participants used the mouse, the force was relatively constant until the cursor position was 30 or 20 pixels to the final position. Then, a gradual increase of the force was observed. Additionally, we observed that the amplitudes of the force were higher for the smaller target than for the larger target.
The mean force by device and target size is shown in Figure 9. Although the means were higher for the mouse than for the touchpad, the main effect for device was only marginally significant (F1,7 = 5.10, p = .058). Statistical significance was not attained in the main effect for target size (F1,7 = .34, ns) or in the device by target size interaction (F1,7 = 2.12, p > .05).
Figure 9. Mean force (newtons) by device and target size. (Note: Error bars represent 1 SE.)

Comparison of Applied Force. From the example traces in Figure 8, and from our additional examination of the force profiles, it is evident that changes in the applied force are complex when the tracker approaches the target. Therefore, we undertook further analyses of the force patterns near the target. The data selected for analysis were for movements within 10 pixels of the target centre with the tracker still moving. Since we are looking for patterns of behaviour within each participant's interaction style, the recorded force was standardized by the mean and standard deviations for each participant, the goal being to null the effect of individual differences. The lack of significant difference in the mean applied force (Figure 9) justifies this additional adjustment in looking more closely at the force differences by device. The results of this final analysis are shown in Figure 10. The number of contributing sample points in Figure 10 is 4277 for the mouse (1732 for the large target, 2545 for the small target) and 5106 for the touchpad (1988 for the large target, 3118 for the small target).
(a)
(b)
Figure 10. Comparison of applied force (a) mouse (b) touchpad. (Note: Error bars show 1 SE.)


Some interesting observations present themselves. As the cursor came close to the target, the force increased when the participant used the mouse (Figure 10a). This suggests that users press the mouse harder when fixing the cursor to the target. This was also confirmed because the applied force was higher for the small target than for the large target. The applied force increases the friction of mouse movement, potentially helping in the precise operation of the mouse using hand or arm movement. This is in part supported implicitly by the commercial preponderance of mouse pads with soft, textured surfaces. Since a hand or arm is less precise than a finger for small and precise movement (Balakrishnan & MacKenzie, 1997, Langolf et al., 1976), this is a kind of compensatory behaviour while using a mouse.
On the other hand, when participants used the touchpad, the force decreased as the cursor approached the target (Figure 10b). This suggests that users reduce their finger force to the touchpad when they position the cursor in the vicinity of an intended target. Although this may follow from a need reduce finger friction for precise finger and, hence, tracker movements, the underlying mechanism for this behaviour is subject to speculation.
One possible explanation for the final decrease in force for the touchpad is to avoid unstable tracker movements when the finger presses the touchpad strongly. When the pad is pressed by the finger, the friction of the finger tip changes. Increased friction tends to induce jitter, one possible explanation being that the skin tissue is loosely connected to finger bone. This, combined with the elastic property of the skin may induce jittery or jerky movement as the skin is alternately engaged and released from the pad's surface during movement. This effect is reduced if the force is decreased during movement. Since the metaphor (or analogy) of pointing tasks is "reaching and pushing a button", the natural action for pointing is to increase the applied force to the device.
The fact that we observed a decrease in force during the final positioning of the tracker suggests that further development in the technology is warranted to afford more smooth finger and tracker movements under changes in pressure to the touchpad. In particular, we feel that force data have the potential to be used in the transfer function for touchpad devices to improve tracker motion and to increase the accuracy in the final positioning of the tracker and to improve the overall accuracy of selection.
4.3. Conclusions
We have presented the results of an experiment that measured the applied force of the finger on a touchpad during pointing tasks. Our results indicate that users reduced the applied force of their finger on the touchpad during the final selection phase of target acquisition tasks. We consider this to be an adapted behaviour, however, it is unnatural and requires effort on the part of the user. Since the user controls finger force in positioning tasks, it is suggested that the detected force should be a variable in the touchpad's transfer function to afford a better blend of coarse and fine positioning strategies.
5. REFERENCES
Accot, J., and Zhai, S., 1997. Beyond Fitts' law: Models for trajectory-based HCI tasks, Proceedings of the CHI '97 Conference on Human Factors in Computing Systems New York: ACM, pp. 295-302. https://dl.acm.org/doi/pdf/10.1145/258549.258760Akamatsu, M., MacKenzie, I. S., and Hasbrouq, T., 1995. A comparison of tactile, auditory, and visual feedback in a pointing task using a mouse-type device, Ergonomics, 38: 816-827. https://doi.org/10.1080/00140139508925152
Balakrishnan, R., and MacKenzie, I. S., 1997. Performance differences in the fingers, wrist, and forearm in computer input control, Proceedings of the ACM Conference on Human Factors in Computing Systems - CHI '97 New York: ACM, pp. 303-310. https://dl.acm.org/doi/pdf/10.1145/258549.258764
Batra, S., Dykstra, D., Hsu, P., Radle, K. A., and Wiedenbeck, S., 1998. Pointing device performance for laptop computers, Proceedings of the Human Factors and Ergonomics Society 42nd Annual Meeting - 1998 Santa Monica, CA: HFES, pp. 536-540. https://doi.org/10.1177/154193129804200603
Card, S. K., English, W. K., and Burr, B. J., 1978. Evaluation of mouse, rate-controlled isometric joystick, step keys, and text keys for text selection on a CRT, Ergonomics, 21: 601-613. https://doi.org/10.1080/00140137808931762
Douglas, S. A., Kirkpatrick, A. E., and MacKenzie, I. S., 1999. Testing pointing device performance and user assessment with the ISO 9241, Part 9 standard, Proceedings of the ACM Conference on Human Factors in Computing Systems - CHI '99 New York: ACM, pp. 215-222. https://doi.org/10.1145/302979.303042
Douglas, S. A., and Mithal, A. K., 1997. The ergonomics of computer pointing devices. New York: Springer Verlag, 1997, 233 pages. https://doi.org/10.1007/978-1-4471-0917-4_4
Epps, B. W., 1986. Comparison of six cursor control devices based on Fitts' law models, Proceedings of the Human Factors Society 30th Annual Meeting Santa Monica, CA: Human Factors Society, pp. 327-331. https://doi.org/10.1177/154193128603000403
Greenstein, J. S., and Arnaut, L. Y. Input Devices. in Handbook of Human-Computer Interaction, M. Helander, Ed. (Elsevier, Amsterdam, 1988) pp. 495-519. https://doi.org/10.1016/B978-0-444-70536-5.50027-0
Ishiyama, K., and Yano, S., 2000. A study of characteristics of pointing devices for television operation, IEEE Conference on Systems, Man, and Cybernetics - SMC 2000 New York: IEEE, pp. 1307-1312. https://doi.org/10.1109/ICSMC.2000.886034
ISO, "Ergonomic requirements for office work with visual display terminals (VDTs) - Part 9 - Requirements for non-keyboard input devices (ISO 9241-9)" Report Number ISO/TC 159/SC4/WG3 N147 (International Organisation for Standardisation, 1999). https://www.iso.org/standard/30030.html
Jellinek, H. D., and Card, S. K., 1990. Powermice and user performance, Proceedings of the ACM Conference on Human Factors in Computing Systems - CHI '90 New York: ACM, pp. 213-220. https://doi.org/10.1145/97243.97276
Jenkins, W. L., and Connor, M. B., 1949. Some design factors in making settings on a linear scale, Journal of Applied Psychology, 33: 395-409. https://psycnet.apa.org/doi/10.1037/h0056573
Langolf, G. D., Chaffin, D. B., and Foulke, J. A., 1976. An investigation of Fitts' law using a wide range of movement amplitudes, Journal of Motor Behavior, 8: 113-128. https://doi.org/10.1080/00222895.1976.10735061
MacKenzie, I. S., 1992. Fitts' law as a research and design tool in human-computer interaction, Human-Computer Interaction, 7: 91-139. https://doi.org/10.1207/s15327051hci0701_3
MacKenzie, I. S., in Virtual environments and advanced interface design, W. Barfield, and T. A. Furness, Eds. (Oxford, New York, 1995) pp. 437-470. https://www.yorku.ca/mack/Barfield.html
MacKenzie, I. S., and Buxton, W., 1992. Extending Fitts' law to two-dimensional tasks, Proceedings of the CHI '92 Conference on Human Factors in Computing Systems New York: ACM, pp. 219-226. https://doi.org/10.1145/142750.142794
MacKenzie, I. S., Kauppinen, T., and Silfverberg, M., 2001. Accuracy measures for evaluating computer pointing devices, Proceedings of the ACM Conference on Human Factors in Computing Systems - CHI 2001 New York: ACM, pp. 9-16. https://doi.org/10.1145/365024.365028
MacKenzie, I. S., and Oniszczak, A., 1998. A comparison of three selection techniques for touchpads, Proceedings of the ACM Conference on Human Factors in Computing Systems - CHI '98, Los Angeles, CA New York: ACM, pp. 336-343. https://dl.acm.org/doi/pdf/10.1145/274644.274691
MacNeill, D., and Blickenstorfer, C. H., 1996. Trackpads: Alternative input technologies, Pen Computing, pp. 42-45.
Soukoreff, W., and MacKenzie, I. S., 1995. Generalized Fitts' law model builder, Companion Proceedings of the CHI '95 Conference on Human Factors in Computing Systems New York: ACM, pp. 113-114. https://dl.acm.org/doi/pdf/10.1145/223355.223456
Welford, A. T., 1968. Fundamentals of skill. Methuen, London, 1968, 426 pages. https://gwern.net/doc/psychology/1968-welford-fundamentalsofskill.pdf