2.4 The feasible set with two assets
Having reviewed the above rules and definitions we are now in a position to start investigating the feasible sets for our portfolio choices. We assume that we are given a set of ![]() primary securities and we attempt to identify all the possible combinations of portfolios, i.e. of(σ,
primary securities and we attempt to identify all the possible combinations of portfolios, i.e. of(σ,![]() ), that we can generate by combining the primary securities to portfolios.
), that we can generate by combining the primary securities to portfolios.
This process is equivalent to the one we used before, utilizing the budget constraint and the prices of goods to identify all the feasible bundles of goods 1 and 2 we could consume in an environment with no uncertainty.
There is however a significant difference between our current investigation and the previous one. Here, the standard deviation of a linear combination of assets is not the linear combination of the standard deviations of the assets. Hence we should expect that unlike earlier, the feasible set is not defined by linear constraints. However, one important property of the feasible set remains intact. The feasible set, even here, is a convex set and we will exploit this property.
We start by defining again our function for the variance and the expected value of a portfolio (in case you start reading the book from the current file).
| > | ExpPortS:=(X::list,mu::list)->sum(X[i]*mu[i],i=1..nops(X));
|
| > |
| > | VarPortS:=(X::list,Sigma::listlist)->sum(sum(X[i]*X[j]*Sigma[i][j],i=1..nops(X)),j=1..nops(X));
|
| > |
While the function defined above can deal with portfolios consisting of ![]() securities, our first investigation will be focused on a portfolio of two securities.
securities, our first investigation will be focused on a portfolio of two securities.
Let us now take a close look at the shape and characteristics of the different portfolios we can compose of two securities. This time we would like to express the variance in terms of the correlation coefficient. The variance of a portfolio composed of ![]() of security 1 and
of security 1 and ![]() of security 2 is thus symbolically given by:
of security 2 is thus symbolically given by:
| > | VarPortS([x,1-x],[[sigma||1^2,rho*sigma||1*sigma||2],[rho*sigma||1*sigma||2,sigma||2^2]]);
|
| > |
Assume that ![]() , that short sales are not allowed, and further that
, that short sales are not allowed, and further that ![]() ,
, ![]() ,
, ![]() and
and ![]() . In this case the variance as a function of
. In this case the variance as a function of ![]() , the proportion invested in security 1 is:
, the proportion invested in security 1 is:
| > | VarPortS([x,1-x],[[1,0],[0,4]]); |
| > |
Before visualizing the possibilities it will be helpful to find the minimal variance, as it plays a role in the analyses below. To this end we need to find the minimum of the variance as a function of ![]() , subject to the constraints that
, subject to the constraints that ![]() is non-negative and cannot exceed unity. The constraints are needed to ensure the short sales restriction. This of course is an application of KT conditions, but this time we will let maple do the job. Note that Minimize is a procedure in the Optimization package and since it is not loaded by default when Maple is executed we need to use the syntax below.
is non-negative and cannot exceed unity. The constraints are needed to ensure the short sales restriction. This of course is an application of KT conditions, but this time we will let maple do the job. Note that Minimize is a procedure in the Optimization package and since it is not loaded by default when Maple is executed we need to use the syntax below.
| > | Optimization:-Minimize(x^2+4*(1-x)^2, {x>=0, x<=1}); |
| > |
The output above gives us the value of the objective function at the maximum as well as the optimal value of ![]() .
.
We can also try to do it in the following way:
First differentiate the objective function and find the value of ![]() at which it vanishes (we omit the constraints hoping that they are not binding). We then substitute this value of
at which it vanishes (we omit the constraints hoping that they are not binding). We then substitute this value of ![]() at the objective function to find the minimal variance.
at the objective function to find the minimal variance.
| > | diff(x^2+4*(1-x)^2,x); |
| > |
| > | solve(diff(x^2+4*(1-x)^2,x)); |
| > |
| > | subs(x=%,x^2+4*(1-x)^2); |
| > |
You may notice that the value in our second approach was given in terms of simple fractions while the first approach generates a decimal result (which was not as precise as the second approach). Hence the portfolio with the minimal risk will have an expected value and standard deviation as outlined below respectively.
| > | ExpPortS([4/5,1-4/5],[2,6]); |
| > |
| > | sqrt(4/5); |
| > |
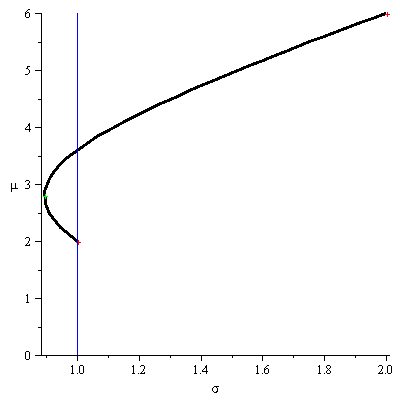
We are now ready to generate the graph of the combinations of possible portfolios, and it is plotted below. The red squares denote the two primary securities, that is the coordinates; (![]() ,
, ![]() ) and (
) and (![]() ,
, ![]() ) and the green square is the portfolio with minimal risk.
) and the green square is the portfolio with minimal risk.
| > | Prim:=plot([[1,2],[2,6]],style=point,symbol=cross,thickness=3,colour=red): |
| > |
| > | MinVar:=plot([[2*sqrt(5)/5,14/5]],style=point,symbol=cross,thickness=2,colour=green): |
| > |
| > | Bar:=plot([[1,0],[1,6]],style=line,colour=blue): |
| > |
| > | NoShortr0:=plot([sqrt(VarPortS([x,1-x],[[1,0],[0,4]])),ExpPortS([x,1-x],[2,6]),x=0..1],thickness=4,labels=[s,m],labelfont=[SYMBOL],thickness=3,colour=black): |
| > |
| > | plots[display](NoShortr0,Prim,Bar,MinVar);
|
 |
| > |
There are a few observations that we can conclude from this graph.
- We can generate a portfolio, from two securities, with a risk that is smaller than the risk of each of the primary securities.
- A section of the generated curve is not efficient. For a given risk we always prefer the portfolio with the higher return. The portion of the curve connecting the primary securities with the lower standard deviation (1,10), to the portfolio with the minimum risk (the green point) is not efficient.
- The curve above will be a function in the (
 ) plane only if it is defined from the minimal variance onward.
- In this market a rational (risk averse) investor would not hold the original security with the lower risk by itself. The vertical line in the graph points to a portfolio with a lower
 and a higher expected rate of return that is higher than that of the original security.
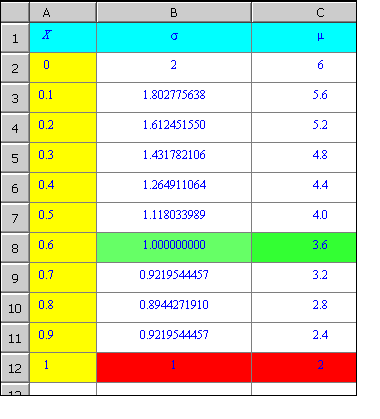
We utilize the spreadsheet facility in Maple to list the coordinates on the composed portfolios as a function of ![]() . The cells representing the portfolio that dominates the original security (1,2) are highlighted in green.
. The cells representing the portfolio that dominates the original security (1,2) are highlighted in green.
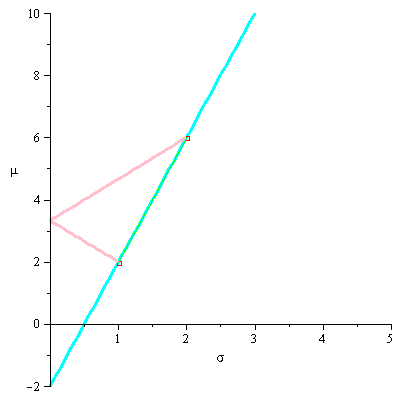
If short sales are allowed we can have more possibilities. This is illustrated below, where the cyan curve (which includes portfolios with short sales) is imposed on the black curve.
| > | Shortr0:=plot([sqrt(VarPortS([x,1-x],[[1,0],[0,4]])),ExpPortS([x,1-x],[2,6]),x=-1..2],labels=[s,m],labelfont=[SYMBOL],thickness=1,colour=cyan):
|
| > |
| > | plots[display](Shortr0,Prim,NoShortr0,Bar);
|
 |
| > |
Note that with short sales allowed, the efficient, as well as the inefficient part of the possibility curves is augmented. We can obtain an expected rate of return as high as we want, but of course provided we will agree to take higher and higher risk.
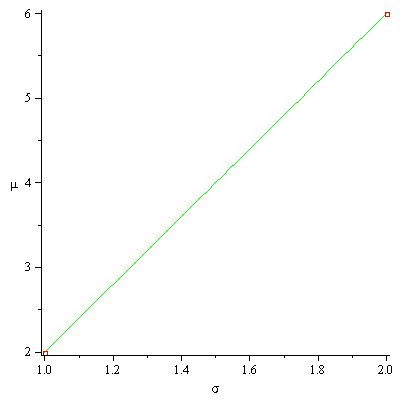
Let us investigate the same market as above but change the assumption of ![]() to
to ![]() . As we shall soon see
. As we shall soon see ![]() is a significant factor in determining the shape of the curve. The variance of a portfolio composed of two securities that are perfectly correlated (have a correlation coefficient with absolute value 1) will be:
is a significant factor in determining the shape of the curve. The variance of a portfolio composed of two securities that are perfectly correlated (have a correlation coefficient with absolute value 1) will be:
| > | VarPortS([x,1-x],[[sigma1^2,rho*sigma1*sigma2],[rho*sigma1*sigma2,sigma2^2]]); |
| > |
| > | subs(rho=1,%); |
| > |
| > | factor(%); |
| > |
Therefore the standard deviation of the portfolio is ![]() . That is, in this case the standard deviation of the portfolio is also a linear combination of standard deviations of the securities in the portfolios. Hence, since the expected value is always a linear operator, we should expect to see that the possibility curve is again linear. The graph is presented below:
. That is, in this case the standard deviation of the portfolio is also a linear combination of standard deviations of the securities in the portfolios. Hence, since the expected value is always a linear operator, we should expect to see that the possibility curve is again linear. The graph is presented below:
| > | Prim:=plot([[1,2],[2,6]],style=point,symbol=box,thickness=5,colour=red): |
| > |
| > | Shortr1:=plot([sqrt(VarPortS([x,1-x],[[1,2],[2,4]])),ExpPortS([x,1-x],[2,6]),x=0..1],labels=[s,m],labelfont=[SYMBOL],thickness=1,colour=green): |
| > |
| > | plots[display](Shortr1,Prim);
|
 |
| > |
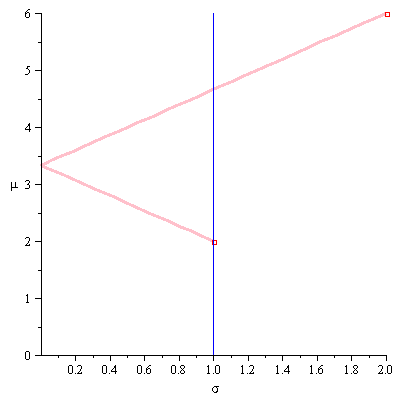
Finally we would now like to investigate the other extreme case of ![]() It is very unlikely to find, in a real market, two securities that are perfectly (positively or negatively) correlated. We should now capitalize on the intuition we hopefully gained and feel that when
It is very unlikely to find, in a real market, two securities that are perfectly (positively or negatively) correlated. We should now capitalize on the intuition we hopefully gained and feel that when ![]() , it should be possible to construct a portfolio in which when one security increases in value the other will decrease at the same rate. Thus the aggregate affect is a security with a fixed (deterministic) rate of return, namely a risk free asset. If this is the case we should be able to construct a portfolio with a standard deviation of zero. Let us see how this can be done:
, it should be possible to construct a portfolio in which when one security increases in value the other will decrease at the same rate. Thus the aggregate affect is a security with a fixed (deterministic) rate of return, namely a risk free asset. If this is the case we should be able to construct a portfolio with a standard deviation of zero. Let us see how this can be done:
| > | factor(subs(rho=-1,VarPortS([x,1-x],[[sigma1^2,rho*sigma1*sigma2],[rho*sigma1*sigma2,sigma2^2]]))); |
| > |
| > | solve({%},{x}); |
| > |
We see that indeed this is the case; there exists an ![]() such that the variance based on this
such that the variance based on this ![]() is zero. Furthermore since the variance is nonpositive, the
is zero. Furthermore since the variance is nonpositive, the ![]() specified above is also the
specified above is also the ![]() which will induce the minimal variance. Note also that
which will induce the minimal variance. Note also that ![]()
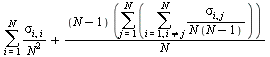
When ![]() , the portfolios composed of the two original securities form two lines and there exists a composition involving no short sales that generates a non risky portfolio. This is demonstrated below.
, the portfolios composed of the two original securities form two lines and there exists a composition involving no short sales that generates a non risky portfolio. This is demonstrated below.
| > | NShortr_1:=plot([sqrt(VarPortS([x,1-x],[[1,-2],[-2,4]])),ExpPortS([x,1-x],[2,6]),x=0..1],labels=[s,m],labelfont=[SYMBOL],thickness=3,colour=pink): |
| > |
| > | plots[display](NShortr_1,Prim,Bar);
|
 |
| > |
| > |
We see again that the variance of a portfolio might be smaller than the variance of each of the securities composing the portfolio. This, of course, is due to the covariance. Indeed the covariance plays a central role in this analysis. It is the covariance term that, in a "large" portfolio, determines the risk of the portfolio. The effect of ![]() is demonstrated below by an animation of the feasible compositions as a function of
is demonstrated below by an animation of the feasible compositions as a function of ![]() . Note in this animation the graph for
. Note in this animation the graph for ![]() and for
and for ![]() stay fixed.
stay fixed.
| > | AniRo:=plots[animate]([sqrt(VarPortS([x,1-x],[[1,-rho*1*2],[-rho*1*2,4]])),ExpPortS([x,1-x],[2,6]),x=-1..2],rho=-1..1,labels=[s,m],labelfont=[SYMBOL],thickness=3,colour=cyan): |
| > |
| > | plots[display](Prim,AniRo,NShortr_1,Shortr1,labelfont=[SYMBOL],labels=[s,m]);
|
 |
| > |
While we will show more formally the significance of the covariance in our analysis, the following explanation sheds some light on the covariance's role in determining the risk of a diversified portfolio composed of a "large" number of securities. We have alerted the readers already to the fact that the covariance is more important than the variance. In fact the contribution of the variance of each single security to the overall risk of a "large" portfolio is kind of negligible.
The variance of a portfolio composed of ![]() securities where
securities where ![]() is the covariance between
is the covariance between ![]() and
and ![]() and
and ![]() the fraction invested in security
the fraction invested in security ![]() is given by
is given by
![]()
or by
![]()
This can be written as
 .
.
Let us denote by ![]() the average of the
the average of the ![]() variances and by
variances and by ![]() the average of the
the average of the ![]() covariance. Hence we get that the variance of the portfolio is
covariance. Hence we get that the variance of the portfolio is
![]()
which, when ![]() approaches infinity, approaches
approaches infinity, approaches ![]() .
.
This does enforce the idea that the significant part of the risk is induced by the covariance, provided the portfolio is diversified. Of course our example is for a very naive diversification. We invested an equal amount in each of the securities. Nevertheless, as we will progress with our model, we will indeed confirm that investors will be rewarded for taking risk but only the risk that could not be diversified away. This is the risk that is contributed to the portfolio by the covariance. We will make this statement much more precise as we will add more structure to the model.
We are now ready to investigate the shape and properties of the feasible set when ![]() securities, not only two, are involved in the portfolio composition.
securities, not only two, are involved in the portfolio composition.