MacKenzie, I. S. (2007). Evaluation of text entry techniques. In MacKenzie, I. S., and Tanaka-Ishii, K. (Eds.) Text entry systems: Mobility, accessibility, universality, pp. 75-101. San Francisco, CA: Morgan Kaufmann.
Chapter 4
Evaluation of Text Entry Techniques
I. Scott MacKenzie
York University, Canada
4.1 Introduction
New methods of text entry appear with great frequency these days. This is due in large part to the recent and heightened interest in pen-based computing, mobile computing, and SMS messaging on mobile phones. The statistics for SMS messaging are particularly staggering: world volumes are now in excess of one billion messages per day (Economist, 2004, July 10)! In that such quantities of text are entered using the small and limited keypad on mobile phones, it is no wonder that researchers are investigating new techniques for the efficient entry of text.However, there is an unfortunate reluctance on the part of researchers to engage the user community as a final and essential step in the creative process. Great ideas too often remain inadequately tested or untested. To simply invent a new text entry technique and then declare it as fast, efficient, and easy to learn, without testing such claims with users, falls short of the standards of research expected today.
The focus in this chapter is the evaluation of text entry techniques. Our goal is, first, to build a case for the need for evaluation and, second, to lay out strategies and methodologies to do it. We begin with two examples from the literature where evaluations were not performed, but where a need was clearly evident.
In reviewing a new and interesting text entry technique in 1988, Potosnak wrote, "no tests (other than analyses comparing the number of wipes to number of keystrokes required on traditional keyboards) have been reported to determine performance or preference effects with this keyboard" (Potosnak, 1988, p. 491). The design referred to is the Wipe-Activated Keyboard, patented in 1980 and presented in IEEE Computer in 1982 (Montgomery, 1980, 1982). An evaluation was not reported, and this deficiency in the research did not escape the scrutiny of Potosnak. The idea, shown in Figure 4-1, was for a keyboard with a flat touch-sensitive surface and no moving parts. The design also included a non-standard letter arrangement to facilitate an alternative interaction: wiping. Letters may be entered in the usual way – by touch tapping keys with one's finger – or with wiping gestures where consecutive letters are neighbours.
Figure 4-1. Montgomery Wipe-Activated Keyboard (from Montgomery, 1982)
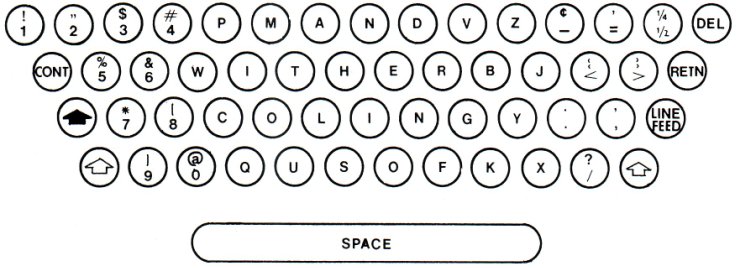
The letters were arranged to maximize opportunities for wipe-activated input for the most common words in English, as verified in Figure 4-1 for THE, OF, AND, TO, IN, IS (1 wipe each); THEY, THEIR, THEM (1 wipe plus 1 tap each); and so on. Despite building a working prototype, the inventer acknowledged that the design was "yet to be tested" (1982, p. 18).1
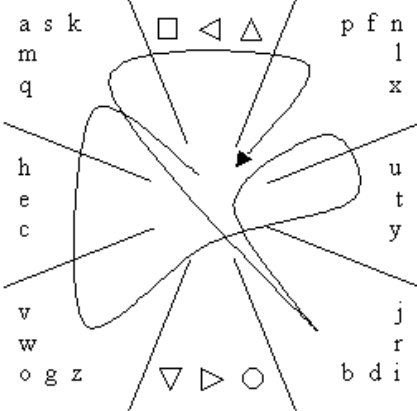
The example above is by no means unique. More recently, within the discipline of human-computer interaction (HCI), Quikwriting was developed as a gesture-based text entry technique using a stylus (Perlin, 1998). The idea involves a 3 × 3 grid where characters are entered with gestures beginning in a central home zone and moving through one or two adjoining zones, returning to the home zone (see Figure 4-2). The symbols in the top centre and bottom centre zones invoke different modes. Letters that occur more frequently in English are given the shortest gestures. For example, "I" in Figure 4-2 is entered by moving in and out of the bottom right zone. Less frequent letters have longer gestures ("K" requires a move into the upper left zone, then across to the upper right zone, and finally back to home).
Figure 4-2. Quikwriting input of "QUICK" (based on Perlin, 1998).
The inventor wrote, "while we have yet not done systematic user testing, anecdotal experience to date is consistent: Users well practiced in both Graffiti and Quikwriting consistently find the latter to be about three times faster" (Perlin, 1998, p. 216).2 "Three times faster" combined with the "quick" self reference in Quikwriting leaves little doubt as to the promise of this text entry technique. Yet no formal or informal empirical results were given. A follow-on, independent evaluation of Quikwriting was performed, however, with walk-up entry rates measured at just 4 wpm (Isokoski & Raisamo, 2004). Entry speed increased to 16 words per minute, but only after five hours of practice. Considering that human handwriting speeds are 20+ words per minute (Bailey, 1996, p. 287), "quick" is not a word that comes to mind for Quikwriting. Empirical tests of Graffiti, on the other hand, reports entry speeds in the range of 7-10 wpm initially with rates rising above 20 wpm with practice (Fleetwood et al., 2002; Koltringer & Grechenig, 2004; MacKenzie, Chen, & Oniszczak, 2006). It remains a challenge to reconcile the just-cited empirical results with the anecdotal report in the original publication.
What do you think of Quikwriting or the Wipe-Activated Keyboard? They are interesting ideas, for sure. Will they support fast and accurate text entry? Will they do so with modest practice or do they require prolonged practice? What are the expected entry speeds or error rates? Will users like the techniques or will they find them frustrating? How do they compare to alternative text entry techniques? Are there aspects of the designs that could be modified in some way to improve performance? The questions just posed are the central motivation in this chapter. While analysis through modeling might assist in predicting answers to these questions (Card, English, & Burr, 1978; Card, Moran, & Newell, 1980; MacKenzie, 2003), the final, incontestable answer lies in community of people that ultimately employ a technique: users. Waiting for the collective response of the public following deployment of a product is risky, albeit not unheard of (Cooper, 1999).3 A more reliable and safer approach is to engage a subset of the user community as participants in an empirical evaluation of the text entry technique in question. Let's see what this entails.
4.2 Comparative Evaluation of Text Entry Techniques
A word has crept into the title of this section that is missing in the chapter's title: comparative. Indeed, evaluation in the absence of comparison is of limited value. Where a new text entry technique is proposed, it is usually offered as an improvement over an existing technique; e.g., a new method for handwritten input, or a new keyboard for keyed input. At the very least, comparing a new technique with an established technique with known performance characteristics serves as a check on the methodology. That is, if a similar and accepted result is reported for an established technique, then a differential result for a new technique in the same evaluation is given greater credence than if the latter result were reported alone. A slightly different motivation is simply to establish which of two or more design alternatives is better. In any event, a comparative evaluation is recommended.
The framework for a comparative evaluation is an experiment conforming to established standards and methods in the field of experimental psychology. After all, we are dealing with humans interacting with technology. In a sense, HCI is the beneficiary of this more mature field with a history of refined methods of experimentation involving humans. Answering research questions, such as in the preceding section, using a concocted methodology, customized and tailored as might seem reasonable, falls short of good research. In experimental psychology, it is sometimes stated that research questions must pass the "ROT" test (Martin, 2004). Questions must be repeatable, observable, and testable. "Repeatable" refers to the need to describe the apparatus and procedure with sufficient detail to allow others to repeat the research, to verify or refute results. "Observable" refers to the need to test human responses that are directly measurable, such as the time to enter a phrase of text. "Testable" refers to the need to pose questions about numbers; e.g., is the speed of entry faster for one technique than another? Meeting the testable criterion is more difficult for research questions of a qualitative nature, since users' feelings, opinions, or attitudes are not directly measurable. In this case, the accepted approach is to solicit responses from users via a questionnaire. If the responses use a numeric rating scale, e.g., from 1 = strongly agree to 5 = strongly disagree, then the testable criterion is met by analysing the coded responses.
In the following sections, the steps in performing a comparative evaluation of a text entry technique are given.
4.2.1 Pre-Experimental Testing
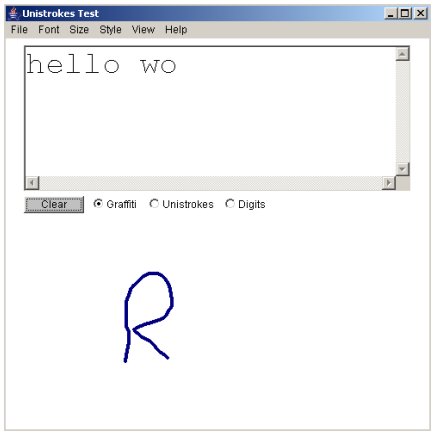
The first order of business is to build a working prototype. With a working prototype, the user enters text with the result appearing for inspection on a display. For research, it is best to keep the design separate from target applications such as email clients or word processors. An example of a handwriting recognition prototype system, created by the author, is shown in Figure 4-3.
Figure 4-3. A working prototype. In this case, text is entered using handwriting recognition with results appearing in a text field in the prototype software
Once a prototype is operational, substantial pre-experimental testing is possible – to rid the code of bugs and to refine the design until satisfactory performance is achieved. Since entry speed is the performance variable of greatest interest, it is important to get a rough sense of the technique's potential early on. A good way to do this is to measure the time to enter a phrase of text and to compute entry speed in words per minute. A common phrase for this purpose is
the quick brown fox jumps over the lazy dog
The phrase contains 43 letters, including spaces, and, notably, each letter of the English alphabet. How fast can this phrase be entered? No need to get fancy at this stage. Timing with a wall clock or wristwatch will suffice. If the phrase is entered in, say, 45 seconds, then the entry speed is (43 / 5) / (45 / 60) = 11.4 words per minute (wpm). Dividing the number of characters by 5 yields "words", and dividing the number of seconds by 60 yields "per minute".4
Such a cursory evaluation as just described exceeds that reported in the two papers cited at the beginning of this chapter, and, arguably, there is no excuse for this. Even a short paper or poster presentation should give at least preliminary expectations in terms of text entry speeds achievable with simple tests as just described.
As a precaution, we note that the inventor or researcher is so close to the design and interaction requirements, that the entry rates achieved by that individual may not reflect those achievable by a broader community of users. Therefore, it is recommended to have arms-length users try the technique. The results may be surprising!
The prototype in Figure 4-3 is actually software running on a desktop computer. While such mock-ups are relatively simple to implement and convenient to test, the results obtained are limited. Certainly, the data are better than no data at all; but, it is important to remember that the physical affordances of the intended device may be very different (e.g., a mobile phone or PDA). Testing, at some point, should be performed on a device similar to the final product in shape, size, weight, and so on. In the same vein, we, as researchers, need to be aware of the important role of aesthetic qualities in the overall success of products. It's not just entry speed!
4.2.2 The Evaluation Task
Early on in the development and testing of the prototype, focus shifts to the ensuing experimental evaluation. An important consideration is the task: will users create their own text or will they copy text provided to them? The distinction is important. Although text creation is closer to typical usage, and, thus, improves the external validity of the experiment, this approach generally is not appropriate for an empirical evaluation. This is explained as follows.
First, we introduce "focus of attention" (FOA). Consider an expert touch-typist using a Qwerty keyboard to copy text from a nearby sheet of paper. This is a text copy task. Because the typist is an expert, she attends only to the source text. This is a single FOA task. However, if input is via a stylus and soft keyboard, the typist must also attend to the keyboard because a soft keyboard cannot be operated "eyes free". Therefore, stylus typing in a text copy task, even for expert users, is a two FOA task. If the typist is less-than-expert and corrects errors, she must look at the display to monitor results. This is now a three FOA task: the typist attends to the display, to the keyboard, and to the source text. Clearly, the feedback channel is overburdened in a three FOA task.
So, why are text copy tasks preferred over text creation tasks if the former increase the attention demand? There are several reasons. One is that text creation tasks are likely to include behaviours not required of the interaction technique per se. Examples include pondering ("What should I enter next?") or secondary tasks (e.g., fiddling with system features). The measurement of text entry performance – particularly speed – is compromised if such behaviours are present.
A second difficulty with text creation tasks is identifying errors – it is difficult to know exactly what was intended if the text is generated by the user. Even if the message content is known a priori, errors in spelling or memory recall may occur, and these meta-level mistakes are often indistinguishable from errors due to the interface itself.
A third difficulty is the loss of control over the distribution of letters and words entered. The task should require the subject to enter a representative number of occurrences of characters or words in the language. However, it is not possible to control for this if the subject is generating the text.
The main advantage of a text creation task is that it mimics typical usage. The disadvantages just cited, however, are significant enough that most researchers choose a text copy task, despite the increased FOA. One way to mitigate the effects of increased FOA is to dictate the source text through the audio channel, although other compromising issues arise (Ward, Blackwell, & MacKay, 2000).
A carefully designed experiment may capture the strengths of both a text creation task and a text copy task. One technique is to present subjects with short, easy-to-memorize phrases of text. Subjects are directed to read and memorize each phrase before entering it. Memorization is enforced by hiding the source text during entry. Entry in this manner benefits from the desirable property of a text creation task, namely, reduced FOA. As well, the desirable properties of a text copy task are captured, that is, control over letter and word frequencies, and measurement of behaviours limited to the text entry task. There are numerous examples of this approach in the literature (e.g., Alsio & Goldstein, 2000; MacKenzie, Nonnecke, Riddersma, McQueen, & Meltz, 1994; MacKenzie & Zhang, 1999; Rau & Skiena, 1994).
As for the choice of text to enter, a custom set of phrases may be used, for example, as appropriate for non-English users (Majaranta, MacKenzie, Aula, & Raiha, 2003), or a standard set of phrases may be employed. MacKenzie and Soukoreff (2003) developed a phrase set for this purpose. The set contains 500 short phrases of English text. Phrases vary from 16 to 43 characters (mean length = 28.6 characters). The letter frequency correlation with an English corpus is high at r = .954. This phrase set, sometimes with a few modifications, has proven useful, as other researchers have used it in their evaluations (Agarwal & Simpson, 2005; Gong, Haggerty, & Tarasewich, 2005; Hwang, Geehyuk, Jeong, Lee, & Cho, 2005; Koltringer & Grechenig, 2004; Lyons, Chan, & Tetsutani, 2004; Read, 2005; Spakov & Miniotas, 2004; Wigdor & Balakrishnan, 2004; Wobbrock, Myers, & Aung, 2004).
4.2.3 Data Collection and Display
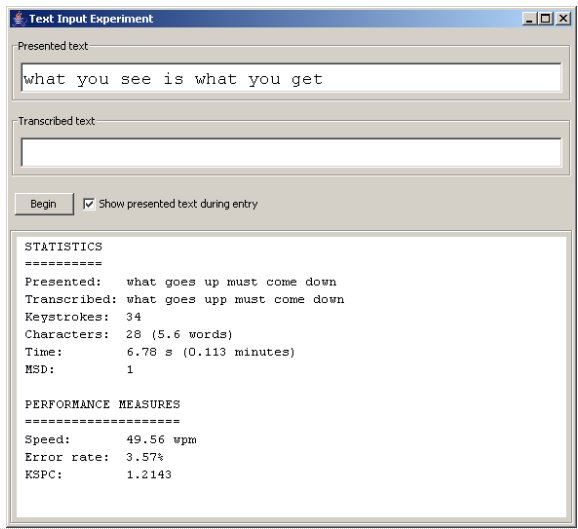
Assuming the experimental task is the input of phrases of text, the prototype software must be modified to include the phrases, perhaps reading them from a file, and presenting them to users for input. Random selection and presentation is probably the best choice. It is at this stage that the software should include data collection and display. An example created by the author is shown in Figure 4-4. The top field contains a phrase of text to entry, the "presented text". Below that is the "transcribed text". An optional checkbox toggles between hiding and showing the presented text during entry.
Figure 4-4. User interface for a text entry experiment. Data are collected with performance statistics displayed following each entered phrase. Note that the statistics and performance measures are for the previous phrase entered, and appear after ENTER is detected signalling the end of the phrase.
The software for the interface in Figure 4-4 is not tied to any particular text entry method. Some customization is needed depending on the method's input mechanism and output display. Variations on this approach appear in the form of screen snaps in several published evaluations (e.g., MacKenzie, 2002; MacKenzie, Kober, Smith, Jones, & Skepner, 2001; Oniszczak & MacKenzie, 2004; Pavlovych & Stüerzlinger, 2003; Soukoreff & MacKenzie, 2003). A distinguishing feature of the software is the immediate presentation of performance data upon detection of ENTER at the end of each entered phrase.
The performance measures in Figure 4-4 are for entry speed (words per minute), error rate (%), and keystroke per character (KSPC, the number of keystrokes divided by the number of characters produced). These are important summary statistics but others may be as important for different entry methods. Showing these in a pop up or integrated window after each phrase facilitates demonstration of a text entry method and also helps in an experiment, for example, to maintain the interest and motivation of users.
The data for the statistics and performance measures in Figure 4-4 were gathered by the experimental software and saved in a file for subsequent analyses. For this purpose, it is useful to save two streams of data. Figure 4-5 shows an excerpt of an "sd1" file, wherein low-level, raw data are written ("sd" is for "summary data"). For each phrase, both the presented and transcribed text are shown as a time stamp and key code for each keystroke. Of course, this file may be customized as appropriate for the entry technique. In an eye typing experiment, for example, we found it useful to also log time stamps for "Read Text Events" – shifts in the point of gaze to review the transcribed text field (Majaranta et al., 2003).
Figure 4-5. Example summary data file for one phrase (sd1). The first two lines contain the presented and transcribed text, respectively. The remaining lines contain timestamps (ms) and key codes. Note the presence of presses of BACKSPACE to correct input. The data are for the phrase in the bottom of Figure 4-4.
We save higher-level summary data in an "sd2" file, where each line has summary statistics on a per-phrase basis, rather than on a per-keystroke basis. In Figure 4-6, the variables are shown in a header line, with the measurements following in a series of lines, one per phrase entered in a block of testing.
Figure 4-6. Example summary data file for one block of phrases (sd2). The first line is a header identifying the summary statistics in subsequent lines. The last line shows the summary statistics for the phrase in Figure 4-4.
It is also useful to add columns in the data files to identify the participant, the entry technique, the block number, and so on, although this information also may be coded in the filename.
4.3 Experiment Design
At this point, we have a prototype that adequately implements the text entry technique of interest, and perhaps some variations on the technique. The prototype also includes mechanisms to present phrases of text to users, to collect data, and perhaps to display summary results after each phrase of entry. It is time to experimentally evaluate the text entry technique and compare it with design alternatives. In this section we identify the steps for this.
4.3.1 Participants
Users that are tested in an experiment are called "participants".5 Most empirical evaluations of text entry techniques include a dozen or so participants, although the exact number to use is debatable. If too few participants are used, large performance differences may occur, but these may not be statistically significant. If too many participants are used, small performance differences of no practical interest may show statistical significance. The best advice, perhaps, is to study the literature and use approximately the same number of participants as found in other research using a similar methodology (Martin, 2004, p. 234).
Ideally, participants are selected randomly from the population of people in the intended community of users. In practice, participants are solicited from the pool of people conveniently available, for example, students at a local university or colleagues at work. Obviously, if the research is aimed as a specific community, such as children or the handicapped, then participants must be solicited accordingly. In some cases, pre-screening is necessary if, for example, users are required with a specific level of expertise or experience with aspects of the interaction. This includes having no prior exposure, if such is important in the evaluation. In any event, it is customary to describe the participants by collecting and reporting demographic data in the form of counts, means, or ranges. Examples include age, gender, prior or current experience using computers or related devices. Additional data may be sought as deemed appropriate, such as handedness, use of corrective lenses, or experience with handwriting recognition or SMS messaging.
4.3.2 Procedure
What will participants do in your experiment? No doubt, they will enter phrases of text. But, how many phrases? Was the text entry technique demonstrated by you, the investigator, beforehand? Did the investigator use any aides in explaining or demonstrating the technique? Were practice phrases allowed before data collection? Were the phrases organized in blocks or sessions with rest breaks between? These questions need to be considered and reported. (Remember the "R" in ROT?)
A particularly important aspect of the procedure is the instructions given to participants. What were participants trying to do? Were they to proceed "as quickly as possible", "as quickly and accurately as possible", "without making mistakes", or were instructions worded in some other manner? Was it possible to correct errors? Were participants required to correct errors, required not to correct errors, or was some degree of discretion permitted? There is no single correct answer to these questions, as the instructions given and procedure used depend on the text entry technique and on the objectives in the experiment. Essential, however, is the need to report accurately on the procedure used in the experiment.
One further point on instructions is warranted. Use the same instructions for all participants. Sounds simple enough, but when instructions are given, participants often ask for clarification. It is important to constrain such discussions to ensure all participants proceed similarly. Sometimes instructions are read to participants to enforce consistency. In any event, it is important not to bias some participants by giving them additional information that may cause them to act differently than other participants.
On the potential to bias participants, it also worth commenting on the demeanour of the investigator during testing and while greeting the participants and introducing the research. The investigator should strive to make participants feel comfortable. A nervous manner or an attitude of indifference are sure to affect the way participants take to the task. Be calm, neutral, and encourage participants to feel comfortable.
4.3.3 Experimental Variables
It is important and useful to think about and organize your experiment around two classes of variables: independent variables, and dependent variables.
Independent Variables
Independent variables are the conditions tested. They are so named because they are under control of the investigator, not the participant; thus, they are "independent" of the participant. The term "independent variable" is synonymous with "factor". The settings of the variable or factor are called "levels". For example, if three keyboard layouts were compared, say, Qwerty, Alphabetical, and New, the factor is "Keyboard Layout" and the levels are "Qwerty", "Alphabetical", and "New". Perhaps there is also an interest in the effect of two different sizes of keyboards. In this case, there is an additional factor, "Keyboard Size" with two levels "Small" and "Large". Combining these two factors, the design is referred to as a 3 × 2 design. This nomenclature signals that there are two factors, with three levels on the first and two levels of the second, six test conditions in all.
Dependent Variables
Dependent variables are the measured behaviours of participants. They are dependent because they "depend on" what the participants do. The most obvious example is text entry speed measured, for example, in words per minute. Note in the preceding sentence the distinction between the variable ("text entry speed") and the units for the variable ("words per minute"). For clarity, it is important to distinguish the two.
Make sure the measurement is clear. When did the timing for a phrase begin? When did it end? Did timing begin with the first character or with a START button or some other signal before the first character? Did timing end with the last character or by pressing ENTER after the last character? If timing begins with the first character and ends with the last character, then, arguably, the first character should not count, since timing excludes the time leading up to the entry of the first character. The important point is to clearly describe the measurement of all dependent variables.
The other dependent variable of common interest is accuracy or error rate, usually reported as the ratio of incorrect characters to total characters. As it turns out, error rate is tricky to measure, since error-ridden passages often contain a confusing and conflicting collection of insertion errors, deletion errors, substitution errors, transposition errors, and so on. The reader is directed to previous work that adequately describes the measurement and categorization of text entry errors (Gentner, Grudin, Larochelle, Norman, & Rumelhart, 1983; MacKenzie & Soukoreff, 2002a; Matias, MacKenzie, & Buxton, 1996; Soukoreff & MacKenzie, 2001, 2003, 2004) as well as to Wobbrock's Chapter 3 herein.
Besides coarse measures of speed and accuracy, researchers often devise new dependent measures as appropriate for an entry technique under investigation, as noted earlier for "read text events" as a dependent variable in an eye typing experiment (Majaranta et al., 2003). As another example, consider Wigdor and Balakrishnan's (2003) TiltText, a technique for mobile phone text entry that uses the orientation of the device to resolve the ambiguity of letters on keys on the mobile phone keypad. Besides conventional error rate analyses, they also defined and used "button error" and "tilt error" as dependent variables. Button errors were the ratio of errors due to pressing the wrong button, and tilt errors were the ratio of errors due to tilting the device in the wrong direction. McQueen, MacKenzie, and Zhang's (1995) PiePad is a gesture-based entry method for numeric entry. Gestures were stylus strokes conforming to a clock metaphor: right for 3, down for 6, left for 9, and so on. Besides analysing the time to make gestures, they defined and used "preparation time" and "scripting time" as dependent variables. Preparation time was the time between gestures, from stylus up after the previous character to stylus down for the current character. Scripting time was the gesturing time, from stylus down to stylus up.
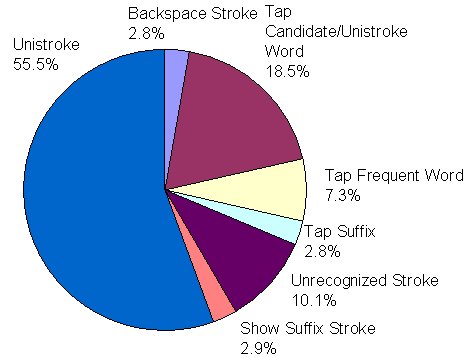
Devising specialized dependent variables is particularly useful for text entry methods that use word prediction or other language based acceleration techniques. As users engage acceleration opportunities, they exhibit a variety of behaviours that can be measured. In evaluating a stylus-based predictive system, MacKenzie, Chen, and Oniszczak (2006) logged all stylus strokes and taps, but also categorized these by function, as shown in Figure 4-7. The various stroke categories served as useful dependent variables in examining participants' usage patterns with the available acceleration aides.
Figure 4-7. Seven categories of stylus strokes or taps used as dependent variables in the evaluation of a handwriting recognition system with predictive aides (from MacKenzie et al., 2006)
Read text events, button errors, tilt errors, preparation time, and scripting time, keystrokes savings, and so on, are examples of dependent variables devised by researchers to gain insight into performance nuances of an entry technique. As one final comment, if a dependent variable is a count of the occurrence of an observable event, then it is useful to normalize it by converting the count into a ratio, for example, the number of such events per character of input. This facilitates comparisons across conditions, and potentially across studies. If, for example, we are interested in participants' error correcting behaviour and decide to use presses of the BACKSPACE key as a dependent variable for such, then it is more instructive to analyse and report on "BACKSPACE key presses per character" than the raw counts of presses of the BACKSPACE key.
Other Variables and Internal vs. External Validity
While consideration of the test conditions, or independent variables, is crucial in the design of an experiment, researchers need to be aware of three other types of variables: random, control, and confounding. Any circumstance that could affect performance is potentially an independent variable in an experiment. Standing vs. sitting vs. lying down; before lunch vs. after lunch; quiet vs. noisy; sun lighting vs. room lighting vs. dim lighting vs. no lighting; left handed users vs. right handed users; males vs. females; big keys vs. small keys; keys that click vs. keys that don't click; and so on. There is no limit to the possibilities. There are three choices: (1) to engage a circumstance as an independent variable, (2) to ignore a circumstance and expect that it varies in a random and representative way within the experiment (random variable), or (3) to limit a circumstance to one setting throughout the experiment (control variable). The first choice was discussed above. Of the random or control choices, there is a trade-off. This is best articulated in terms of two important concerns in experimental research: internal validity and external validity. External validity refers to the extent to which the effect observed is generalizable to other persons and situations. Internal validity is the extent to which the effect observed is due to the test conditions. To clarify, "effect observed" is the difference observed in a dependent variable across the settings of an independent variable, for example, observing an entry speed of 12 wpm for method A compared to 15 wpm for method B. Was the difference due to the methods or to something else (internal validity)? Is the same outcome likely with other people in other situations (external validity)? Table 4-1 summarizes.
Table 4-1
Relationship Between Random and Control Variables and Internal and External Validity
Variable Advantage Disadvantage Random Improves external validity by using typical situations and people Compromises internal validity by introducing additional variability in the measured behaviours Control Improves internal validity since differences in measured behaviours are more likely due to the test conditions Compromises external validity by limiting responses to a specific circumstance or a specific type of person
The third type of additional variable to consider is a confounding variable. A confounding variable is any circumstance that varies systematically with an independent variable. There are no advantages to confounding variables. They are an insidious defect in an experiment, and all researchers need to be wary of the possible presence of them. Here's an example. Let's say two keyboard layouts are compared and one is found to perform better on a dependent variable. If the keys were larger on one keyboard than on the other, then "Key Size" is a confounding variable because it varies systematically with "Keyboard Layout" (large for one, small for the other). Perhaps the effect observed was due to key size, not to keyboard layout. The solution is ensure that the keys are the same size on the two keyboards, or to include key size as an independent variable and to test both keyboard layouts with both key sizes.
4.3.4 Within-subjects vs. Between-subjects Designs
If the evaluation is comparative, as typically the case, then there is at least one factor in the experiment and this factor has at least two levels. The levels are the test conditions. If all participants are tested on all levels of a factor, the design is called a "within-subjects design" or a "repeated-measures design". In other words, the measurements gathered under one condition are repeated on the same participants for the other condition(s). The alternative to a within-subjects design is a between-subjects design. In this case, each participant is tested under one condition only. One group of participants is tested under condition A, a separate group under condition B, and so on.
There are a number of issues to consider in deciding whether an experimental factor should be assigned within subjects or between subjects. Sometimes there is no choice. For example, "Handedness" might be a factor in an experiment where a text entry technique is thought to have a bias favouring, say, right handed users over left handed users. In this case, handedness must be assigned between subjects, because a participant cannot be both left handed and right handed! Conversely, if an experiment seeks to investigate the acquisition of skill over multiple blocks of practice, then "Practice" is a factor in the experiment, with levels "Block 1", "Block 2", and so on. Clearly, the only option for Practice is within-subjects. No two ways about it!
However, in many situations, there is a choice. If so, a within-subjects design is generally preferred because effects due to the disposition of participants are minimized. Such effects are likely to be consistent across conditions. For example, a participant who is predisposed to be meticulous will likely exhibit such behaviour consistently across experimental conditions. This is beneficial because the variability in measurements is more likely due to differences among test conditions than to behavioural differences between participants (if a between-subjects design were used).
Despite the above-noted advantage of a within-subjects design, a between-subjects design is sometimes preferred due to interference between conditions. If the conditions under test involve conflicting motor skills, such as typing on keyboards with different arrangements of keys, then a repeated-measures may be is a poor choice because the required skill to operate one keyboard may inhibit, block, or otherwise interfere with, the skill required for the other keyboard. Such a factor may be assigned between-subjects (see MacKenzie et al., 2001 for an example).
If interference is not anticipated, or if the effect is minimal and easily mitigated through a few minutes of practice when a participant changes conditions, then a within-subjects design is the best choice.
4.3.5 Counterbalancing
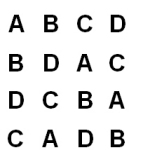
An additional effect must be accounted for in within-subjects designs: learning. For example, if two techniques, A and B, are compared and all participants used technique A first followed by B, then an improvement with B might occur simply because participants benefited from practice on A.6 The solution is counterbalancing, or splitting the participants into groups, testing half on A first followed by B, and half on B first followed by A. Learning effects, if any, should cancel. Counterbalancing is useful for more than two conditions also, and in this case grouping is done according to a Latin Square. The most common arrangements are shown in Figure 4-8. Note that in each case a condition appears precisely once in each row and column. For a balanced Latin Square, it is also true that each condition occurs before and after each other condition an equal number of times, thus improving the balance (see Figure 4-8d).
(a) (b)
(c)
(d)
Figure 4-8. Latin Squares (a) 2 by 2 (b) 3 by 3 (c) 4 by 4 (d) balanced 4 by 4. The distinguishing feature in the balanced Latin Square is that each condition occurs an equal number of times before and after each other condition.
Obviously, the number of groups required must divide evenly into the total number of participants. If three conditions are counterbalanced over 15 participants, each group has five participants.
4.3.6 Testing Research Questions
The "T" in ROT (see above) is for testable. Not only must research questions be repeatable and observable (we have dwelled on these in detail already), they must be testable. In text entry research, we often just want to know if a new entry technique is any good or if it is better than an existing or alternative technique. Fair enough, but "Is it good?" and "Is it better than…?" are not testable questions. We can evaluate techniques and ask participants their opinions, and this is certainly part of the process; but, usually, "good" or "better than" follows from the outcome on observable, measurable behaviours. That is, if participants enter text using method A "faster than" or "with fewer errors than" method B, it is usually true that their opinions align with their performance.
So, testable research questions are usually of the form "Is method A faster than method B?" or "Is method A more accurate than method B?" However, we're not quite there yet. Let's say we develop a new text entry technique ("A") and conduct an experiment according to the steps above, comparing the new technique with an alternative method ("B"). The data collected reveal 14.5 wpm for method A and 12.7 wpm for method B. Method A is about 15% faster than method B. Fair enough, but where is the test? The test lies in establishing whether the difference is significant or just a chance outcome. Since we are testing humans, variability in responses is inevitable. If the experiment were run again, no doubt the results would be slightly different. But, how much different? Would method B be faster! Clearly, this is a concern.
To answer the question, "Is method A faster than method B?" we use a statistical test called an analysis of variance (ANOVA).7 It is a test to determine if two or more mean scores are the same based on the variance in the constituent measures. More precisely, an ANOVA is a test of a null hypothesis, in this case "The entry speed for method A is the same as that for method B." Let's see how this is done. Consider the two hypothetical data sets in Figure 4-9. The outcome in both cases is the same, 14.5 wpm for method A and 12.7 wpm for method B.
(a) (b)
Figure 4-9. Hypothetical data sets for a text entry experiment. The mean entry speeds are the same in both data sets. In (a) the difference is significant. In (b) the difference is not significant. SD is the standard deviation in the measures used to compute the mean. See text for discussion.
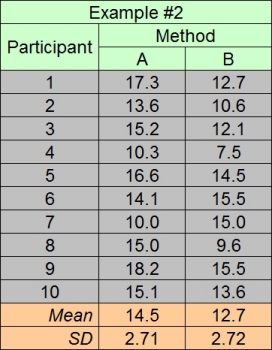
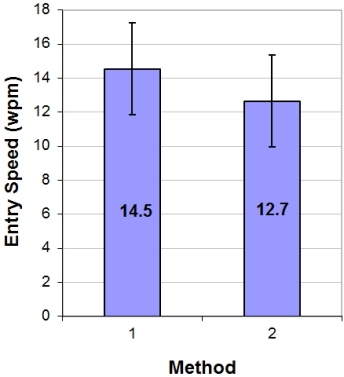
Figure 4-10 illustrates the difference in the data sets. An important embellishment in the charts is error bars showing, in this case, ±1 standard deviation in the constituent measures. Standard deviation is the square root of the variance. Even though the variance is tested, the standard deviation is more commonly articulated, since it has the same units as the mean. Either way, the error bars in Figure 4-10 clearly show the increased dispersion in the responses of the participants in Example #2. Further indication of this is evident by comparing the individual participant measures in Figure 4-9a and Figure 4-9b.
(a) (b)
Figure 4-10. Charts for data in Figure 4-9. The vertical lines on the bars show ±1 standard deviation in the measures forming the means. See text for discussion.
The ANOVA is performed with a statistics program, the full details of which are beyond the scope of this chapter. For the data in Figure 4-9a, an ANOVA produces a table as in Figure 4-11.8 In a research paper, the results would appear somewhat as follows: "The text entry speeds were 14.5 wpm for Method A and 12.7 wpm for Method B, suggesting about a 15% performance advantage for Method A. The difference was statistically significant (F1,9 = 19.0, p < .005), as determined using an analysis of variance."
Figure 4-11. ANOVA table for data in Figure 4-9a.
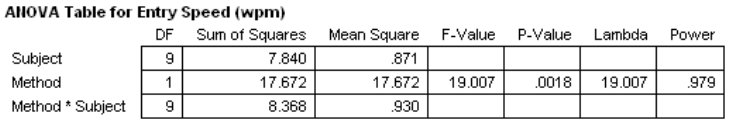
The ANOVA result is given in parentheses. First, the F statistic appears along with the degrees of freedom for the effect and the residual sources of variation (method = 1, method * subject = 9, respectively). Following the F statistic is p, the probability that the hypothesis is true. (Remember that the hypothesis is expressed in the null form; namely, that there is no difference.) For Example #1, evidently there is only a .0018 probability that the entry speed for method A is the same as that for method B. That's pretty low, thus we reject the hypothesis and conclude that the difference in the means is statistically significant. The threshold for significance is typically any value of p lower than .05 or a 1 in 20 chance. Instead of reporting a precise value, p is rounded to the more conservative of the thresholds .05, .01, .005, .001, .0005, or .0001. So, in this case, p is rounded from .0018 to .005. By the way, the difference in the entry speed for method A and method B in Example #2 was not statistically significant (F1,9 = 3.83, p > .05). As a final note, "statistically significant" does not imply that the difference is important, useful, or meaningful. Whether a 15% performance advantage is important for design success or commercial viability is not within the purview of statistical tests.
4.4 Learning
We spoke above about learning as a behaviour to balance out, to cancel, as though it were an undesirable human condition. While learning can confound other effects in within-subjects designs, the human trajectory in skill acquisition is often the most crucial aspect of a text entry method. How quickly can a method be learned, and with what performance outcomes? Are the intended users consumers with high expectations for immediate usability? Are they high-use experts willing to invest considerable effort in learning the method? In recognition of this diversity in the user community, researchers often investigate learning in their research program. The trajectory of humans learning a skill is shown in Figure 4-12. As our emphasis is on comparative evaluation, two curves are shown, one for a new technique and one for a current or alternative technique serving as a point of comparison.
Figure 4-12. Improved performance with practice. A new technique outperforms an existing technique, but not initially.
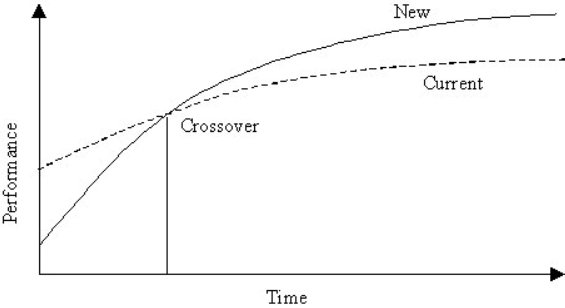
The curves show a performance metric, perhaps text entry speed, plotted against the time invested in learning the techniques. Curves following a power function are shown, but logarithmic scales are sometimes used for the axes, and this produces a plot with straight lines (e.g., Card et al., 1978). The curves reveal a crossover point, wherein one technique, after sufficient practice, outperforms the other. The equation for the performance-time relationship in Figure 4-12 is built using linear regression, by regressing the observed performance data on the block or session number in which the data were gathered. Gathering the data is labour intensive because a longitudinal study is required, wherein testing proceeds over a prolonged period of time. This is shown in Figure 4-13 for an experiment comparing text entry speeds for two soft keyboard layouts over twenty sessions of practice (MacKenzie & Zhang, 1999).
(a) (b)
Figure 4-13. Power law of learning for an experiment comparing two soft keyboard layouts. (a) data. (b) learning curves and extrapolations to the 50th session (from MacKenzie & Zhang, 1999).
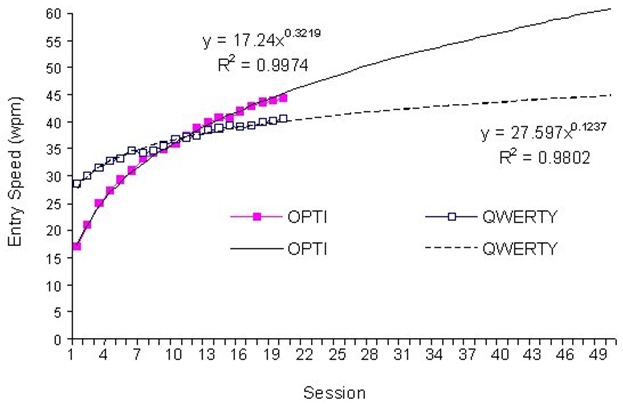
The equation for each condition is shown beside the curves in Figure 4-13b. The equation is in the power form, and is derived using a statistics application or a spreadsheet such as Microsoft Excel. The crossover phenomenon in Figure 4-12 appears at the 10th session in Figure 4-13. An extrapolation beyond the period of practice is also shown, although this obviously bears increasing inaccuracy the further it extends beyond the test period.
While the plots in Figure 4-13b are instructive, often the most significant point is the first one – the measured performance during initial exposure to the technique. This point reflects the walk-up usability (aka immediate usability) of the technique. Researchers are often seeking to develop a text entry technique that improves on a current, established, but less-than-ideal technique. If there is a community of users familiar with the current technique, it is a tough sell to convince them to switch. Performance advantages of a new technique are often expected with minimal effort. In view of this researchers have developed evaluation methodologies designed specifically to capture the immediately usability of a technique, for example, by limiting and tightly controlling participants exposure to the technique. In one experiment, participants were given just one minute of exposure before performance measures were gathered (MacKenzie & Zhang, 1997). A second round of testing was done following an additional five minutes of exposure. Others have adopted similar evaluation methods (Koltringer & Grechenig, 2004; MacKenzie & Zhang, 2001; Wobbrock, Aung, Rothrock, & Myers, 2005).
4.5 Summary and Further Readings
This chapter on evaluation techniques has been crafted in the language of text entry research. It has also been pared down for delivery in a single chapter. Indeed, there is considerably more to evaluation than can fit in this space. We have, for example, not commented on the potential problems of asymmetric skill transfer in within-subjects designs, or post hoc comparison tests to determine which conditions differ significantly from which others (when more than two conditions are tested). Other issues in experiment design are just as important, such as participant consent, the method of selecting participants, and sequencing of conditions in more complex experiment designs.
Two references on experimental methods the author finds particularly useful are the Publication manual of the American Psychological Association (APA, 2001) and Martin's Doing psychology experiments (Martin, 2004). It is also worthwhile just to study research papers that present experimental evaluations that are comparative and empirical, both in text entry and on other topics in human-computer interaction. Quite a few papers are cited in the pages above, but, in closing, there are a few others to consider that present experimental methodologies for text entry that include learning models similar to Figure 4-13 (Bellman & MacKenzie, 1998; Isokoski & Raisamo, 2004; Lyons, Starner, & Gane, in press; MacKenzie et al., 2001; McQueen et al., 1995; Wigdor & Balakrishnan, 2003; Wobbrock, Myers, & Rothrock, 2006).
References
Agarwal, A., & Simpson, R. (2005). User modeling for individuals with disabilities: a pilot study of word prediction. Proceedings of the 7th International ACM SIGACCESS Conference on Computers and Accessibility - ASSETS '05, 218-219. New York: ACM. https://doi.org/10.1145/1090785.1090838
Alsio, G., & Goldstein, M. (2000). Productivity prediction by extrapolation: Using workload memory as a predictor of target performance. Behaviour & Information Technology, 19, 87.96.
APA. (2001). Publication manual of the American Psychological Association (5th ed.). Washington, DC: APA.
Bailey, R. W. (1996). Human performance engineering: Designing high quality, professional user interfaces for computer products, applications, and systems (3rd ed.). Upper Saddle River, NJ: Prentice Hall. https://dl.acm.org/doi/abs/10.5555/235237
Bellman, T., & MacKenzie, I. S. (1998). A probabilistic character layout strategy for mobile text entry. Proceedings of Graphics Interface '98, 168-176. Toronto: Canadian Information Processing Society. https://www.yorku.ca/mack/gi98.pdf
Card, S. K., English, W. K., & Burr, B. J. (1978). Evaluation of mouse, rate-controlled isometric joystick, step keys, and text keys for text selection on a CRT. Ergonomics, 21, 601-613. https://doi.org/10.1080/00140137808931762
Card, S. K., Moran, T. P., & Newell, A. (1980). The keystroke-level model for user performance time with interactive systems. Communications of the ACM, 23, 396-410. https://dl.acm.org/doi/pdf/10.1145/358886.358895
Cooper, A. (1999). The inmates are running the asylum. Indianapolis, Indiana: Sams. Economist. (2004, July 10). Je ne texte rien. The Economist, vol. 372, p. 85. https://link.springer.com/chapter/10.1007/978-3-322-99786-9_1
Fleetwood, M. D., Byrne, M. D., Centgraf, P., Dudziak, K. Q., Lin, B., & Mogilev, D. (2002). An evaluation of the text-entry in Palm OS: Graffiti and the virtual keyboard. Proceedings of the Human Factors and Ergonomics 46th Annual Meeting - HFES 2002, 617-621. Santa Monica, CA: HFES. https://doi.org/10.1177/154193120204600504
Gentner, D. R., Grudin, J. T., Larochelle, S., Norman, D. A., & Rumelhart, D. E. (1983). A glossary of terms including a classification of typing errors. In W. E. Cooper (Ed.), Cognitive aspects of skilled typewriting (pp. 39-44): New York: Springer. https://doi.org/10.1007/978-1-4612-5470-6_2
Gong, J., Haggerty, B., & Tarasewich, P. (2005). An enhanced multitap text entry method with predictive next-letter highlighting. Extended Abstracts of the ACM Conference on Human Factors in Computing Systems - CHI 2005, 1399-1402. New York: ACM. https://doi.org/10.1145/1056808.1056926
Hwang, S., Geehyuk, L., Jeong, B., Lee, W., & Cho, H. (2005). FeelTip: Tactile input device for small wearable information appliances. Extended Abstracts of the ACM Conference on Human Factors in Computing Systems - CHI 2005, 1475-1478. New York: ACM. https://doi.org/10.1145/1056808.1056945
Isokoski, P., & Raisamo, R. (2004). Quikwriting as a multi-device text entry method. Proceedings of the Third Nordic Conference on Human-Computer Interaction - NordiCHI 2004, 105-108. New York: ACM. https://doi.org/10.1145/1028014.1028031
James, C. L., & Reischel, K. M. (2001). Text input for mobile devices: Comparing model prediction to actual performance. Proceedings of the ACM Conference on Human Factors in Computing Systems - CHI '01, 365-371. ACM Press. https://doi.org/10.1145/365024.365300
Koltringer, T., & Grechenig, T. (2004). Comparing the immediate usability of graffiti 2 and virtual keyboard. Extended Abstracts of the ACM Conference on Human-Factors in Computing Systems - CHI 2004, 1175-1178. New York: ACM. https://doi.org/10.1145/985921.986017
Lyons, K., Starner, T., & Gane, B. (in press). Experimental evaluation of the Twiddler one-handed chording mobile keyboard. Human-Computer Interaction. https://doi.org/10.1207/s15327051hci2104_1
Lyons, M. J., Chan, C.-H., & Tetsutani, N. (2004). MouthType: Text entry by hand and mouth. Proceedings of the ACM Conference on Human Factors in Computing Systems - CHI 2004, 1383-1386. New York: ACM. https://doi.org/10.1145/985921.986070
MacKenzie, I. S. (2002). Mobile text entry using three keys. Proceedings of the Second Nordic Conference on Human-Computer Interaction - NordiCHI 2002, 27-34. New York: ACM. https://doi.org/10.1145/572020.572025
MacKenzie, I. S. (2003). Motor behaviour models for human computer interaction. In J. M. Carroll (Ed.), HCI models, theories, and frameworks: Toward a multidisciplinary science (pp. 27-54): San Francisco: Morgan Kaufmann. https://sistemas-humano-computacionais.wdfiles.com/local--files/capitulo:modelagem-e-simulacao-de-humanos/mackenzie%2003.pdf
MacKenzie, I. S., Chen, J., & Oniszczak, A. (2006). Unipad: Single-stroke text entry with language-based acceleration. Proceedings of the Fourth Nordic Conference on Human- Computer Interaction - NordiCHI 2006, (to appear). https://doi.org/10.1145/1182475.1182484
MacKenzie, I. S., Kober, H., Smith, D., Jones, T., & Skepner, E. (2001). LetterWise: Prefix-based disambiguation for mobile text entry. Proceedings of the ACM Conference on User Interface Software and Technology - UIST 2001, 111-120. New York: ACM. https://doi.org/10.1145/502348.502365
MacKenzie, I. S., Nonnecke, R. B., Riddersma, S., McQueen, C., & Meltz, M. (1994). Alphanumeric entry on pen-based computers. International Journal of Human-Computer Studies, 41, 775-792. https://doi.org/10.1006/ijhc.1994.1081
MacKenzie, I. S., & Soukoreff, R. W. (2002a). A character-level error analysis technique for evaluating text entry methods. Proceedings of the Second Nordic Conference on Human- Computer Interaction - NordiCHI 2002, 241-244. New York: ACM. https://doi.org/10.1145/572020.572056
MacKenzie, I. S., & Soukoreff, R. W. (2002b). Text entry for mobile computing: Models and methods, theory and practice. Human-Computer Interaction, 17, 147-198. https://doi.org/10.1080/07370024.2002.9667313
MacKenzie, I. S., & Soukoreff, R. W. (2003). Phrase sets for evaluating text entry techniques. Extended Abstracts of the ACM Conference on Human Factors in Computing Systems - CHI 2003, 754-755. New York: ACM. https://doi.org/10.1145/765891.765971
MacKenzie, I. S., & Zhang, S. X. (1997). The immediate usability of Graffiti. Proceedings of Graphics Interface '97, 120-137. Toronto: Canadian Information Processing Society. https://www.yorku.ca/mack/GI97a.pdf
MacKenzie, I. S., & Zhang, S. X. (1999). The design and evaluation of a high-performance soft keyboard. Proceedings of the ACM Conference on Human Factors in Computing Systems - CHI '99, 25-31. New York: ACM. https://doi.org/10.1145/302979.302983
MacKenzie, I. S., & Zhang, S. X. (2001). An empirical investigation of the novice experience with soft keyboards. Behaviour & Information Technology, 20, 411-418. https://doi.org/10.1080/01449290110089561
Majaranta, P., MacKenzie, I. S., Aula, A., & Raiha, K.-J. (2003). Auditory and visual feedback during eye typing. Extended Abstracts of the ACM Conference on Human Factors in Computing Systems - CHI 2003, 766-767. New York: ACM. https://doi.org/10.1145/765891.765979
Martin, D. W. (2004). Doing psychology experiments (6th ed.). Belmont, CA: Wadsworth. https://psycnet.apa.org/record/2001-06929-000
Matias, E., MacKenzie, I. S., & Buxton, W. (1996). One-handed touch typing on a QWERTY keyboard. Human-Computer Interaction, 11, 1-27. https://doi.org/10.1207/s15327051hci1101_1
McQueen, C., MacKenzie, I. S., & Zhang, S. X. (1995). An extended study of numeric entry on pen-based computers. Proceedings of Graphics Interface '95, 215-222. Toronto: Canadian Information Processing Society. https://www.yorku.ca/mack/GI95.html
Montgomery, E. B. (1980). Data input system (United States Patent 4,211,497).
Montgomery, E. B. (1982). Bringing manual input into the 20th century: New keyboard concepts. Computer, 15(1), 11-18. https://doi.ieeecomputersociety.org/10.1109/MC.1982.1653969
Oniszczak, A., & MacKenzie, I. S. (2004). A comparison of two input methods for keypads on mobile devices. Proceedings of the Third Nordic Conference on Human-Computer Interaction - NordiCHI 2004, 101-104. New York: ACM. https://doi.org/10.1145/1028014.1028030
Pavlovych, A., & Stüerzlinger, W. (2003). Less-Tap: A fast and easy-to-learn text input technique for phones. Proceedings of Graphics Interface 2003, 97-104. Toronto: Canadian Information Processing Society.
Perlin, K. (1998). Quikwriting: Continuous stylus-based text entry. Proceedings of the ACM Symposium on User Interface Software and Technology - UIST '98, 215-216. New York: ACM. https://dl.acm.org/doi/pdf/10.1145/288392.288613
Potosnak, K. M. (1988). Keys and keyboards. In M. Helander (Ed.), Handbook of human- computer interaction (pp. 475-494). Amsterdam: Elsevier. https://doi.org/10.1016/B978-0-444-70536-5.50026-9
Rau, H., & Skiena, S. (1994). Dialing for documents: An experiment in information theory. Proceedings of the ACM Symposium on User Interface Software and Technology - UIST '94, 147-154. New York: ACM. https://doi.org/10.1145/192426.192488
Read, J. (2005). The usability of digital ink technologies for children and teenagers. People and Computers XIX: Proceedings of HCI 2005, 19-25. Berlin: Springer. https://doi.org/10.1007/1-84628-249-7_2
Soukoreff, R. W., & MacKenzie, I. S. (2001). Measuring errors in text entry tasks: An application of the Levenshtein string distance statistic. Extended Abstracts of the ACM Conference on Human Factors in Computing - CHI 2001, 319-320. New York: ACM. https://doi.org/10.1145/634067.634256
Soukoreff, R. W., & MacKenzie, I. S. (2003). Metrics for text entry research: An evaluation of MSD and KSPC, and a new unified error metric. Proceedings of the ACM Conference on Human Factors in Computing Systems - CHI 2003, 113-120. New York: ACM. https://doi.org/10.1145/642611.642632
Soukoreff, R. W., & MacKenzie, I. S. (2004). Recent developments in text-entry error rate measurement. Extended Abstracts of the ACM Conference on Human Factors in Computing Systems - CHI 2004, 1425-1428. New York: ACM. https://doi.org/10.1145/985921.986081
Spakov, O., & Miniotas, D. (2004). On-line adjustment of dwell time for target selection by gaze. Proceedings of the Third Nordic Conference on Human-Computer Interaction - NordiCHI 2004, 203-206. New York: ACM. https://doi.org/10.1145/1028014.1028045
Ward, D. J., Blackwell, A. F., & MacKay, D. J. C. (2000). Dasher: A data entry interface using continuous gestures and language models. Proceedings of the ACM Symposium on User Interface Software and Technology - UIST 2000, 129-137. New York: ACM. https://doi.org/10.1145/354401.354427
Wigdor, D., & Balakrishnan, R. (2003). TiltText: Using tilt for text input to mobile phones. Proceedings of the ACM Symposium on User Interface Software and Technology - UIST 2003, 81-90. New York: ACM. https://doi.org/10.1145/964696.964705
Wigdor, D., & Balakrishnan, R. (2004). A comparison of consecutive and concurrent input text entry techniques for mobile phones. Proceedings of the ACM Conference on Human Factors in Computing Systems - CHI '04, 81-88. New York: ACM. https://doi.org/10.1145/985692.985703
Wobbrock, J. O., Aung, H. H., Rothrock, B., & Myers, B. A. (2005). Maximizing the guessability of symbolic input. Extended abstracts of the ACM Conference on Human Factors in Computing Systems - CHI 2005, 1869-1872. New York: ACM. https://doi.org/10.1145/1056808.1057043
Wobbrock, J. O., Myers, B. A., & Aung, H. H. (2004). Writing with a joystick: a comparison of date stamp, selection keyboard, and EdgeWrite. Proceedings of the 2004 Conference on Graphics Interface - GI 2004, 1-8. Toronto, Canada: CIPS.
Wobbrock, J. O., Myers, B. A., & Rothrock, B. (2006). Few-key text entry revisited: Mnemonic gestures on four keys. ACM Conference on Human Factors in Computing Systems - CHI 2006, 489-492. New York: ACM. https://doi.org/10.1145/1124772.1124846
Yamada, H. (1980). A historical study of typewriters and typing methods: From the position of planning Japanese parallels. Journal of Information Processing, 2, 175-202. https://ipsj.ixsq.nii.ac.jp/records/60002
Footnotes
1. To this author's knowledge, no user test has ever been performed on this keyboard, nor has it appeared in any commercial product.
2. Graffiti is the stylus-based single-stroke per symbol text entry method used on Palm's Personal Digital Assistants (www.palm.com).
3. The mockery made of the handwriting recognition on Apple's Newton by cartoonist Garry Trudeau in Doonesbury is a specific example (see MacKenzie & Soukoreff, 2002b).
4. It has been a convention since about 1905 to standardize the computation of text entry speed in "words per minute", where a word is defined as five keystrokes (Yamada, 1980, p. 182). This includes letters, spaces, punctuation, and so on. Although some researchers use actual word size (e.g., James & Reischel, 2001), this is inappropriate since it allows entry speed to be inflated by testing with phrases containing predominantly short words. It also hinders comparisons between languages with different mean word sizes.
5. Prior to about ten years ago, the term "subjects" was used. The shift to "participants" reflects a degree of respect and gratitude for the contribution made by those who assist in research by participating as subjects.
6. The alert reader will notice that learning, as just described, is a confounding variable.
7. If only two means are compared, then a "t test" is the same as an ANOVA. In practice, usually more than two conditions are compared (as, for example, six in the 3 × 2 design discussed earlier), so the discussion here uses an ANOVA.
8. Created by Statview, now marketed as JMP (www.jmp.com).