MacKenzie, I. S. (1992). Fitts' law as a research and design tool in human-computer interaction. Human-Computer Interaction, 7, 91-139. doi:10.1207/s15327051hci0701_3. [PDF]
Fitts' Law as a Research and Design Tool in Human-Computer Interaction
I. Scott MacKenzie
University of Toronto
ABSTRACT
According to Fitts' law, human movement can be modeled by analogy to the transmission of information. Fitts' popular model has been widely adopted in numerous research areas, including kinematics, human factors, and (recently) human-computer interaction (HCI). The present study provides a historical and theoretical context for the model, including an analysis of problems that have emerged through the systematic deviation of observations from predictions. Refinements to the model are described, including a formulation for the index of task difficulty that is claimed to be more theoretically sound than Fitts' original formulation. The model's utility in predicting the time to position a cursor and select a target is explored through a review of six Fitts' law studies employing devices such as the mouse, trackball, joystick, touchpad, helmet-mounted sight, and eye tracker. An analysis of the performance measures reveals tremendous inconsistencies, making across-study comparisons difficult. Sources of experimental variation are identified to reconcile these differences.
CONTENTS
1. INTRODUCTION
2. SUMMARY OF FITTS' LAW
2.1. Information Theory Foundation
2.2. Equation by Parts
2.3. Physical Interpretation
2.4. Derivation From a Theory of Movement
3. DETAILED ANALYSIS
3.1. The Original Experiments
3.2. Problems Emerge
3.3. Variations on Fitts' Law
3.4. Effective Target Width
3.5. Reanalysis of Fitts' Data
3.6. Effective Target Amplitude
3.7. Targets and Angles
4. COMPETING MODELS
4.1. The Linear Speed-Accuracy Tradeoff
4.2. Power Functions
5. APPLICATIONS OF FITTS' LAW
5.1. The Generality of Fitts' Law
5.2. Review of Six Studies
Card, English, and Burr (1978)
Drury (1975)
Epps (1986)
Jagacinski and Monk (1985)
Kantowitz and Elvers (1988)
Ware and Mikaelian (1987)
5.3. Across-Study Comparison of Performance Measures
5.4. Sources of Variation
Device Differences
Task Differences
Selection Technique
Range of Conditions and Choice of Model
Approach Angle and Target Width
Error Handling
Learning Effects
5.5. Summary
6. CONCLUSIONS
1. INTRODUCTION
Fitts' law is a model of human psychomotor behavior derived from Shannon's Theorem 17, a fundamental theorem of communication systems (Fitts, 1954; Shannon & Weaver, 1949). The realization of movement in Fitts' model is analogous to the transmission of information. Movements are assigned indices of difficulty (in units of bits), and in carrying out a movement task the human motor system is said to transmit so many "bits of information." If the number of bits is divided by the time to move, then a rate of transmission in "bits per second" can be ascertained.
In the decades since Fitts' original publication, his relationship, or law, has proven one of the most robust, highly cited, and widely adopted models to emerge from experimental psychology. Psychomotor studies in diverse settings – from under a microscope to under water – have consistently shown high correlations between Fitts' index of difficulty and the time to complete a movement task. Kinematics and human factors are two fields particularly rich in investigations of human performance using Fitts' analogy.
In the relatively new discipline of HCI, there is also an interest in the mathematical modeling and prediction of human performance using an information-processing model. The starting point for Fitts' law research in HCI is the work of Card, English, and Burr (1978). In comparing four devices for selecting text on a CRT display, the model provided good performance predictions for the joystick and mouse. More than 80% of the variation in movement time was accounted for by the regression equations. In the subsequent Keystroke-Level Model for predicting user performance times (Card, Moran, & Newell, 1980), Fitts' law was cited as an appropriate tool for predicting pointing time but was omitted from the model in lieu of a constant. The value tP = 1.10 s was derived from the Fitts' law prediction equation in Card et al. (1978) and served as a good approximation for pointing time over the range of conditions employed. Similarly, the Model Human Processor of Card, Moran, and Newell (1983, p. 26) comprises nine principles of operation. These have been the focus of a substantial body of empirical research leading to a psychological model of the human as an information processor. As the performance model for the human motor processor, Fitts' law, Principle P5, plays a prominent role in the Model Human Processor.
The need for a reliable prediction model of movement time in computer input tasks is stronger today than ever before. Bit-mapped graphic displays have all but replaced character-mapped displays, and office and desktop metaphors are gaining in popularity over menus and command lines. Today's user interfaces often supplant cursor keys and function keys with mice and pull-down menus. As the man-machine link gets more "direct," speed-accuracy models for human movement become ever closer to actions in human-computer dialogues. Design models, such as the Keystroke-Level Model, need to express the current range of movement activities in computer input tasks. Fitts' law can fill that need.
This study endeavors to critically assess the current state of Fitts' law and to suggest ways in which future research and design may benefit from a rigorous and slightly corrected adaptation of this powerful model. Newell and Card (1985) expanded on the role for theoretical models in the design of human-computer interfaces:
Another way [for theory to participate] is through explicit computer program tools for the design. The theory is embodied in the tool itself, so that when the designer uses the tool, the effect of the theory comes through, whether he or she understands the theory or not. (p. 223)Psychological theories and experiments, such as Fitts' index of difficulty … can shape the way a designer thinks about a problem. Analyses of the key constraints of a problem can point the way to fertile parts of the design space. Providing tools for thought is a more effective way of getting human engineering into the interface than running experiment comparisons between alternative designs. (p. 238)
Certainly though, conducting empirical experiments to validate models is the starting point. Putting the theory into tools comes later. When properly applied and integrated into tools, however, theories may indeed elicit new ways of thinking for designers.
The theory underlying Fitts' relationship is sufficiently complex, and the ideas presented here are so subtle that a thorough analysis of the model is warranted before examining its applications. We begin with an overview of the most common interpretation of the law and then review the original experiments. Unlike many models that through statistical techniques yield parameters and constants void of physical interpretation, a key feature of Fitts' law is the correspondence to physical properties underlying movement tasks. An interpretation is offered for each term in the equation.
In the wake of the consistent departure of observations from predictions, many follow-up studies questioned the validity of the model. An analysis of Fitts' original data highlights these problems, with a correction offered that brings the model closer to the information theorem on which it is based. To complete the picture, several competing models are presented and compared with Fitts' law. Other research revealing the generality of the model in diverse and unusual settings is cited.
With this foundation, we undertake the task of connecting the theory to practical problems in HCI. Six studies are surveyed where Fitts' law was applied to input tasks using devices such as the mouse, trackball, joystick, touchpad, helmet-mounted sight, and eye tracker. Unfortunately, the results vary considerably, making across-study comparisons difficult. It is shown that task differences, selection techniques, range of conditions employed, and dealing with response variability (viz., errors) are among the major sources of experimental variation. An understanding of these increases the potential for valid across-study comparisons and allows designers to benefit from a substantial body of existing Fitts' law research.
2. SUMMARY OF FITTS' LAW
Following the work of Shannon, Wiener, and other information theorists in the 1940s, information models of psychological processes emerged with great fanfare in the 1950s (e.g., see Miller, 1953; Pierce, 1961, chap. 12). The terms probability, redundancy, bits, noise, and channels entered the vocabulary of experimental psychologists as they explored the latest technique of measuring and modeling human behavior. Two surviving models are the Hick-Hyman law for choice reaction time (Hick, 1952; Hyman, 1953) and Fitts' law for the channel capacity of the human motor system (Fitts, 1954; Fitts & Peterson, 1964).
2.1. Information Theory Foundation
Fitts' idea was novel for two reasons: First, it suggested that the difficulty of a task could be measured using the information metric bits; second, it introduced the idea that, in carrying out a movement task, information is transmitted through a channel – a human channel. With respect to electronic communications systems, the concept of a channel is straightforward: A signal is transmitted through a non-ideal medium (such as copper or air) and is perturbed by noise. The effect of the noise is to limit the information capacity of the channel below its theoretical maximum. Shannon's Theorem 17 expresses the effective information capacity C (in bits/s) of a communications channel of bandwidth B (in 1 / s or Hz) as:
| C = B log2((S + N) / N), | (1) |
where S is the signal power and N is the noise power (Shannon & Weaver, 1949, pp. 100-103).
The notions of channel and channel capacity are not as straightforward in the domain of human performance. The problem lies in the measurement of human channel capacity. Although electronic communications systems transmit information with specific and optimized codes, this is not true of human channels. Human coding is ill-defined, personal, and often irrational or unpredictable. Optimization is dynamic and intuitive. Cognitive strategies emerge in everyday tasks through chunking, which is analogous to coding in information theory – the mapping of a diverse pattern (or complex behavior) into a simple pattern (or behavior). Neuromuscular coding emerges through the interaction of nerve, muscle, and limb groups during the acquisition and repetition of skilled behavior. Difficulties in identifying and measuring cognitive and neuromuscular factors confound the measurement of the human channel capacity, causing tremendous variation to surface in different experiments seeking to investigate similar processes.
2.2. Equation by Parts
Fitts sought to establish the information capacity of the human motor system. This capacity, which he called the index of performance (IP), is analogous to channel capacity (C) in Shannon's theorem. IP is calculated by dividing a motor task's index of difficulty (ID) by the movement time (MT) to complete a motor task. Thus,
| IP = ID / MT. | (2) |
Equation 2 parallels Equation 1 directly, with IP matching C (in bits/s), ID matching the log term (in bits), and MT matching 1 / B (in seconds).
Fitts claimed that electronic signals are analogous to movement distances or amplitudes (A) and that noise is analogous to the tolerance or width (W) of the region within which a move terminates. Loosely based on Shannon's logarithmic expression, the following was offered as the index of difficulty for a motor task:
| ID = log2(2 A / W) | (3) |
Because A and W are both measures of distance, the ratio within the logarithm is without units. The use of bits as the unit of task difficulty stems from the somewhat arbitrary choice of base 2 for the logarithm. (Had base 10 been used, the units would be digits.)
A useful variation of Equation 2 places MT on the left as the predicted variable:
| MT = ID / IP. | (4) |
This relationship is tested by devising a series of movement tasks with ID (viz., A and W) as the independent variable and MT as the dependent variable. In an experimental setting, subjects move to and acquire targets of width W at a distance A as quickly and accurately as possible. (Accurate, for the moment, implies a small but consistent error rate.) Several levels are provided for each of A and W, yielding a range of task difficulties.
The index of performance IP can be calculated directly using Equation 2 by dividing a task's index of difficulty by the observed movement time (averaged over a block of trials), or it can be determined by regressing MT on ID. In the latter case, the regression line equation is of the form:
| MT = a + b ID, | (5) |
where a and b are regression coefficients. The reciprocal of the slope coefficient, 1 / b, corresponds to IP in Equation 4.1 The usual form of Fitts' law is Equation 5 expanded as follows:
| MT = a + b log2(2 A / W). | (6) |
The factor 2 in the logarithm was added by Fitts as an arbitrary adjustment to ensure that ID was greater than zero for the range of experimental conditions employed in his experiments (Fitts, 1954, p. 388). The 2 increases the index of difficulty by 1 bit for each task condition but does not affect the MT-ID correlation or the slope of the regression line.2
2.3. Physical Interpretation
A common experimental method for model building is the stepwise entering of parameters into a regression analysis on an ad hoc basis. Although the goal of accounting for variation in observed behavior is met, there is a cost:
over-parameterization . . . presents difficulties in terms of interpreting the meaning of parameter variations. This subverts some of the purposes of modeling, namely, providing succinct explanations of data and providing assistance in designing experiments. (Rouse, 1980, p. 6)
This is not the case with Fitts' law. A key feature of the model is the physical interpretation afforded by the parameters and empirically determined constants in the prediction equation.
As measures of magnitude, target amplitude and target width have straightforward interpretations: Big targets at close range are acquired faster than small targets at a distance. But the model predicts movement time as a function of a task's index of difficulty – the logarithm of the ratio of target amplitude to target width. This is a very convenient relationship. From Equation 3, task difficulty (ID) increases by 1 bit if target distance is doubled or if the size is halved. Thus, ID provides a useful, single measure of the combined effect of two physical properties of movement tasks.
The intercept (a) and slope (b) coefficients in Equation 6 are empirically determined constants. Ideally the intercept is zero, suggesting that a task of zero difficulty takes 0 s; however, linear regression usually produces a nonzero value. Although the magnitude of the intercept is viewed by some as an indication of the model's accuracy, a substantial positive intercept indicates the presence of an additive factor unrelated to the index of difficulty. Target acquisition tasks on computers are particularly sensitive to additive factors. The select operation, which typically follows pointing, may entail a button push, the application of pressure, dwell time, and so on. These responses should have an additive effect, contributing to the intercept of the regression line but not to the slope.
Fitts' index of performance is the reciprocal of the regression line slope and carries the units bits per second. In executing a movement task, ID is the number of bits of information transmitted, and IP is the rate of transmission. Although it is glossed over in many accounts of the model, Fitts' thesis was that IP is constant across a range of values for ID. It follows that the relationship between MT and ID is linear. His experiments provided strong evidence to support this claim, as has a large body of subsequent research.
Many studies have sought to establish the human rate of information processing in diverse settings. Langolf, Chaffin, and Foulke (1976) tested different limb groups and found that IP decreased as the limb changed from the finger to the wrist to the arm. This implies that large, cumbersome limbs are more sensitive to changes in ID than small dexterous limbs. There is a vital role for this sort of knowledge in the design of high-performance man-machine interfaces.
2.4. Derivation From a Theory of Movement
Fitts deduced his model by analogy. Trying to explain why the analogy works so well and to justify the model from a low-level account of the underlying phenomena has challenged psychomotor researchers ever since. Devising a theory and providing a derivation is not so simple, however. Pew and Baron (1983, p. 664) claimed that:
There is no useful distinction between models and theories. We assert that there is a continuum along which models vary that has loose verbal analogy and metaphor at one end and closed-form mathematical equations at the other, and that most models lie somewhere in-between.Fitts' law may be placed in this continuum. As a mathematical expression, it emerged from the rigors of probability theory, yet when applied to psychomotor behavior it becomes a metaphor. Derivations of the law, therefore, must build on assumptions – assumptions on the perceptual, psychological, and physiological processes underlying human movement. A derivation explains a model well if it requires only a few simple assumptions that can be validated in the laboratory.
The most accepted derivation originates from the deterministic iterative-corrections model, originally offered by Crossman and Goodeve (1963/1983) and developed subsequently by others (e.g., Keele, 1968; Langolf et al., 1976). The derivation builds on the underlying assumption that a complete move is realized through iterations of feedback-guided corrective submovements. A move is assumed to take n submovements, each taking a constant time of t seconds to complete. It follows that the time to complete a move is nt seconds. A constant of proportionality (p) is introduced such that for each submovement the distance covered is 1 − p times the distance remaining.
Based on these assumptions, the derivation proceeds as follows. After the first submovement in a move of total distance A, the distance moved is (1 - p)A and the distance remaining is pA. After the second submovement, the distance moved is (1 - p)pA and the distance remaining is ppA or p2A. After n submovements, the distance remaining is pnA. Completing a move within the target implies that the distance remaining is ≤ ½W. Setting pnA = ½W and solving for n yields b' log2(2A/W), where b' is the constant −l / log2p (which must be > 1 because 0 < p < 1). The time to complete a move is MT = nt = b log2(2A/W), where b is the positive constant b't. This is the same as Fitts' law (Equation 6) except the intercept, a, is missing. The intercept may be accounted for by noting that the first move should take less than t (by a constant a) because the time to decide how far to move initially occurs before a move begins (Keele, 1968).
One way of testing the derivation is to fix values for t and p, and calculate b. Estimates for t, the time to process visual feedback, are in the range of 135 ms to 290 ms (Beggs & Howarth, 1970; Carlton, 1981; Crossman & Goodeve, 1963/1983; Keele & Posner, 1968). The proportional error constant, p, is between .04 and .07 (Langolf et al., 1976; Meyer, Abrams, Kornblum, Wright, & Smith, 1988; Pew, 1974; Schmidt, 1988, p. 275; Vince, 1948). Using t = 290 ms and p = .07 yields b = −t / log2p = 75.6 ms/bit or IP = 1 / b = 13.2 bits/s, a value close to that found by Fitts (Fitts & Peterson, 1964).
Despite the appealing simplicity of the deterministic iterative-corrections model, the underlying assumptions are suspect. Langolf et al. (1976) found that some movements have only one correction despite the prediction of several corrective submovements when A / W is appreciable. Jagacinski, Repperger, Moran, Ward, and Glass (1980) questioned the hypothesis of constant-duration submovements, having found considerable variation in the duration of the initial submovement. Also, the model is completely deterministic and cannot explain why subjects sometime miss a target and commit an error (Meyer, Smith, Kornblum, Abrams, & Wright, 1990).
So, despite being robust and highly replicable, Fitts' law remains an analogy waiting for a theory. Providing a reasonable account of the law through a theory of human movement – rather than a theory of information – remains a research goal.
3. DETAILED ANALYSIS
Fitts' original experiments provide the basis for a detailed examination of the model's utility, shortcoming and universality. Following an analysis of Fitts' work, problems and weaknesses in the model are examined in view of a substantial body of follow-up research.
3.1. The Original Experiments
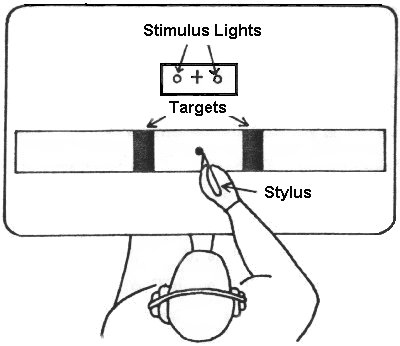
The original investigation (Fitts, 1954) involved four experiments: two reciprocal tapping tasks (1-oz stylus and 1-lb stylus), a disc transfer task, and a pin transfer task. In the tapping experiments, subjects moved a stylus back and forth between two plates as quickly as possible and tapped the plates at their centers (see Figure 1). This experimental arrangement is commonly called the "Fitts' paradigm."
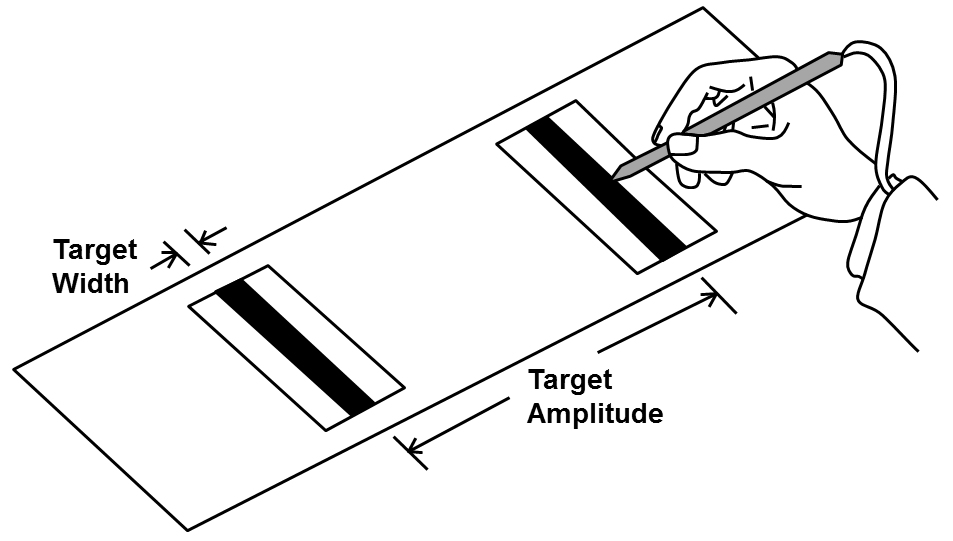
Figure 1. Fitts' reciprocal tapping paradigm (after Fitts, 1954).
Figure 2. Data from Fitts' (1954) reciprocal task experiment with 1-oz stylus. An extra column shows the effective target width (We) after adjusting W for the percentage errors.
W
(in.)We(DE) a
(in.)A
(in.)ID
(bits)MT
(ms)Errors
(%)IP b
(bits/s)0.25 0.243 2 4 392 3.35 10.20 0.25 0.244 4 5 484 3.41 10.33 0.25 0.235 8 6 580 2.78 10.34 0.25 0.247 16 7 731 3.65 9.58 0.50 0.444 2 3 281 1.99 10.68 0.50 0.468 4 4 372 2.72 10.75 0.50 0.446 8 5 469 2.05 10.66 0.50 0.468 16 6 595 2.73 10.08 1.00 0.725 2 2 212 0.44 9.43 1.00 0.812 4 3 260 1.09 11.54 1.00 0.914 8 4 357 2.38 11.20 1.00 0.832 16 5 481 1.30 10.40 2.00 1.020 2 1 180 0.00 5.56 2.00 1.233 4 2 203 0.08 9.85 2.00 1.576 8 3 279 0.87 10.75 2.00 1.519 16 4 388 0.65 10.31 Mean 392 1.84 10.10 SD 157 1.22 1.33 a data added (see text)
b IP = ID / MT
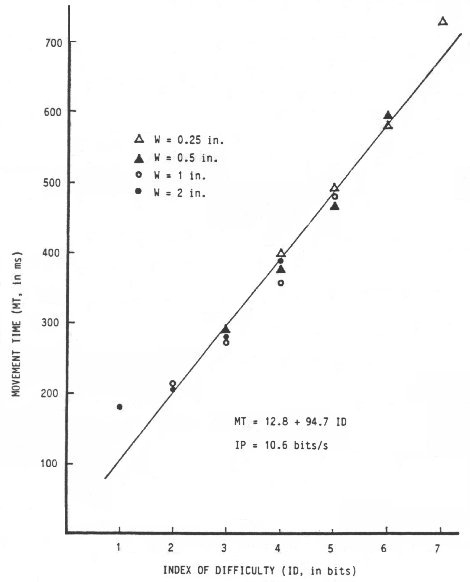
Target width and target amplitude varied across four levels, resulting in IDs of 1 to 7 bits. Mean MTs ranged from 180 ms to 731 ms, with each mean derived from more than 600 observations. In assuming an intercept of zero (see Equation 4), Fitts calculated IP directly by dividing ID by MT for each experimental condition. A quick glance at Figure 2 shows the strong evidence for the thesis that the rate of information processing is constant across a range of task difficulties. The mean value of IP = 10.10 bits/s (SD = 1.33 bits/s) is purportedly the information-processing rate of the human motor system.
Although Fitts did not perform correlation or regression analyses on his 1954 data, others have. Correlating MT with ID yields r = .9831 (p < .001). It is noteworthy of the model in general that correlations above .9000 consistently emerge. Regressing MT on ID results in the following prediction equation for MT (in ms):
| MT = 12.8 + 94.7 ID. | (7) |
Calculating IP from the reciprocal of the slope yields an information-processing rate of 10.6 bits/s. This rate is slightly higher than that obtained through direct calculation because it is derived from a least-squares regression equation with a positive intercept. When IP is calculated directly, the linear relationship takes on an intercept of zero. A positive intercept reduces the slope of the line, thus increasing IP. Although some researchers cite values of IP calculated directly (notably Fitts, 1954), most use the statistical technique of linear regression and provide a value for IP (the reciprocal of the slope) and an intercept. See Sugden (1980) or Salmoni and McIlwain (1979) for further discussions on the merits of each technique of calculating IP.
3.2. Problems Emerge
Despite the high correlation between ID and the observed mean MT, problems have been noted. Scatter plots often reveal an upward curvature of MT away from the regression line for low values of ID (see Figure 3). This systematic departure of observations from predictions was first pointed out by Crossman in 1957 (Welford, 1960) and has been observed in other studies since (Buck, 1986; Crossman & Goodeve, 1963/1983; Drury, 1975; Klapp, 1975; Langolf et al., 1976; Meyer et al., 1988; Meyer et al., 1990; Wallace, Newell, & Wade, 1978).
Figure 3. Scatter plot of movement time versus index of difficulty. Sixteen combinations of A and W were employed with IDs ranging from 1 to 7 bits (after Fitts, 1954).
The failure of the model when ID is small is also evident in Figure 2. The IP rating of 5.56 bits/s for ID = 1 bit is 3.4 SDs from the mean value of 10.10 bits/s.
Another problem stems from the relative contributions of A and W in the prediction equation. Accordingly, the effect should be equal but inverse. A doubling of the target amplitude adds 1 bit to the index of difficulty and increases the predicted movement time. The same effect is predicted from Equation 6 if target width is halved. In an analysis of Fitts' (1954) four experiments, M. R. Sheridan (1979) showed that reductions in target width cause a disproportionate increase in movement time when compared to similar increases in target amplitude. Others have also independently noted this disparity (Keele, 1973, p. 112; Meyer et al., 1988; Welford, Norris, & Shock, 1969). It is also evident in the scatter plots in some reports, although not noted by the investigators (Buck, 1986; Jagacinski & Monk, 1985; Jagacinski, Repperger, Ward, & Moran, 1980).
An error-rate analysis may also reveal the inequitable contributions of A and W. Wade, Newell, and Wallace (1978) found a significant main effect between error rate and target width, F(2, 40) = 16.60, p < .01, with errors increasing as target width decreased but no main effect between error rate and target amplitude. A similar observation was made by Card et al. (1978).
By no means is there unanimity on the point just raised. When ID is less than around 3 bits, movements are brief and feedback mechanisms yield to impulse-driven ballistic control. The disparity may be just the opposite under these conditions. Gao and Hoffmann (1988) found that when ID is small, MT is strongly dependent on movement amplitudes, with no significant effects from target width.
Fitts' analogy has proven itself in many settings, but, like all models, limitations and inaccuracies emerge under extremes of conditions or when the grain of analysis is fine.
3.3. Variations on Fitts' Law
In an effort to improve the data-to-model fit, numerous researchers have proposed variations on Fitts' relationship or have introduced new models derived from different principles. Welford's (1960; 1968, p. 147) variation is the most widely adopted, and commonly appears in two forms:
| MT = a + b log2(A / W + 0.5) | (8) |
or
| MT = a + b log2((A + 0.5W) / W) | (9) |
The latter form is strikingly similar to Shannon's original theorem (cf. Equation 1). Many researchers, including Fitts, have reported higher correlations between MT and ID using Welford's formulation (Beggs, Graham, Monk, Shaw, & Howarth, 1972; Drury, 1975; Fitts & Peterson, 1964; B. A. Kerr & Langolf, 1977; Knight & Dagnall, 1967; Kvålseth, 1980). Although Fitts' original formulation (Equation 6) is still the most frequently used, many researchers (most notably in the present context, Card et al., 1978) prefer Equation 8.
Recently it was shown that Fitts deduced his relationship citing an approximation of Shannon's theorem originally introduced with the caution that it is useful only if the signal-to-noise ratio is large (Fitts, 1954, p. 388; Goldman, 1953, p. 157; MacKenzie, 1989). The signal-to-noise ratio in Shannon's theorem corresponds to the ratio of target amplitude to target width in Fitts' analogy. As evident in Figure 2, Fitts' experiments extended the A:W ratio as low as 1:1! The variation of Fitts' law suggested by direct analogy with Shannon's information theorem is:
| MT = a + b log2(A / W + 1) | (10) |
or the alternate form
| MT = a + b log2((A + W) / W) | (11) |
The difference between Equation 10 and Equation 6 (Fitts' law) is illustrated by comparing changes in the logarithm term (ID) as A approaches zero with W held constant (see Figure 4). It is noteworthy of Equation 10 that the logarithm cannot be negative.3
Figure 4. Comparison of Fitts' index of difficulty and an ID based on Shannon's Theorem 17. W is held constant at 1 unit as A approaches zero.
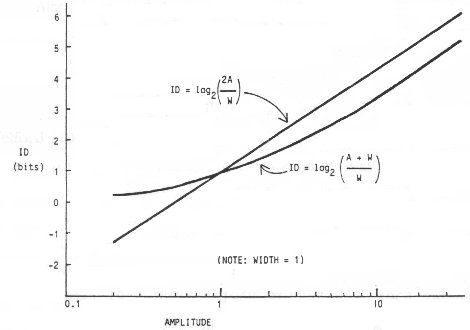
Obviously, a negative rating for task difficulty presents a serious theoretical problem. It is a minor consolation that this can only occur with Fitts' expression when the targets overlap, that is, when A < W / 2. Although such conditions may seem unreasonable, the possibility has been investigated before (Schmidt, 1988, p. 271; Welford, 1968, p. 145) and can occur when output measures are adjusted to reflect the variance in subjects' responses (using a technique described shortly). Regardless, researchers have actually reported on experimental conditions with a negative ID (e.g., Card et al., 1978; Crossman & Goodeve, 1963/1983; Gillan, Holden, Adam, Rudisill, & Magee, 1990; Ware & Mikaelian, 1987).
The practical consequences of using Equation 10 in lieu of Fitts' or Welford's equation are probably slight and are likely to surface only in experimental settings with IDs extending under approximately 3 bits, as suggested from Figure 4. Nevertheless, the theoretical implications of Equation 10 are considerable. First, the idea that similar changes in target amplitude and target width should effect a similar but inverse change in movement time as suggested in Equation 6 does not follow in Equation 10.
Also, the sound theoretical premise for Equation 10 casts doubt on the rationale for a popular and mathematically correct transformation of Fitts' law, which separates A and W:
| MT = a + b1 log2A − b2 log2W | (12) |
Welford (1968, p. 156) suggested that b1log2A may correspond to an initial open-loop impulse toward a target and that b2log2W may correspond to a feedback-guided final adjustment as a move terminates. Numerous researchers have used or analyzed Equation 12 with good results (Bainbridge & Sanders, 1972; Gan & Hoffmann, 1988; Jagacinski, Repperger, Moran, Ward, & Glass, 1980; Jagacinski, Repperger, Ward, & Moran, 1980; Kay, 1960; R. Kerr, 1978; M. R. Sheridan, 1979; Welford et al., 1969; Zelaznik, Mone, McCabe, & Thaman, 1988). In multiple correlation analyses, Equation 12 always yields a higher r than the single factor r obtained using Equation 6 (because of the extra degree of freedom); however, the model ceases to have an information-theoretic premise because similar recasting is not possible using Equation 10, which directly mimics Shannon's original theorem. For example, from Equation 12, What is ID? What is IP?
Finally, derivations of Fitts' law, such as that provided by Crossman and Goodeve (1963/1983), cannot accommodate Equation 10 without introducing further assumptions. Thus, the Shannon formulation addresses several theoretical issues and offers slightly better prediction power than Fitts' or Welford's formulation.
3.4. Effective Target Width
Of greater practical importance is a technique to adjust output measures to bring the model in line with the underlying principles. The technique calls for normalizing target width to reflect what a subject actually did (output condition), rather than what was expected (input condition). Thus, at the model-building stage, W becomes a dependent variable.
The output or "effective" target width (We) is derived from the distribution of "hits" (see Welford, 1968, pp. 147-148). This adjustment lies at the very heart of the information-theoretic metaphor – that movement amplitudes are analogous to "signals" and that endpoint variability (viz., target width) is analogous to "noise." In fact, the information theorem underlying Fitts' law assumes that the signal is "perturbed by white thermal noise" (Shannon & Weaver, 1949, p. 100). The analogous requirement in motor tasks is a Gaussian or normal distribution of hits – a property observed by numerous researchers (e.g., Crossman & Goodeve, 1963/1983; Fitts, 1954; Fitts & Radford, 1966; Welford, 1968, p. 154; Welford et al., 1969; Woodworth, 1899).
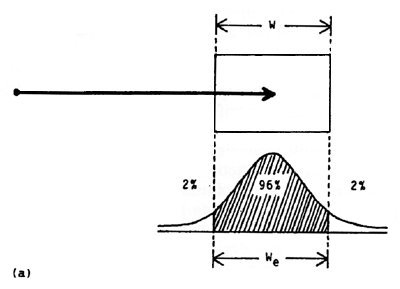
The experimental implication of normalizing output measures is illustrated as follows. The entropy, or information, in a normal distribution is, log2((2πe)½ σ) = log2(4.133 σ), where σ is the standard deviation in the unit of measurement. Splitting the constant 4.133 into a pair of z scores for the unit‑normal curve (i.e., σ = 1), one finds that 96% of the total area is bounded by −2.066 < z < +2.066. In other words, a condition that target width is analogous to noise is that the distribution is normal with 96% of the hits falling within the target and 4% of the hits missing the target (see Figure 5a). When an error rate other than 4% is observed, target width can be adjusted to form the effective target width in keeping with the underlying theory. This is a crucial point that we dwell on in more detail later.
Figure 5. Method of adjusting target width based on the distribution of endpoint coordinates. (a) When 4% errors occur, the effective target width, We = W. (b) When less than 4% errors occurs We < W.
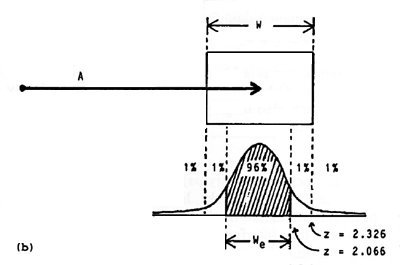
There are two methods for determining the effective target width. If the standard deviation of the endpoint coordinates is known, just multiply SD by 4.133 to get We. When percentage errors are known, the method is trickier and requires a table of z scores for areas under the unit-normal curve. The method is: If n percentage errors are observed for a particular A-W condition, determine z such that ±z contains 100 − n percent of the area under the unit-normal curve. Multiply W by 2.066 / z to get We. For example, if 2% errors were recorded on a block of trials when tapping or selecting a 5-cm wide target, then We = 2.066 / z × W = 2.066 / 2.326 × 5 = 4.45 cm (see Figure 5b).
Experiments following this approach may find the variation in IP reduced because, typically, subjects that take longer are more accurate and demonstrate less endpoint variability. Reduced variability decreases the effective target width and therefore increases the effective index of difficulty (see Equation 3). On the whole, an increase in MT is compensated for by an increase in the effective ID, and this tends to lessen the variability in IP (see Equation 2).
This technique is not new, yet it has been largely ignored in the published body of Fitts' law research that could have benefited from it.4 There are several possible reasons for the lack of use of this technique. First, the method is tricky and its derivation from information-theoretic principles is complicated (e.g., see Reza, 1961, pp. 278-282). Second, the endpoint coordinate must be recorded for each trial in order to calculate We from the standard deviation. This is feasible using a computer for data acquisition and statistical software for analysis, but manual measurement and data entry are extremely awkward.5
Inaccuracy may enter when adjustments use the percentage errors because the extreme tails of the unit-normal distribution are involved. It is necessary to use z scores with at least three decimal places of accuracy for the factoring ratio (which is multiplied by W to yield We). Manual look-up methods are prone to precision errors. Furthermore, some of the easier experimental conditions may have error rates too low to reveal the true distribution of hits. The technique cannot accommodate "perfect performance"! For example, as shown in Figure 2, 0.00% errors occurred when A = W = 2 in., which seems reasonable because the target edges were touching. This observation suggests a large adjustment because the distribution is very narrow (in comparison to the target width over which the hits should have been distributed – with 4% errors!). A pragmatic approach in this case is to assume an error rate of 0.0049% (which rounds to 0.00%) at worst and proceed to make the adjustment.
Introducing a post hoc adjustment on target width before the regression analysis (or maintaining a consistent error rate of around 4%) is important to maintain the information-theoretic analogy. There is a tacit assumption in Fitts' law that subjects, although instructed to move "as quickly and accurately as possible," balance the demands of tasks to meet the spatial constraint that 96% of the hits fall within the target. When this condition is not met, an adjustment to target width should be introduced. Furthermore, if subjects slow down and place undue emphasis on accuracy, the task changes; the constraints become temporal, and the prediction power of the model falls off (Meyer et al., 1988). In summary, Fitts' law is a model for rapid, aimed movements, and the presence of a nominal yet consistent error rate in subjects' behavior is assumed and arguably vital.
3.5. Reanalysis of Fitts' Data
The technique for adjusting target width based on percentage errors was applied to the data in Fitts' tapping experiments in determining the effective target width. The adjusted values, We, are shown in Figure 2 for the 1-oz tapping experiment. The correlation between ID and MT for the first experiment using Fitts' model without the adjustments is high (r = .9831, p < .001), as previously noted, but higher when ID is recalculated using We, (r = .9904, p < .001), and even higher using We and the Shannon formulation (r = .9937, p < .001).6 As evident in Figure 6, the trend is similar for the other experiments.7
Figure 6. Reanalysis of data from Fitts' (1954) experiments. For each experimental condition, the trend is for the correlation to increase and the standard error to decrease when target width is adjusted for percentage errors and ID is calculated using the Shannon formulation. Target width could not be adjusted for the disc and pin transfer experiments because errors could not occur. Analysis was conducted using SPSSx Release 3.1 (1990).
Model Equation Target Width r a Regression Coefficients Intercept,
a (ms)SE b Slope, b
(ms/bit)SE b IP
(bits/s) c*** 1 oz Stylus *** Fitts 6 Unadjusted (W) .9831 12.8 20.3 94.7 4.7 10.6 Fitts 6 Adjusted (We) .9904 -73.2 18.0 108.9 4.0 9.2 Shannon 9 Adjusted (We) .9937 -31.4 13.4 122.0 3.6 8.2 *** 1 lb Stylus*** Fitts 6 Unadjusted (W) .9796 -6.2 24.7 104.8 5.7 9.5 Fitts 6 Adjusted (We) .9882 -118.0 22.8 124.0 5.1 8.1 Shannon 9 Adjusted (We) .9925 -69.8 16.6 138.8 4.5 7.2 *** Disc Transfer *** Fitts 6 Unadjusted (W) .9186 150.0 74.6 90.4 10.4 11.1 Shannon 9 Unadjusted (W) .9195 223.0 66.0 92.6 10.6 10.8 *** Pin Transfer *** Fitts 6 Unadjusted (W) .9432 22.3 48.2 86.1 7.1 11.6 Shannon 9 Unadjusted (W) .9452 84.4 42.2 89.4 7.3 11.2 a p < .001
b standard error
c IP = 1 / b
A scatter plot of MT versus ID, where ID = log2(A / We + 1) from Equation 10, shows a coalescing of points about the regression line (cf. Figures 3 and 7). Note that the range of IDs is narrower using adjusted measures. This is due to the 1-bit decrease when ID is greater than about 2 bits (see Figure 4) and the general increase in ID for "easy" tasks because of the narrow distribution of hits.
Although the regression equation obtained using Fitts' expression is noteworthy for providing the intercept closest to the origin for all four experiments (see Figure 6), the standard error is the highest for all experiments. In general, a large intercept is due to the presence of factors that are unaccounted for, such as a "button push" or other antagonistic muscle activity at the beginning or ending of a task (Keele, 1968; Meyer, Smith, & Wright, 1982). In follow-up applications, a negative prediction is unlikely because task difficulties well under 1 bit would be required. The general effect of the adjustments, as shown in Figure 7, is to increase low values of ID, thus further decreasing the likelihood of a negative prediction for MT.
Figure 7. Scatter plot of MT versus ID. The data are from Fitts (1954); however, ID has been recalculated using We and a logarithmic expression based on Shannon's information theorem (see Equation 10).
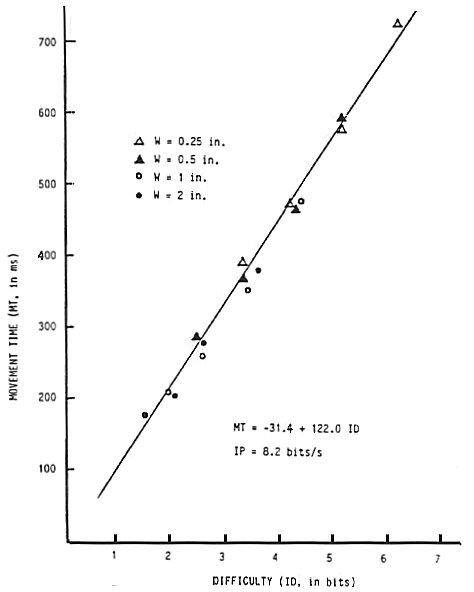
Although it is interesting that IP decreases for each of the changes introduced, the magnitude of IP is less relevant to the present discussion than the overall accuracy of the model as determined by the statistical measures of correlation and standard error. The rate of IP = 8.2 bits/s for the first experiment is a full 2.4 bits/s lower than that found using Fitts' model; however, low rates often emerge, sometimes under 5 bits/s (e.g., Epps, 1986; Jagacinski, Repperger, Ward, & Moran, 1980; Kantowitz & Elvers, 1988; Kvålseth, 1977).
To conclude, the trend of increasing correlation and decreasing standard error progressing down the columns in Figure 6 within each experiment suggests that the adjustments introduced improve the model's accuracy.
3.6. Effective Target Amplitude
It follows from the preceding discussion that an adjustment may also be in order to reflect the actual distance moved, resulting in an "effective" target amplitude, Ae. The possibility seems strongest that Ae < A, particularly when A:W is small, but many factors are at work such as the type of input device and the control-display (CD) gain setting. The data in Fitts' report do not permit an investigation of this point; however, it was observed that, of the two possibilities, undershoot errors were more common (Fitts, 1954, p. 385). This trend has also been noted in other studies (Glencross & Barrett, 1983; P. A. Hancock & Newell, 1985, p. 159; Langolf et al., 1976; Wright & Meyer, 1983).The implications of this are subtle and may be of little practical consequence. If a prediction equation is derived using adjusted amplitude measures (reflecting what subjects actually did) and then is applied in subsequent designs, there may be a systematic departure of performance from predictions. More errors may occur than predicted because output responses may not be a normally distributed reflection of input stimulus but may be skewed inward.
3.7. Targets and Angles
There are two aspects of dimensionality in Fitts' law tasks: the shape of targets and the direction of movement. When movements are limited to one dimension (e.g., back and forth) and both target height (H) and target width are varied, there is evidence that target height has only a slight main effect on movement time (Kvålseth, 1977; Salmoni, 1983; Welford, 1968, p. 149). Schmidt (1988, p. 278) noted that horizontal motion toward a target results in an elliptical pattern of hits, with the long axis on the line of approach.8
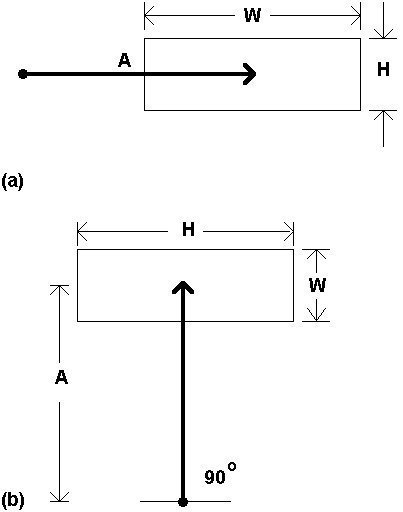
When the shape of the target and the direction of movement vary, the situation is confounded. For rectangular targets in two-dimensional (2D) positioning tasks, as the approach angle changes from 0° to 90° (relative to the horizontal axis), the roles of target width and target height reverse (see Figure 8).
Figure 8. The changing roles of target width and target height as the approach angle changes.
Varying the direction of approach raises the question, What is target width? At the model-building stage, the issue is avoided somewhat by using We, as described earlier. Most likely, We should be derived from the endpoint variability in two dimensions, calculated in Cartesian coordinates from (x2 + y2)½. Although this idea awaits empirical testing, it can extend to three-dimensional (3D) movements as well.
When a derived model is used for prediction in 2D movement tasks, the problem of target width must be addressed directly: What value for W should be used in calculating ID? There are several possibilities. Considering first only rectangular targets, it is probably wrong to consistently use the horizontal extent of a target for W, because a wide, short target approached from above or below at close range will yield a negative ID (if Fitts' or Welford's formulation is used). This situation is common in text-selection tasks where wide, short targets (viz., words) are the norm. The text-selection experiments by Card et al. (1978) and Gillan et al. (1990) both cited experimental conditions yielding negative IDs.
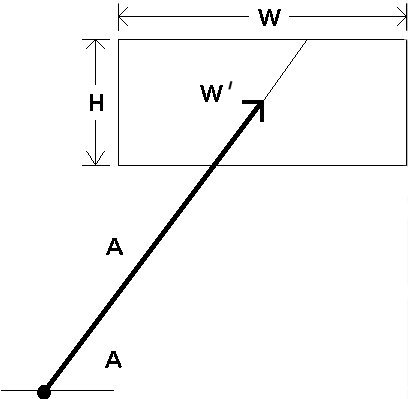
Research on potential substitutes for target width is scarce. Possibilities include H, W + H, or W × H (Gillan et al., 1990). Perhaps the smaller of W or H is appropriate because the lesser of the two extents seems more indicative of the precision demands of the task. Another possibility is the span of the target along an approach vector through the center. This distance, W', is shown in Figure 9. Although untested, the latter idea is appealing in that circles or other shapes of targets can be accommodated. It also has the advantage of maintaining the one dimensionality of the model.9
Figure 9. The relationship between target width and approach angle. A possible substitute for target width when the approach angle varies is the distance through the target along the approach vector (W').
Projecting 3D objects onto a 2D CRT display is common on today's bit-mapped graphic systems. It follows that input strategies are needed to facilitate 3D interaction. A first-order solution is to map a 2D device into the third dimension (e.g., Chen, Mountford, & Sellen, 1988; Evans, Tanner, & Wein, 1981). Recent techniques include direct manipulation with an input glove (Foley, 1987; Tello, 1988; Zimmerman, Lanier, Blanchard, Bryson, & Harvill, 1987) or maneuvering a mouse in three dimensions (Ware & Baxter, 1989). Although no studies to date have employed Fitts' law in 3D computer interaction tasks, a need may arise as this mode of interaction matures.
4. COMPETING MODELS
The ultimate reason for building models (e.g., human performance models) is that they facilitate the way we think about a problem. Models are neither right nor wrong; only through their utility do they muster support in the scientific community. Although unquestionably robust, the information-processing analogy in Fitts' law does not sit well for all.
Several competing and overlapping models, including Fitts' law, are at the forefront of current research pushing toward a general theory of motor behavior. The following paragraphs extend the belief that a general model of human movement should accommodate the extremes of temporal and spatial constraints in movement tasks. There are classes of movements (e.g., drawing) that at present lack a paradigm for performance modeling. A new model, perhaps incorporating Fitts' law, could fulfill this need.
4.1. The Linear Speed-Accuracy Tradeoff
Of considerable interest recently is the linear speed-accuracy tradeoff discovered by Schmidt and colleagues (Schmidt, Zelaznik, & Frank, 1978; Schmidt, Zelaznik, Hawkins, Frank, & Quinn, 1979). The tradeoff, formally the impulse variability model, forecasts that the standard deviation in endpoint coordinates (viz., accuracy) is a linear function of velocity, calculated as distance over time:
| We = a + b A / MT | (13) |
It is interesting that Equation 13 and Fitts' law contain the same three parameters (with the difference that We is the standard deviation of endpoint coordinates in Equation 13 and is 4.133 × SD in Fitts' adjusted model). Although Equation 13 can be rearranged with MT as the predicted variable, it is still fundamentally different from Fitts' law because the relationship is linear rather than logarithmic and because the information analogy is absent.
Another difference is the nature of the tasks suited to each. The linear speed-accuracy tradeoff is demonstrably superior to Fitts' law for "temporally constrained" tasks. The distinction is summarized as follows. Under spatial constraints, a move proceeds as quickly as possible and terminates within a defined region of space (target width). This applies to Fitts' tapping task. Under temporal constraints, a move proceeds as accurately as possible and terminates at a specified time. Targets are points or lines in temporally constrained tasks. Subjects strike the target on time and avoid being too fast or too slow.
In relation to computer input, temporally constrained tasks are of a different genre. They include, for example, capturing moving targets and real-time interaction (perhaps in a music performance system). The distinction between temporal and spatial constraints is by no means dichotomous. Drawing, tracing, and inking have features of both: A user moves a tracking symbol (cursor, cross, etc.) at an optimal velocity while attending to the accuracy demands of the task. How should such tasks be modeled? Is the focus on minimizing time (the dependent variable in Fitts' law) or on minimizing error (the dependent variable in Equation 13)?
The task of drawing is a simple example. The Keystroke-Level Model (Card et al., 1980) provides a rough estimate of the time to draw a series of line segments (tD in ms) from the total length of the segments (lD in cm) and the number of segments (nD). The equation:
| tD = 900 nD + 160 lD | (14) |
was offered as a restricted operator – dependent on the system, user, and device – and was included only to extend the generality of the Keystroke-Level Model to this class of movement tasks. Notably, accuracy is not represented in the equation. One may anticipate that a class of models for tasks with temporal constraints, such as drawing, may embody the linear speed-accuracy tradeoff given in Equation 13.
4.2. Power Functions
Several power functions have been proposed including the following general form (Kvålseth, 1980):
| MT = a Ab Wc | (15) |
A reanalysis of Fitts' (1954) data reveals that Equation 15 provides a higher multiple correlation (R) than the single-factor correlation (r) using Fitts' relationship. A test of positioning times using six cursor control devices also showed higher correlations using Equation 15 (Epps, 1986). Note, however, that the improved fit is largely due to the extra degree of freedom. Equation 15 has three empirically determined constants; Fitts' law has two. And as noted earlier, a strength of Fitts' model is the physical interpretation afforded by the terms in the equation. A similar casting is difficult for a, b, and c in Equation 15.
Several permutations of Equation 15 are possible. If b = −c, then
| MT = a (A / W)b | (16) |
Taking the base-2 logarithm of each side yields
| log2 MT = log2a + b 1og2(A / W) = a' + b log2(A / W), | (17) |
which is similar to Fitts' law except the log of movement time is the predicted variable (T. B. Sheridan & Ferrell, 1963).
Another permutation, introduced by Meyer et al. (1988), sets the exponent in Equation 16 to ½ and positions slope and intercept coefficients in the usual place for linear regression:
| MT = a + b (A / W)½. | (18) |
Equation 18, formally the stochastic optimised-submovement model, is supported by a comprehensive theory on the random variability of neuromotor force pulses. In a reanalysis of Fitts' (1954) data, higher correlations were found using Equation 18 than using Fitts' law (Meyer et al., 1988); however, they are not as high as those in Figure 6 using the Shannon formulation.
The model provides a unified conceptual framework encompassing both the linear speed-accuracy model and Fitts' log model. Meyer and colleagues found that movements following the Fitts' paradigm are composed of submovements with durations, distances, and endpoint distributions conforming to the linear speed-accuracy model. This is an important link. A goal of the stochastic optimized-submovement model is to reconcile the range of spatial and temporal demands in human movement in a general theory of motor behavior (Meyer et al., 1990). The promise for performance modeling of user input to computers is a single model capable of expressing a wider range of movement tasks.
5. APPLICATIONS OF FITTS' LAW
A comprehensive review of research applying Fitts' law in studies on human movement would be a monumental task. A quick tally from the Social Sciences Citation Index (SSCI) between 1970 and 1988 reveals 248 citations of Fitts' 1954 article. Even this is not fully indicative of the widespread use of Fitts' model because a large body of research in fields such as medicine, sports, and human factors is published in journals, books, and conference proceedings not surveyed in the SSCI. The following review is cursory and quickly proceeds to the relevant research in human factors and HCI.
5.1. The Generality of Fitts' Law
Building on Fitts' evidence that the rate of human information processing is constant across a range of task difficulties, other researchers adopted the model to determine IP in settings far removed from Fitts' original theme. It is evident in reviewing the literature that the new factors often confound the problem of measurement. Numerous studies report vastly different measures for very similar processes.In a study similar to Fitts' initial report, Fitts and Peterson (1964) measured IP for a "discrete" task in which subjects responded to a stimulus light and tapped a target on the left or right. This experimental arrangement has been widely adopted in subsequent research (see Figure 10).
Figure 10. Discrete paradigm for Fitts' law experiments (after Fitts & Peterson,1964).
In comparison to IP = 10.6 bitsls for "serial" or reciprocal tapping tasks (Fitts, 1954), a rate of 13.5 bits/s was found for discrete tasks (after factoring out reaction time; Fitts & Peterson, 1964). It is interesting that a difference of 2.9 bits/s surfaced for two tasks that are essentially the same except for the serial versus discrete nature of the movements. Others have also found a higher IP for discrete tasks over serial tasks (Megaw, 1975; Sugden, 1980). Keele (1968) suggested that discrete tasks may yield a higher IP because they exclude time on target, unlike serial tasks.
Besides the large number of studies cited in the previous section that tested the validity of the model, many simply adopted the model as a tool to investigate other issues. The role of visual feedback in controlling the accuracy of movement has been the topic of many experiments using Fitts' law (e.g., Carlton, 1981; Crossman, 1960; Glencross & Barrett, 1983; Keele & Posner, 1968; Kvålseth, 1977; Meyer et al., 1988; Wallace & Newell, 1983). The usual method is to cut off visual feedback, a period of time after a movement begins, and compare the period of feedback deprivation with changes in accuracy, MT, or IP. It has been found that movements under approximately 200 ms are ballistic and not controlled by visual feedback mechanisms whereas those over 200 ms are.
Fitts' law has performed well for a variety of limb and muscle groups. High correlations appear in studies of wrist flexion and rotation (Crossman & Goodeve, 1963/1983; Meyer et al., 1988; Wright & Meyer, 1983), finger manipulation (Langolf et al., 1976), foot tapping (Drury, 1975), arm extension (B. A. Kerr & Langolf, 1977), head movement (Andres & Hartung, 1989; Jagacinski & Monk, 1985; Radwin, Vanderheiden, & Lin, 1990), and microscopic movements (W. M. Hancock, Langolf, & Clark, 1973; Langolf & W. M. Hancock, 1975). Underwater experiments have provided a platform for further verification of the model (R. Kerr, 1973; R. Kerr, 1978), as have experiments with mentally retarded patients (Wade et al., 1978), patients with Parkinson's disease (Flowers, 1976) or with cerebral palsy (Bravo, LeGare, Cook, & Hussey, 1990), the young (Jones, 1989; B. Kerr, 1975; Salmoni, 1983; Salmoni & Mcilwain, 1979; Sugden, 1980; Wallace et al., 1978), and the aged (Welford et al., 1969). An across-species study verified the model in the movements of monkeys (Brooks, 1979). It has been suggested that the model would hold for the mouth or any other organ for which the necessary degrees of freedom exist and for which a suitable motor task could be devised (Glencross & Barrett, 1989).
Tabulating the results from these reports reveals a tremendous range of performance indices, from less than 1 bit/s (Hartzell, Dunbar, Beveridge, & Cortilla, 1983; Kvålseth, 1977) to more than 60 bits/s (Kvålseth, 1981). Most studies report IP in the range of 3 to 12 bits/s.
5.2. Review of Six Studies
Despite the large body of research evaluating the performance of computer input devices for a variety of user tasks, the discipline of HCI has not, as a rule, been a proving ground for Fitts' law performance models. Most related HCI research uses "task completion time" as the unit of study, with errors or other measures reported in separate analyses. Two-factor repeated measures experiments with several levels each for task and device are the norm (e.g., Buxton & Myers, 1986; English, Engelbart, & Berman, 1967; Ewing, Mehrabanzad, Sheck, Ostroff, & Shneiderman, 1986; Goodwin, 1975; Gould, Lewis, & Barnes, 1985; Haller, Mutschler, & Voss, 1984; Karat, McDonald, & Anderson, 1984; Mehr & Mehr, 1972; Sperling & Tullis, 1988). See Greenstein and Arnaut (1988), Milner (1988), or Thomas and Milan (1987) for reviews of this body of research.Six Fitts' law studies have been selected as relevant to the present discussion. These are surveyed in reference-list order, focusing initially on the methodology and empirical results. An assessment of the findings within and across studies is deferred to the end.
Card, English, and Burr (1978)
This highly cited work stands apart from other investigations by nature of its goal to transcend the simplistic ranking of devices and to develop models useful for subsequent device evaluations. The idea is that, once a model is derived, it can participate in subsequent designs by predicting performance in different scenarios before design is begun.
Selection time, error rates, and learning time were measured in a routine text-selection task using four devices: a mouse, an isometric joystick, step keys, and text keys. The step keys moved the cursor up, down, left, or right in the usual way, whereas the text keys advanced the cursor on character, word, or paragraph boundaries. The joystick controlled the velocity and direction of the cursor from the magnitude and direction of the applied force, with negligible displacement of the stick.
For each trial, subjects pressed the space bar, homed their hand on the cursor-control device, advanced the cursor to a word highlighted in a block of text, then selected the word by pressing a button or key. Experimental factors were device (four levels), distance to target (A = 1, 2, 4, 8, and 16 cm), target size (W = 1, 2, 4, and 10 characters; one character = 0.246 cm), approach angle (0°-22.5°, 22.5°-67.5°, and 67.5°-90°), and trial block. IDs ranged from −0.14 bits (A = 1 cm, W = 10 characters) to 6.0 bits (A = 10 cm, W = 1 character) – The negative index is discussed later. Target height was held constant at 0.456 cm, the height of each character.
Using Welford's variation of Fitts' law, prediction equations were derived for the two continuous devices. The least-squares regression equation predicting MT (in ms) for the mouse was
| MT = 1030 + 96 ID, | (19) |
with IP = 10.4 bits/s (r = .91, SE = 70 ms), and for the joystick,
| MT = 990 + 220 ID, | (20) |
with IP = 4.5 bits/s (r = .94, SE = 130 ms).
Mean MT was lowest for the mouse (1660 ms, SD = 480 ms) despite the fact that mean homing time was highest (360 ms, SD = 130 ms). The joystick was a close second (MT = 1830 ms, SD = 570 ms), followed by the text keys (MT = 2260 ms, SD = 1700 ms) and step keys (MT = 2510 ms, SD = 1640 ms).
Error rates ranged from 5% for the mouse to 13% for the step keys. Approach angle did not affect mean movement time for the mouse, but it increased movement time by 3% for the joystick when approaching a target along the diagonal axis.
Drury (1975)
Welford's variation of Fitts' law was evaluated as a performance model in a study of foot pedal design. Using their preferred foot, subjects tapped back and forth between two pedals for 15 cycles (30 taps). Six different amplitudes (A = 150, 225, 300, 375, 525, and 675 mm) were crossed with two pedal sizes (W = 25 and 50 mm). The mean width of subjects' shoes (108.8 mm) was added to target width as a reasonable adjustment because any portion of a shoe touching the target was recorded as a hit. As such, IDs ranged from 0.53 to 2.47 bits. With A = 150 mm and W = 50 + 108.8 = 158.8 mm, the task difficulty was calculated as log2(150.0 / 158.8 + 0.5) = 0.53 bits. This is an extremely relevant example of a task condition in which an index of difficulty less than 1 bit is perfectly reasonable. In effect, the targets were overlapping.The correlation between MT and ID was high (r = .970, p < .01), with regression line coefficients of 187 ms for the intercept and 85 ms/bit for the slope (IP = 11.8 bits/s). Overall error rates were not reported, but blocks with more than one miss were repeated; thus, by design, the error rate was less than 3.3%.
Epps (1986)
Six cursor-control devices were compared in a target-selection task with performance models derived using Fitts' law, a power model (Equation 15), and the following first-order model proposed by Jagacinski, Repperger, Ward, and Moran (1980):
| MT = a + b A + c (1 / W − 1) | (21) |
Device types included two touchpads (relative and displacement), a trackball, two joysticks (displacement and force; both with velocity control), and a mouse. For each trial, subjects moved a cross-hair tracker to a randomly positioned rectangular target and selected the target by pressing a button. Target distance varied across four levels (A = 2, 4, 8, and 16 cm) and target size across five levels (W = 0.13, 0.27, 0.54, 1.07, and 2.14 cm), yielding IDs from 0.90 to 6.94 bits.
The power model provided the highest (multiple) correlation with MT across all devices, with the first-order model providing higher correlations for some devices but not others. The correlations throughout were low, however, in comparison to those usually found. Using Fitts' equation, rs ranged from .70 for the relative touchpad to .93 for the trackball. Intercepts varied from −587 ms (force joystick) to 282 ms (trackball). The values for IP, ranging from 1.1 bits/s (displacement joystick) to 2.9 bits/s (trackball), are among the lowest to appear in Fitts' law experiments.
If an error was committed, subjects repositioned the cursor inside the target and pressed the select button again. Although the frequency of this behavior was not noted, presumably these trials were entered in the analysis using the total time for the operation.
Jagacinski and Monk (1985)
Fitts' law was applied to a target-acquisition task using a displacement joystick for position control and a head-mounted sight using two rotating infrared beams. Each trial began with the cursor in the middle of the display and the appearance of a circular target on the screen. Subjects moved the cursor to the target and selected it. On-target dwell time (344 ms), rather than a button push, was the criterion for target selection.Experimental factors were device (two levels), target distance (A = 2.45°, 4.28°, and 7.50° of visual angle), target size (W = 0.30°, 0.52°, and 0.92° for the joystick; W = 0.40°, 0.70°, and 1.22° for the helmet-mounted sight), and approach angle (0°, 45°, 90°, 135°, 180°, 225°, 270°, and 315°). Task difficulties ranged from 2.0 to 5.6 bits for the helmet-mounted sight. Correlations between MT and ID were very high (r = .99) for both devices, with regression coefficients for the intercept of −268 ms (helmet-mounted sight) and −303 ms (joystick). The regression line slope for both devices was 199 ms/bit (IP = 5 bits/s). Mean MTs were slightly longer along the diagonal axes for the joystick (7.2%) and for the helmet-mounted sight (9.1%). Because the selection criterion was dwell time inside the target, errors could not occur.
Kantowitz and Elvers (1988)
Fitts' law was evaluated as a performance model for two isometric joysticks – one for cursor position control, the other for cursor velocity control. Each trial began with the appearance of a square target in the center of the screen and an asterisk pre-cursor on either side that tracked the applied force of the joystick. When the pre-cursor changed to a cross-hair cursor, the subject moved it to the target and selected the target. A trial terminated if the cursor remained stationary (±3 pixels) for 333 ms, the horizontal direction of movement changed, or 4 s elapsed. Experimental factors were device (two levels), target distance (A = 170, 226, and 339 pixels), target size (W = 20 and 30 pixels), and CD gain (high and low). Four target distance/size combinations were chosen with IDs ranging from 3.5 to 5.5 bits.The velocity-control joystick regression line had a steeper slope, and therefore a lower IP, than the position-control joystick (IPs = 2.2 bits/s vs. 3.4 bits/s, respectively). There was no main effect for CD gain; for each device, the high and low gain regression lines were parallel. The intercepts, however, were large and negative. Under high-gain and low-gain conditions, respectively, intercepts were −328 and −447 ms under position control and −846 and −880 ms under velocity control. Correlations ranged from .62 to .85. The average error rate was very high (around 25% ), although figures were not provided across factors.
Ware and Mikaelian (1987)
Welford's variation of Fitts' law was applied to positioning data from a selection task using an eye tracker (Gulf and Western series 1900). A cross-hair cursor positioned on a CRT display was controlled by the reflection from subjects' cornea of an infrared source. Targets were selected by three methods: a hardware button, dwell time on target (400 ms), or an on-screen button. Seven rectangles (3.2 cm × 2.6 cm) were presented to the subjects in a vertical row. After fixating on the center rectangle for 0.5 s, one of the seven became highlighted, whereupon subjects immediately fixated on it and selected it.The application of Fitts' law in this study is weak. Target size was kept constant (2.6 cm), but distance was varied over four levels (0, 2.6, 5.2, and 7.8 cm). Although IDs ranged from −1.0 bit to 1.8 bits, no rationale was provided for the negative index at A = 0 cm, calculated as log2(0 / 2.6 + 0.5) = −1 bit.10 Correlations and regression coefficients were omitted in lieu of a scatter plot of MT versus ID with regression lines for each selection technique. For the purpose of this survey, equations were inferred from the plots. Intercepts ranged from 680 to 790 ms, and slopes ranged from 73 to 107 ms/bit. The highest IP was for the hardware button condition (13.7 bits/s), and the lowest was for dwell time (9.3 bits/s).
Error rates were high, ranging from 8. 5% (hardware button) to 22% (on-screen button). As the investigators noted, an eye tracker can provide fast cursor positioning and target selection, as long as accuracy demands are minimal.
5 .3. Across-Study Comparison of Performance Measures
We now proceed with the task of assessing the findings and comparing them across studies. Figure 11 tabulates for each device condition the regression coefficients, the MT-ID correlation, and the percentage errors. Both the slope and IP are provided for convenience, as are the values from Fitts' (1954) tapping experiment with a 1-oz stylus (see Figures 2 and 3). The entries are ordered by decreasing IP. This is not the same as ordering by increasing MT because the intercepts also contribute to MT. It is felt that IP is more indicative of the overall performance of a device and that normalizing the intercepts is reasonable for this comparison.
Figure 11. Survey of Fitts' law performance characteristics from six studies on user input devices.
Device 1st Author
& YearRegression Coefficients a r Errors
(%)Comments Intercept,
a (ms)Slope, b
(ms/bit)IP
(bits/s)Eye Trackerb Ware, 1987 680 73 13.7 - 8.5 Hardware button Foot Pedal Drury, 1975 187 85 11.8 .97 <3.3 Experiment 2 Hand c Fitts, 1954 12.8 94.7 10.6 .98 1.8 Tapping, 1oz Mouse Card, 1978 1030 96 10.4 .91 5 Eye Tracker b Ware, 1987 790 97 10.3 - 22 On-screen button Eye Tracker b Ware, 1987 680 107 9.3 - 12 Dwell time Helmet Sight Jagacinski, 1985 −268 199 5.0 .99 0 Joystick Jagacinski, 1987 −303 199 5.0 .99 0 Isometric, position control Joystick Card, 1978 990 220 4.5 .94 12 Isometric, velocity control Joystick Kantowitz, 1988 −328 297 3.4 .62 25 Isometric, position, high gain Joystick Kantowitz, 1988 −447 297 3.4 .76 25 Isometric, position, low gain Trackball Epps, 1986 282 347 2.9 .93 0 Mouse Epps, 1986 108 392 2.6 .83 0 Touchpad Epps, 1986 181 434 2.3 .74 0 Absolute positioning Joystick Kantowitz, 1988 −846 449 2.2 .84 25 Isometric, velocity, high gain Joystick Kantowitz, 1988 −880 449 2.2 .85 25 Isometric, velocity, low gain Touchpad Epps, 1988 −194 609 1.6 .70 0 Relative positioning Joystick Epps, 1986 −587 861 1.2 .81 0 Isometric, velocity control Joystick Epps, 1986 −560 919 1.1 .86 0 Displacement, velocity control a MT = a + b ID ; MT is movement time, ID is index of difficulty, IP is index of performance (IP = 1 / b)
b data inferred from plot
c provided for comparison purposes only
The presence of nine negative intercepts in Figure 11 is the first sign of trouble. A negative intercept implies that, as tasks get easier, a point is reached where the predicted movement time is negative. This, of course, is nonsense and indicates a flaw in the application of the model or the presence of uncontrolled variations in the data. Beyond this, the most notable observation is the overall lack of consensus in the measures. The spread of values is astonishing: Performance indices range from 1.1 to 13.7 bits/s, and intercepts range from −880 to 1030 ms. These values, however, probably do not truly reflect the innate differences in the devices. Although differences are expected across devices, similar measures should emerge in the figure where different entries are for the same device.
For example, the mouse was evaluated by Card et al. (1978) and Epps (1986). The former cite IP = 10.4 bits/s whereas the latter cites IP = 2.6 bits/s. These values differ by a factor of four! Also, the intercepts differ by 922 ms. So, what is the Fitts' law prediction equation for the mouse? The answer is up for debate.
Also, an isometric, velocity-control joystick was tested by Card et al. (1978), Epps (1986), and Kantowitz and Elvers (1988). Again, the outcome is disturbing. In the order just cited, the intercepts were reported as 990, −587, and 863 ms (average), and IP was reported as 4.5, 1.2, and 2.2 bits/s. It seems that the goal cited earlier – to develop models for evaluating devices and interaction techniques prior to implementation – remains elusive.
5.4. Sources of Variation
We can attempt to reconcile the differences by searching out the major sources of variation. Indeed, some of these are nascent traits of direct manipulation systems (rather than quirks in methodology) and, therefore, are particularly pertinent to the context of HCI. Identifying these provides a basis for evaluating and comparing studies. When disparities emerge, it may be possible to adjust measures or to predict comparative outcomes under hypothetical circumstances.
Device Differences
If the research goal is to establish a Fitts' law (or other) performance model for two or more input devices, then the only source of variation that is desirable is the between-device differences. This is what the investigations are attempting to measure. Accomplishing this assumes, somewhat unrealistically, that all other sources of variation are removed or are controlled for. Of course, very few studies are solely interested in device differences. Sources of variation become factors in many studies – equally as important to the research as model fitting across devices.We can cope with the disparity in Figure 11 by looking for across-study agreement on within-study ranking rather than comparing absolute measures. The mice and velocity-control isometric joysticks evaluated by Card et al. (1978) and Epps (1986) provide a simple example. The index of performance was higher for the mouse than for the joystick within each study. One could conclude, therefore, that the mouse is a better performer (using IP as the criterion) than the joystick, even though the absolute values are deceiving. (Note that the joystick in Card et al.'s study yielded a higher IP than the mouse in Epps' study.) Furthermore, the differences between devices expressed as a ratio was about the same: IP was higher for the mouse than for the joystick by a factor of 10.4 / 4.5 = 2.3 in Card et al.'s (1978) study and by a factor of 2.6 / 1.2 = 2.2 in Epps' (1986) study.
Just as the units disappear when the ratio of the performance indices is formed, so too may systematic effects from other sources of variation, including a myriad of unknown or uncontrolled factors present in an experiment. Indeed, experiment differences are evident in Figure 11: Epps' (1986) and Kantowitz and Elvers' (1988) studies showed low values for IP, whereas Card et al.'s (1978) and Drury's (1975) studies showed high values. Thus, relative differences within studies gain strength if across-study consensus can be found.
A larger sample of studies would no doubt reveal across-study consensus on other performance differences. The performance increment found in Kantowitz and Elvers' (1988) study for the position-control joystick over the velocity-control joystick, to cite one example, was noted in another study not in the survey Jagacinski, Repperger, Moran, Ward, & Glass, 1980).11
We should acknowledge as performance determinants the range of muscle and limb groups engaged by different manipulators. Because smaller limb groups (e.g., wrist vs. arm) have shown higher ratings for IP (Langolf et al., 1976), performance increments are reasonable when complex arm movements are avoided. With fewer degrees of freedom for the head or eyes than for the arm, the relatively high rates for the eye tracker and helmet-mounted sight in Figure 11 may be warranted. This does not, however, account for the high ranking of the foot pedals.
It is felt that Fitts' law performance differences can be attributed to other characteristics of devices, such as number of spatial dimensions sensed (one, two, or three) or property sensed (pressure, motion, or position); however, our sample is too small to form a basis for generalization. Besides, the studies surveyed may contain stronger sources of variation.
Task Differences
It is naive, perhaps, to suggest that there exists a generic task that can accommodate simple adjustments for other factors, such as device. One might argue that Fitts' tapping task is remote and inappropriate: It is not a particularly common example of user interaction with computers. Its one-dimensional simplicity, however, has advantages for model building, not the least of which is access to a substantial body of research. For example, there is evidence that a serial task yields an index of performance 2 to 3 bits/s slower than a similar discrete task (e.g., Fitts & Peterson, 1964). Discrete tasks may be more akin to direct manipulation systems, but experiments are easier to design and conduct using a serial task. Knowledge of a 2- to 3-bit/s increment for discrete operation after conducting a serial task experiment is a valuable resource for researchers.Of the six studies surveyed, all but one used a discrete task. Drury's (1975) serial foot-tapping experiment yielded IP = 11.8 bits/s, but it may have shown a rate around 14 bits/s had a discrete task been used. Although this would tend to disperse further the rates in Figure 11, indices in the 15- to 20-bits/s range are not uncommon in Fitts' law studies.
Five of the six studies used a simple target-capture task, and one (Card et al., 1978) used a text-selection task. The cognitive load on subjects may have been higher in the latter case due to the presence of additional text on the screen. Perhaps the burden of finding and keeping track of highlighted text within a full screen of text continued throughout the move. This task difference would reduce performance, but one can only speculate on where the effect would appear. The evidence leans toward the intercepts because they were highest in this study (1030 and 990 ms).
Selection Technique
The method of terminating tasks deserves separate analysis from other aspects of tasks. In the studies by Card et al. (1978) and Epps (1986), the target-selection button for all devices except the mouse was operated with the opposite hand from that which controlled the device. Ware and Mikaelian (1987) also used a separate hand-operated button as one of the selection conditions with the eye tracker. There is evidence that task completion times are reduced when a task is split over two hands (e.g., Buxton & Myers, 1986), suggesting that parallel cognitive strategies may emerge when positioning and selecting are delegated to separate limbs. This may explain the trackball's higher IP over the mouse in Epps' (1986) experiment – The mouse task was one-handed, the trackball task was two-handed. Unfortunately, this speculation does not extend to Card et al.'s (1978) study where IP was significantly higher for the mouse (one-handed) than for the joystick (two-handed).Conversely, and as mentioned earlier, target-selection time may be additive in the model, contributing to the intercept of the regression line but not to the slope. This argument has some support in Epps' (1986) study where the intercept is second highest out of five for the mouse, where an additive effect would appear. Both the mouse and the joystick yielded similar intercepts in Card et al.'s (1978) study, thus lending no support either way.
There are presently versions of each device that permit device manipulation and target selection with the same limb. Therefore, a Devices × Mode of Selection experiment could examine these effects on the intercept and slope in the prediction equation. In fact, mode of selection was a factor in Ware and Mikaelian's (1987) study. Based on this study, one would conclude that IP increases when selection is delegated to a separated limb (as it did for the hardware button condition vs. the dwell time or on-screen button conditions; see Figure 11).
Range of Conditions and Choice of Model
In Fitts' (1954) tapping experiments, subjects were tested over four levels each for target amplitude and target width with the lowest value for target amplitude equal to the highest value for target width (see Figure 2). In all, subjects were exposed to 16 A-W conditions with IDs ranging from 1 to 7 bits. Figure 12 tabulates the range of target conditions employed in the studies surveyed.
Figure 12. Summary of target conditions used in six Fitts' law studies.
1st Author
& YearAmplitudes
(high/low)Widths
(high/low)Number of
ConditionsIndex of Difficulty (bits) Low High Range Card, 1976 a 1, 2, 4, 8, 16 cm (16) 1, 2, 4, 10 char. b (10) 20 −0.14 6.03 6.18 Drury, 1975 a 150, 225, 300, 375, 525,
675 mm (4.5)133.8, 158.8 mm (1.2) 12 0.53 2.47 1.94 Epps, 1986 2, 4, 8, 16 cm (8) 0.13, 0.27, 0.54, 1.07, 2.14 cm (16) 9 0.90 6.94 6.04 Jagacinski, 1985 2.45, 4.28, 7.50 degrees (3.1) 0.30, 0.52, 0.92° visual angle
for joystick (3.1)9 2.41 5.64 3.22 0.40, 0.70, 1.22° visual angle
for helmet (3.1)9 2.01 5.23 3.22 Kantowitz, 1988 170, 226, 339, 453 pixels (2.7) 20, 30, pixels (1.5) 4 3.50 5.50 2.00 Ware, 1987 a 0, 2.6, 5.2, 7.8 cm (-) 2.6 cm (1) 4 −1.00 1.80 2.80 Fitts, 1954 c 2, 4, 8, 16 in. (8) 0.25, 0.5, 1, 2 in. (8) 16 1.00 7.00 6.00 a Welford formulation used for calculation of ID (see Equation 8)
b 1 character = 0.246 cm
c from Fitts (1954); included for comparison purposes only
Some stark comparisons are found in Figure 12. Kantowitz and Elvers (1988) and Ware and Mikaelian (1987) limited testing to four A-W conditions over a very narrow range of IDs (2.00 bits and 2.80 bits, respectively). Although Drury (1975) used 12 A-W conditions, the range of IDs was only 1.94 bits. This resulted because the spreads for A and W were small. Despite using six levels for A, the ratio of the highest value to the lowest value was only 4.5, and the same ratio for W was only 1.2. (When a scatter plot is limited to a very narrow range, one can imagine a line through the points tilting to and fro with a somewhat unstable slope!) The narrow range of IDs in Kantowitz and Elvers' (1988) study, combined with the observation that the lowest ID was very high (3.50 bits), could explain the large negative intercepts. (After traveling 3.5 bits to the origin, a line swiveling about a narrow cluster of points could severely miss its mark!) It is also worth noting that the predicted movement time when ID = 1 bit with Kantowitz and Elvers' (1988) velocity-control joystick under low-gain conditions is 449(1) − 880 = −431 ms. Although ID = 1 bit is not unreasonable (e.g., see Figure 2), a negative prediction for movement time is. Had this experiment included a wider range of IDs, extending down to around 1 bit, the regression line intercepts would have been higher and the slopes would have been lower.
Card et al. (1978) and Epps (1986) used a reasonable number of conditions (20 and 9, respectively) over a wide range of task difficulties (6.18 and 6.04 bits, respectively). These represent a strong complement of conditions that should yield results bearing close scrutiny.
Although a nonzero intercept can be rationalized a variety of ways, the studies by Card et al. (1978) and Ware and Mikaelian (1987) present a special problem. In these, IDs < 0 bits represent conditions that actually occurred; thus, it is certain that an appreciable positive intercept results. A contributing factor in the Card et al. (1978) study is the confounding approach angle (discussed later). In both studies, however, the negative IDs would disappear simply by using Shannon's formulation for ID (Equation 10). This would reduce the regression line intercepts because the origin would occur left of the tested range of IDs (where it should) rather than in the middle.
It is also possible that Fitts' law is simply the wrong model in some instances. Card et al. (1978) noted in the scatter plot for the joystick a series of parallel lines for each target amplitude condition. Certainly, this is not predicted in the model: A and W play equal but inverse roles, and, at a given ID, only random effects should differentiate the outcomes. Noting the systematic effect of amplitude, separate prediction equations were devised for each value of A. The result was a series of parallel regression lines with slopes around 100 ms/bit (IP = 10 bit/s) and with intercepts falling as A decreased. With this adjustment, the joystick and mouse IPs were about the same. However, this is a peculiar situation for the model – In essence, target amplitude ceases to participate.
The range of conditions also bears heavily on the coefficient of correlation. Although r is extremely useful for comparisons within a study, across-study comparisons are all but impossible unless the conditions are the same. It can be shown statistically that correlations are uncharacteristically low when a sample is drawn from a restricted range in a population (Glass & Hopkins, 1984, p. 92). This could explain the relatively low correlations in Figure 11 for Kantowitz and Elvers' (1988) study.
The extent of data aggregation also affects r. In the vast majority of Fitts' law studies, movement times are averaged across subjects and a single data point is entered into the analysis for each A-W condition. Epps (1986) did not average across subjects and entered 240 data points into the analysis (12 Subjects × 5 Amplitudes × 4 Widths). The extra variation introduced is likely the cause of the relatively low correlations in this study.
Approach Angle and Target Width
In the Card et al. (1978) study, the use of approach angle as an experimental factor in conjunction with the consistent use of wide, short targets (viz., words) provides the opportunity to address directly a theoretical point raised earlier: What is target width when the approach angle varies?
When target distance was 1 cm and target width was 10 characters (2.46 cm), ID was calculated in this study using Welford's formulation as log2(A / W + 0.5) = log2(1 / 2.46 + 0.5) = −0.14 bits. This troublesome value, although not explicitly cited, appeared in the scatter plot of MT versus ID (Figure 6, p. 609). Because character height was 0.456 cm, a better measure of ID may have been log2(1 / 0.456 + 0.5) = 1.43 bits.12 With a slope of 96 ms/bit for the mouse regression line, this disparity in IDs increases the intercept by as much as (1.43 − (−0.14)) × 96 = 151 ms. The contribution could be even more in a regression analysis using We because adjusting target width generally increases the regression line slope and increases ID for easy tasks (see Figures 6 and 7).
Thus, the negative IDs and the very large intercepts in the Card et al. (1978) study are at least partially attributable to the one-dimensional limitations in the model and to the use of a formulation for ID that allows for a negative index of task difficulty. As the investigators noted, however, the time spent in grasping the device at the beginning of a move and the time for the final button-push were also contributing factors.
Epps (1986) and Jagacinski and Monk (1985) also varied approach angle. Because the targets were squares or circles, however, there is no obvious implication to the calculation of task difficulty or to the regression coefficients.
Error Handling
Response variability (viz., errors) is an integral part of rapid, aimed movements. Unfortunately, the role of accuracy is often neglected in the application of Fitts' law. Jagacinski (1989, p. 139) noted the following:
It is difficult to reach any conclusions when one system has exhibited faster target acquisitions, but has done so with less accuracy in comparison with another system. Both systems might have the same speed-accuracy function, and the experimental evaluation might have simply sampled different points along this common function.
A simple way out of this dilemma is to build the model using We in the calculation of ID. The adjustment normalizes target width for a nominal error rate of 4%, as described earlier. However, none of the studies surveyed included the adjustment. Unfortunately, post hoc adjustments cannot be pursued at this time because error rates across levels of A and W were not reported. Although speculation is avoided on possible adjustments to the regression coefficients, it is instructive to review the strategies adopted for error handling.
Card et al. (1978) excluded error trials from the data analysis. Drury (1975) included errors in the data analysis however, only 1 miss in a block of 30 trials was permitted; otherwise, the block was repeated. Although Kantowitz and Elvers (1988) and Ware and Mikaelian (1987) reported very high error rates (up to 25% ), it was not stated if error trials were included in the regression analyses – presumably they were.
In Kantowitz and Elvers' (1988) study, subjects were not allowed to reverse the horizontal direction of movement. If a reversal was detected, the trial immediately terminated and a miss was recorded if the cursor was outside the target. This precludes potential accuracy adjustments at the end of a trial, which, no doubt, would increase movement time.
Jagacinski and Monk (1985) and Epps (1986) introduced selection criteria whereby errors could not occur – A trial continued until the target was captured. If the cursor was outside the target when the select button was pressed, subjects in Epps' (1986) study repositioned the cursor and reselected the target. Although the frequency was not reported, the inclusion of trials exhibiting such behavior is most unusual.
Learning Effects
Learning effects are a nagging, ubiquitous source of variation in experiments that seek to evaluate "expert" behavior. Often, research pragmatics prevent practicing subjects up to expert status. Fortunately, Fitts' serial or discrete paradigm is extremely simple, and good performance levels are readily achieved. Of the six studies surveyed, three made no attempt to accommodate learning effects. Of those that did, each used a different criterion to establish when asymptotic or expert levels were reached. The most accepted statistical tool for this is a multiple comparisons test (e.g., Newman-Keuls, Scheffé, or Tukey) on mean scores over multiple sessions of testing (Glass & Hopkins, 1984, chap. 17).
Only Epps (1986) included such a test. Although the design was fully within subjects, only 2 hr of testing were needed for each subject. This was sufficient to cross all levels of device (six), session (five), amplitude (four), and width (five). Subjects were novices and were given only two repetitions of each experimental condition; yet a multiple comparisons test (Bonferroni's t test; see Glass & Hopkins, 1984, p. 381) showed no improvement overall or for any device after the second session. The data analysis was based on Sessions 3 to 5.
Jagacinski and Monk (1985), who practiced subjects for up to 29 days, used the criterion of 4 successive days with the block means on each day within 3.5% of the 4-day mean. Card et al. (1978) developed a similar criterion based on a t test.13
5.5 Summary
Other sources of variation abound. Among these are the instructions to subjects, the number of repetitions per condition, the order of administering devices, the sensitivity of device transducers, the resolution and sampling rate of the measuring system, the update rate of the output display, and CD gain. However, our analysis will not extend further. The discussions on error handling and learning effects highlighted the vastly different strategies employed by researchers, but speculating on the effect of these in the model is digressive. These and other sources are felt to introduce considerable variation but with effects that are, for the most part, random. Systematic effects may be slight, unanticipated, or peculiar to one design.The range of conditions selected at the experimental design stage is a major source of variation in results. Experiments can benefit by adopting a wide and representative range of A-W conditions (e.g., 1 to 7 bits; see Figure 2). This done, the investigators can proceed to build valid information-processing models when other factors such as device or task are added. Adopting the Fitts paradigm for serial tasks (Figure 1) or discrete tasks (Figure 10) offers the benefit of a simple experimental setup and invites access to a large body of past research.
Experiments that vary approach angle and use rectangular or other long and narrow targets can avoid a negative task difficulty by using the Shannon formulation of Fitts' law (see Equation 10 and Figure 4) and/or by adopting a new notion of target width in the calculation of ID (see Figures 8 and 9). Extending the model to accommodate varying approach angles and target shapes is one area in need of further research, particularly in light of the 2D nature of user input tasks on computers.
The variety of schemes to terminate tasks and select or acquire a target undoubtedly affects the outcome of a regression analysis. There are reasonable grounds for expecting a distinct, additive component to appear in the intercept; however, evidence is scant and inconclusive. Further research is needed.
A major deficiency in the application of Fitts' law in general is the absence of a sound and consistent technique for dealing with errors. Although not demonstrated in any of the studies surveyed, the model can be strengthened using the effective target width in calculating ID (see Figure 5). Doing so normalizes response variability (viz., errors) for a nominal error rate of 4%. This theoretically sound (and arguably vital) adjustment delivers consistency and facilitates across-study comparisons. The adjustment can proceed using the error rate or the standard deviation in endpoint coordinates, as shown earlier.
Experiments are strengthened by practicing subjects until a reasonable criterion for expert performance is met. The three studies that tested for learning effects did so using mean movement times. It may be appropriate to also test subjects' rate of information processing (viz., IP) as a criterion variable. This test could be strengthened using We in the calculation of ID (see Figure 2) to accommodate both the speed and accuracy of performance. The direct method of calculating IP (viz., IP = ID / MT; see Figure 2) is easier and probably better because it nulls the intercept, blending the effects into IP. This would accommodate separate, distinct learning effects for the intercept that would be unaccounted for if IP = 1 / b (from a regression analysis) were used.
The prediction equations in the Fitts' law studies surveyed reveal large inconsistencies, making it difficult to summarize and offer de facto standard prediction equations for any of the devices tested. Despite high correlations (usually taken as evidence of a model's worth), the failings in across-study comparisons demonstrate that extracting a Fitts' law prediction equation out of a research article and embedding it in a design tool may be premature as yet.
6. CONCLUSIONS
As human-machine dialogues evolve and become more direct, the processes and limitations underlying our ability to execute rapid, precise movements emerge as performance determinants in interactive systems. Powerful models such as Fitts' law can provide vital insight into strategies for optimal performance in a diverse design space.This article has examined the theory, prediction power, and relevance of Fitts' law, citing its limitations and suggesting improvements. A survey of six studies has shown that applying the model and obtaining consistent results is not easy. Major sources of variation have been identified, and some suggestions in experimental design and methodology have been offered to ensure the worth of future studies. Certainly more research – much more – is due. It has been shown that a post hoc adjustment on target width (for a nominal error rate of 4%) and the use of a more theoretically sound equation (Equation 10) can improve the power of the model and avoid erroneous predictions. These issues plus a proper understanding of device-task associations play a vital role in the development of Fitts' law performance models capable of participating in the design of natural, efficient human-computer interfaces.
-----
Acknowledgments. I am grateful to Bill Buxton, Gil Hamann, Marilyn Mantei, Bob McLean, and members of the Input Research Group at the University of Toronto for their support and assistance and to the HCI referees who provided a meticulous critique of an earlier draft of this article. In particular, my review editor Stuart Card offered many helpful and challenging suggestions that brought perspective to many of the issues.
REFERENCES
Andres, R. 0., & Hartung, K. J. (1989). Prediction of head movement time using Fitts' law. Human Factors, 31, 703-713. https://doi.org/10.1177/001872088903100606Bainbridge, L., & Sanders, M. (1972). The generality of Fitts's law. Journal of Experimental Psychology, 96, 130-133. https://psycnet.apa.org/doi/10.1037/h0033458 Beggs, W. D. A., Graham, J. C., Monk, T. H., Shaw, M. R. W., & Howarth, C. I. (1972). Can Hick's law and Fitts' law be combined? Acta Psychologica, 36, 348-357. https://doi.org/10.1016/0001-6918(72)90031-5
Beggs, W. D. A., & Howarth, C. I. (1970). Movement control in a repetitive motor task. Nature, 225, 752-753. https://doi.org/10.1038/225752a0
Bravo, P. E., LeGare, M., Cook, A. M., & Hussey, S. M. (1990). Application of Fitts' law to arm movements aimed at targets in people with cerebral palsy. In J. J. Presperin (Ed.), Proceedings of the 13th Annual Conference of the Rehabilitation Engineering Society of North America (pp. 21.3-21.4). Washington, DC: RESNA.
Brooks, V. B. (1979). Motor programs revisited. In R. E. Talbott & D. R. Humphrey (Eds.), Posture and movement (pp. 13-49). New York: Raven.
Buck, L. (1986). Target location effects in tapping tasks. Acta Psychologica, 62, 1-13. https://doi.org/10.1016/0001-6918(86)90002-8
Buxton, W., & Myers, B. A. (1986). A study in two-handed input. Proceedings of the CHI '86 Conference on Human Factors in Computing Systems, 321-326. New York: ACM. https://doi.org/10.1145/22339.22390
Card, S. K., English, W. K., & Burr, B. J. (1978). Evaluation of mouse, rate-controlled isometric joystick, step keys, and text keys for text selection on a CRT. Ergonomics, 21, 601-613. https://doi.org/10.1080/00140137808931762
Card, S. K., Moran, T. P., & Newell, A. (1980). The keystroke-level model for user performance time with interactive systems. Communications of the ACM, 23, 396-410.
Card, S. K., Moran, T. P., & Newell, A. (1983). The psychology of human-computer interaction. Hillsdale, NJ: Lawrence Erlbaum Associates, Inc.
Carlton, L. G. (1981). Processing visual feedback information for movement control. Journal of Experimental Psychology: Human Perception and Performance, 7, 1019-1030. https://psycnet.apa.org/doi/10.1037/0096-1523.7.5.1019
Chen, M., Mountford, S. J., & Sellen, A. (1988). A study in interactive 3-D rotation using 2-D control devices. Computer Graphics, 22(4), 121-129. https://doi.org/10.1145/54852.378497
Crossman, E. R. F. W. (1960). The information-capacity of the human motor-system in pursuit tracking. Quarterly Journal of Experimental Psychology, 12, 1-16. https://doi.org/10.1080/17470216008416694
Crossman, E. R. F. W., & Goodeve, P. J. (1983). Feedback control of hand movement and Fitts' law. Reprinted in Quarterly Journal of Experimental Psychology, 35A, 251-278. (Originally presented as a paper at the meeting of the Experimental Psychology Society, Oxford, England, July 1963). https://doi.org/10.1080/14640748308402133
Drury, C. G. (1975). Application of Fitts' law to foot-pedal design. Human Factors, 17, 368-373. https://doi.org/10.1177/001872087501700408
English, W. K., Engelbart, D. C., & Berman, M. L. (1967). Display-selection techniques for text manipulation. IEEE Transactions on Human Factors in Electronics, HFE-8, 21-31. https://doi.org/10.1109/THFE.1967.232994
Epps, B. W. (1986). Comparison of six cursor control devices based on Fitts' law models. Proceedings of the 30th Annual Meeting of the Human Factors Society, 327-331. Santa Monica, CA: Human Factors Society. https://doi.org/10.1177/154193128603000403
Evans, K. B., Tanner, P. P., & Wein, M. (1981). Tablet-based valuators that provide one, two, or three degrees of freedom. Computer Graphics, 15(3), 91-97. https://doi.org/10.1145/965161.806794
Ewing, J., Mehrabanzad, S., Sheck, S., Ostroff, D., & Shneiderman, B. (1986). An experimental comparison of a mouse and arrow-jump keys for an interactive encyclopedia. International Journal of Man-Machine Studies, 24, 29-45. https://doi.org/10.1016/S0020-7373(86)80038-4
Fitts, P. M. (1954). The information capacity of the human motor system in controlling the amplitude of movement. Journal of Experimental Psychology, 47, 381-391. https://psycnet.apa.org/doi/10.1037/h0055392
Fitts, P. M., & Peterson, J. R. (1964). Information capacity of discrete motor responses. Journal of Experimental Psychology, 67, 103-112. https://psycnet.apa.org/doi/10.1037/h0045689
Fitts, P. M., & Radford, B. K. (1966). Information capacity of discrete motor responses under different cognitive sets. Journal of Experimental Psychology, 71, 475-482. https://psycnet.apa.org/doi/10.1037/h0022970
Flowers, K. A. (1976). Visual "closed-loop" and "open-loop" characteristics of voluntary movement in patients with Parkinsonism and intention tremor. Brain, 99, 269-310. https://doi.org/10.1093/brain/99.2.269
Foley, J. D. (1987, October). Interfaces for advanced computing. Scientific American, 257(4), pp. 127-135. https://www.jstor.org/stable/24979516
Gan, K-C., & Hoffmann, E. R. (1988). Geometrical conditions for ballistic and visually controlled movements. Ergonomics, 31, 829-839. https://doi.org/10.1080/00140138808966724
Gillan, D. J., Holden, K., Adam, S., Rudisill, M., & Magee, L. (1990). How does Fitts' law fit pointing and dragging? Proceedings of the CHI '90 Conference on Human Factors in Computing Systems, 227-234. New York: ACM. https://doi.org/10.1145/97243.97278
Glass, G. V., & Hopkins, K. D. (1984). Statistical methods in education and psychology (2nd ed.). Englewood Cliffs, NJ: Prentice-Hall.
Glencross, D., & Barrett, N. (1983). Programming precision in repetitive tapping. Journal of Motor Behavior, 15, 191-200. https://doi.org/10.1080/00222895.1983.10735296
Glencross, D. J., & Barrett, N. (1989). Discrete movements. In D. H. Holding (Ed.), Human skills: Studies in human performance (2nd ed., pp. 107-146). New York: Wiley.
Goldman, S. (1953). Information theory. New York: Prentice-Hall.
Goodwin, N. C. (1975). Cursor positioning on an electronic display using lightpen, lightgun, or keyboard for three basic tasks. Human Factors, 17, 289-295. https://doi.org/10.1177/001872087501700308
Gould, J. D., Lewis, C., & Barnes, V. (1985). Effects of cursor speed on text-editing. Proceedings of the CHI '85 Conference on Human Factors in Computing Systems, 7-10. New York: ACM. https://doi.org/10.1145/317456.317458
Greenstein, J. S., & Arnaut, L. Y. (1988). Input devices. In M. Helander (Ed.), Handbook of human-computer interaction (pp. 495-519). Amsterdam: Elsevier. https://doi.org/10.1016/B978-0-444-70536-5.50027-0
Haller, R., Mutschler, H., & Voss, M. (1984). Comparison of input devices for correction of typing errors in office systems. In B. Shackel (Ed.), Human-Computer Interaction - INTERACT '84 (pp. 177-182). Amsterdam: Elsevier.
Hancock, P. A., & Newell, K. M. (1985). The movement speed-accuracy relationship in space-time. In H. Heuer, U. Kleinbeck, & K.-H. Schmidt (Eds.), Motor behavior: Programming, control, and acquisition (pp. 153-188). New York: Springer-Verlag. https://doi.org/10.1007/978-3-642-69749-4_5
Hancock, W. M., Langolf, G., & Clark, D. O. (1973). Development of standard data for stereoscopic microscopic work. AIIE Transactions, 5(2), 113-118. https://doi.org/10.1080/05695557308974890
Hartzell, E. J., Dunbar, S., Beveridge, R., & Cortilla, R. (1983). Helicopter pilot response latency as a function of the spatial arrangement of instruments and controls. In F. L. George (Ed.), Proceedings of the 18th Annual Conference on Manual Control (pp. 345-364). Dayton, OH: Flight Dynamics Laboratories, Airforce Wright Aeronautical Laboratories.
Hick, W. E. (1952). On the rate of gain of information. Quarterly Journal of Experimental Psychology, 4, 11-26. https://doi.org/10.1080/17470215208416600
Hyman, R. (1953). Stimulus information as a determinant of reaction time. Journal of Experimental Psychology, 45, 188-196. https://psycnet.apa.org/doi/10.1037/h0056940
Jagacinski, R. J. (1989). Target acquisition: Performance measures, process models, and design implications. In G. R. McMillan, D. Beevis, E. Salas, M. H. Strub, R. Sutton, & L. van Breda (Eds.), Applications on human performance models to system design (pp. 135-149). New York: Plenum. https://doi.org/10.1080/00222895.1985.10735338
Jagacinski, R. J., & Monk, D. L. (1985). Fitts' law in two dimensions with hand and head movements. Journal of Motor Behavior, 17, 77-95.
Jagacinski, R.J., Repperger, D. W., Moran, M.S., Ward, S. L., & Glass, B. (1980). Fitts' law and the microstructure of rapid discrete movements. Journal of Experimental Psychology: Human Perception and Performance, 6, 309-320. https://psycnet.apa.org/doi/10.1037/0096-1523.6.2.309
Jagacinski, R. J., Repperger, D. W., Ward, S. L., & Moran, M.S. (1980). A test of Fitts' law with moving targets. Human Factors, 22, 225-233. https://doi.org/10.1177/001872088002200211
Jones, T. (1989). Effect of computer pointing devices on children's processing rate. Perceptual and Motor Skills, 69, 1259-1263. https://doi.org/10.1177/00315125890693-235
Kantowitz, B. H., & Elvers, G. C. (1988). Fitts' law with an isometric controller: Effects of order of control and control-display gain. Journal of Motor Behavior, 20, 53-66. https://doi.org/10.1080/00222895.1988.10735432
Karat, J., McDonald, J. E., & Anderson, M. (1984). A comparison of selection techniques: Touch panel, mouse and keyboard. In B. Shackel (Ed.), Human-Computer Interaction - INTERACT '84 (pp. 189-193). Amsterdam: Elsevier. https://doi.org/10.1016/S0020-7373(86)80034-7
Kay, H. (1960). Channel capacity and skilled performance. In F. A. Geldard (Ed.), Defence psychology (pp. 161-169). London: Pergamon.
Keele, S. W. (1968). Movement control in skilled motor performance. Psychological Bulletin, 70, 387-403. https://psycnet.apa.org/doi/10.1037/h0026739
Keele, S. W. (1973). Attention and human performance. Pacific Palisades, CA: Goodyear Publishing.
Keele, S. W., & Posner, M. I. (1968). Processing of visual feedback in rapid movements. Journal of Experimental Psychology, 77, 155-158. https://psycnet.apa.org/doi/10.1037/h0025754
Kerr, B. (1975). Processing demands during mental operations. Journal of Motor Behavior, 7, 15-25. https://doi.org/10.3758/BF03208899
Kerr, B. A., & Langolf, G. D. (1977). Speed of aiming movements. Quarterly Journal of Experimental Psychology, 29, 475-481. https://doi.org/10.1080/14640747708400623
Kerr, R. (1973). Movement time in an underwater environment. Journal of Motor Behavior, 5, 175-178. https://doi.org/10.1080/00222895.1973.10734962
Kerr, R. (1978). Diving, adaptation, and Fitts' law. Journal of Motor Behavior, 10, 255-260. https://doi.org/10.1080/00222895.1978.10735159
Klapp, S. T. (1975). Feedback versus motor programming in the control of aimed movements. Journal of Experimental Psychology, 104, 147-153. https://psycnet.apa.org/doi/10.1037/0096-1523.1.2.147
Knight, A. A., & Dagnall, P. R. (1967). Precision in movements. Ergonomics, 10, 321-330. https://doi.org/10.1080/00140136708930874
Kvålseth, T. 0. (1977). A generalized model of temporal motor control subject to movement constraints. Ergonomics, 20, 41-50. https://doi.org/10.1080/00140137708931599
Kvålseth, T. 0. (1980). An alternative to Fitts' law. Bulletin of the Psychonomic Society, 16, 371-373. https://doi.org/10.3758/BF03329568
Kvålseth, T. 0. (1981). Information capacity of two-dimensional human motor responses. Ergonomics, 24, 573-575.
Langolf, G. D., Chaffin, D. B., & Foulke,J. A. (1976). An investigation of Fitts' law using a wide range of movement amplitudes. Journal of Motor Behavior, 8, 113-128. https://doi.org/10.1080/00222895.1976.10735061
Langolf, G., & Hancock, W. M. (1975). Human performance times in microscope work. AIIE Transactions, 7(2), 110-117. https://doi.org/10.1080/05695557508974993
MacKenzie, I. S. (1989). A note on the information-theoretic basis for Fitts' law. Journal of Motor Behavior, 21, 323-330. https://doi.org/10.1080/00222895.1989.10735486
MacKenzie, I. S., & Buxton, W. (in press). Extending Fitts' law to two-dimensional tasks. Proceedings of the CHI '92 Conference on Human Factors in Computing Systems. New York: ACM. https://doi.org/10.1145/142750.142794
MacKenzie, I. S., Sellen, A., & Buxton, W. (1991). A comparison of input devices in elemental pointing and dragging tasks. Proceedings of the CHI '91 Conference on Human Factors in Computing Systems, 161-166. New York: ACM. https://doi.org/10.1145/108844.108868
Megaw, E. D. (1975). Fitts tapping revisited. Journal of Human Movement Studies, 1, 163-171.
Mehr, M. H., & Mehr, E. (1972). Manual digital positioning in two axes: A comparison of joystick and trackball controls. Proceedings of the 16th Annual Meeting of the Human Factors Society, 110-116. Santa Monica, CA: Human Factors Society.
Meyer, D. E., Abrams, R. A., Kornblum, S., Wright, C. E., & Smith, J. E. K. (1988). Optimality in human motor performance: Ideal control of rapid aimed movements. Psychological Review, 95, 340-370.
Meyer, D. E., Smith, J. E. K., Kornblum, S., Abrams, R. A., & Wright, C. E. (1990). Speed-accuracy tradeoffs in aimed movements: Toward a theory of rapid voluntary action. In M. Jeannerod (Ed.), Attention and performance XIII (pp. 173-226). Hillsdale, NJ: Lawrence Erlbaum Associates, Inc.
Meyer, D. E., Smith, J. E. K., & Wright, C. E. (1982). Models for the speed and accuracy of aimed limb movements. Psychological Review, 89, 449-482. https://psycnet.apa.org/doi/10.1037/0033-295X.89.5.449
Miller, G. A. (1953). What is information measurement? American Psychologist, 8, 3-11. https://psycnet.apa.org/doi/10.1037/h0057808
Milner, N. P. (1988). A review of human performance and preferences with different input devices to computer systems. In D. Jones & R. Winder (Eds.), People and Computers IV: Proceedings of the Fourth Conference of the British Computer Society -- Human-Computer Interaction Group (pp. 341-362). Cambridge, England: Cambridge University Press.
Newell, A., & Card, S. K. (1985). The prospects for psychological science in human-computer interaction. Human-Computer Interaction, 1, 209-242. https://doi.org/10.1207/s15327051hci0103_1
Pew, R. W. (1974). Human perceptual-motor performance. In B. H. Kantowitz (Ed.), Human information processing: Tutorials in performance and cognition (pp. 1-39). Hillsdale, NJ: Lawrence Erlbaum Associates, Inc.
Pew, R. W., & Baron, S. (1983). Perspectives on human performance modelling. Automatica, 19, 663-676. https://doi.org/10.1016/B978-0-08-029348-6.50008-7
Pierce, J. R. (1961). Symbols, signals, and noise: The nature and process of communication. New York: Harper & Brothers.
Radwin, R. G., Vanderheiden, G. C., & Lin, M-L. (1990). A method for evaluating head-controlled input devices using Fitts' law. Human Factors, 32, 423-438. https://doi.org/10.1177/001872089003200405
Reza, F. M. (1961). An introduction to information theory. New York: McGraw-Hill.
Rouse, W. B. (1980). Systems engineering models of human-computer interaction. New York: Elsevier.
Salmoni, A. W. (1983). A descriptive analysis of children performing Fitts' reciprocal tapping task. Journal of Human Movement Studies, 9, 81-95.
Salmoni, A. W., & Mcilwain, J. S. (1979). Fitts' reciprocal tapping task: A measure of motor capacity? Perceptual and Motor Skills, 49, 403-413. https://doi.org/10.2466/pms.1979.49.2.403
Schmidt, R. A. (1988). Motor control and learning (2nd ed.). Champaign, IL: Human Kinetics Publishers.
Schmidt, R. A., Zelaznik, H. N., & Frank, J. S. (1978). Sources of inaccuracy in rapid movement. In G. E. Stelmach (Ed.), Information processing in motor control and learning (pp. 183-203). New York: Academic. https://doi.org/10.1016/B978-0-12-665960-3.50014-1
Schmidt, R. A., Zelaznik, H. N., Hawkins, B., Frank, J. S., & Quinn, J. T., Jr. (1979). Motor-output variability: A theory for the accuracy of rapid motor acts. Psychological Review, 86, 415-451. https://psycnet.apa.org/doi/10.1037/0033-295X.86.5.415
Shannon, C. E., & Weaver, W. (1949). The mathematical theory of communication. Urbana: University of Illinois Press.
Sheridan, M. R. (1979). A reappraisal of Fitts' law. Journal of Motor Behavior, 11, 179-188. https://doi.org/10.1080/00222895.1979.10735186
Sheridan, T. B., & Ferrell, W. R. (1963). Remote manipulator control with transmission delay. IEEE Transactions on Human Factors in Electronics, 4, 25-29. https://doi.org/10.1109/THFE.1963.231283
Sperling, B. B., & Tullis, T. S. (1988). Are you a better "mouser" or "trackballer"? A comparison of cursor-positioning performance. SIGCHI Bulletin, 19(3), 77-81. https://doi.org/10.1145/49108.1046379
SPSSx release 3.1. (1990). [Computer program]. New York: SPSS.
Sugden, D. A. (1980). Movement speed in children. Journal of Motor Behavior, 12, 125-132. https://doi.org/10.1080/00222895.1980.10735212
Tello, E. R. (1988, September). Between man and machine. Byte, pp. 288-293. Thomas, C., & Milan, S. (1987). Which input device should be used with interactive video? In B. Shackel (Ed.), Human-Computer Interaction - INTERACT '87 (pp. 587-592). Amsterdam: Elsevier.
Vince, M. A. (1948). Corrective movements in a pursuit task. Quarterly Journal of Experimental Psychology, 1, 85-103. https://doi.org/10.1080/17470214808416749
Wade, M.G., Newell, K. M., & Wallace, S. A. (1978). Decision time and movement time as a function of response complexity in retarded persons. American Journal of Mental Deficiency, 83, 135-144.
Wallace, S. A., & Newell, K. M. (1983). Visual control of discrete aiming movements. Quarterly Journal of Experimental Psychology, 35A, 311-321. https://doi.org/10.1080/14640748308402136
Wallace, S. A., Newell, K. M., & Wade, M. G. (1978). Decision and response times as a function of movement difficulty in preschool children. Child Development, 49, 509-512. https://doi.org/10.2307/1128718
Ware, C., & Baxter, C. (1989). Bat brushes: On the uses of six position and orientation parameters in a paint program. Proceedings of the CHI '89 Conference on Human Factors in Computing Systems, 155-166. New York: ACM. https://doi.org/10.1145/67449.67482
Ware, C., & Mikaelian, H. H. (1987). An evaluation of an eye tracker as a device for computer input. Proceedings of the CHI+GI '87 Conference on Human Factors in Computing Systems and Graphics Interface, 183-188. New York: ACM. https://doi.org/10.1145/29933.275627
Welford, A. T. (1960). The measurement of sensory-motor performance: Survey and reappraisal of twelve years' progress. Ergonomics, 3, 189-230. https://doi.org/10.1080/00140136008930484
Welford, A. T. (1968). Fundamentals of skill. London: Methuen.
Welford, A. T., Norris, A. H., & Shock, N. W. (1969). Speed and accuracy of movement and their changes with age. Acta Psychologica, 30, 3-15. https://doi.org/10.1016/0001-6918(69)90034-1
Woodworth, R. S. (1899). The accuracy of voluntary movements [Monograph supplement]. Psychological Review, 3(2, Whole No. 13). https://psycnet.apa.org/doi/10.1037/h0092992
Wright, C. E., & Meyer, D. E. (1983). Conditions for a linear speed-accuracy trade-off in aimed movements. Quarterly Journal of Experimental Psychology, 35A, 279-296. https://doi.org/10.1080/14640748308402134
Zelaznik, H. N., Mone, S., McCabe, G. P., & Thaman, C. (1988). Role of temporal and spatial precision in determining the nature of the speed-accuracy trade-off in aimed-hand movements. Journal of Experimental Psychology: Human Perception and Performance, 14, 221-230. https://psycnet.apa.org/doi/10.1037/0096-1523.14.2.221
Zimmerman, T. G., Lanier, J., Blanchard, C., Bryson, S., & Harvill, Y. (1987). A hand gesture interface device. Proceedings of the CHI+GI '87 Conference on Human Factors in Computing Systems and Graphics Interface, 189-192. New York: ACM. https://doi.org/10.1145/1165387.275628
-----
Footnotes:
1 Throughout this article, the following units are consistently used:
bits/s for IP, ms/bit for b,
and ms for MT and a.
2 The 2 may also be explained by expressing the log term as
log2(A / ½W),
where A is the distance moved and ½W is the size of the error band on
each side of target center.
3 Welford's formulation produces a similar curve to Equation 10 except
that ID approaches -1 bit as A approaches zero.
4 The study by MacKenzie, Sellen, and Buxton (1991) is an
exception. Fitts' law prediction equations were derived for the
mouse, trackball, and tablet-with-stylus in both pointing and
dragging tasks. The equations were derived using the Shannon
formulation for ID and the effective target width, We.
5 Despite being more cumbersome, the standard deviation method is
better than the discrete error method because more behavioral
characteristics can be discerned, such as the predominance of
overshoots versus undershoots or the presence of outliers.
6 A two-tailed t test shows that the difference between the Fitts and
Shannon correlations (r =
.9904 vs. r = .9937; both calculated using We) is statistically
significant (t = 2.20, df = 13, p <
.05; see MacKenzie, 1989). Welford's formulation consistently yields
correlations between those
using the Fitts and Shannon formulations.
7 The differences between the correlations in the disc and pin
transfer experiments are not statistically significant; however,
these experiments used IDs of 4 to 10 bits and 3 to 10 bits,
respectively. As demonstrated in Figure 4, the Fitts and Shannon
formulations differ significantly only when IDs extend under
around 3 bits.
8 The reader is invited to verify this with a felt-tipped pen and a
sheet of paper. Tapping back and forth between two rectangular targets
(as in Figure 1) will produce two patterns as described.
9 A test of two-dimensional models for Fitts' law can be found in
MacKenzie and Buxton (in press).
10 Note that the unusual choice of A = 0 as an experimental condition
precludes the use of
Fitts' equation, because log20 is undefined.
11 The ratio of performance differences was also the same: IP for
the position-control system was higher than IP for the
velocity-control system by a factor of 3. 2 / 2.2 = 1.5 in Kantowitz
and
Elvers' (1988) study and by a factor of 5.9 / 3.9 = 1.5 in Jagacinski,
Repperger, Moran, Ward, and Glass' (1980) study. (In the latter study, the values cited were
averaged over the dwell time and steadiness criteria for target capture.)
12 Using the Shannon formulation (Equation 10), the index of task
difficulty under these conditions is further increased: ID = log2(1 / 0.456 + 1) = 1.67 bits.
13 t tests are not as reliable as multiple comparisons tests when
more than two means (blocks) are compared. The alpha (probability
of a Type I error) associated with the t statistic is higher than
predicted (Glass & Hopkins, 1984, p. 369).