
Statistical Analysis in Plant Biology (Chris Luszczek)
The complete tutorial is also avalable in pdf format.
Introduction.
This is a statistical tutorial for Plant Biology. It will provide you with the basics of various common statistical methods and examples of how to perform these tests using SPSS statistical software available in York's computer labs and accessible from home using York's remote Web-based File Access System (WebFAS).Warning! WebFAS may involve a lengthy installation procedure and I have found it to be finicky, sometimes requiring multiple attempts at installation. Be aware of this if you are downloading the software at home... at midnight the evening before your report is due.
Using York's computer labs avoids any problems you may have using WebFAS.
Outline
- Hypothesis Building
- Null hypothesis/alternate hypothesis
- Hypothesis Testing
- Visual summary
- Common Statistical tests and how to run them
- Summary statistics
- T-test
- Setting Up a T-test
- Paired versus independent t-tests
- 1-tailed versus 2-tailed t-tests
- Running a T-test in SPSS
- Importing the data and analysis in SPSS
- Reporting t-test results
- Graphing
- How to present your findings
- Types of graphs and usage
- Formatting
- Correlations
1. Hypothesis Building
- Creating a testable hypothesis is central to scientific method
1a. Null hypothesis/alternate hypothesis
- Null (H0) hypothesis - 'no effect' or 'no difference' between samples or treatments
- Alternative (HA) hypothesis - experimental treatment has a certain statistically significant effect
- A claim for which we are trying to find evidence
Some Examples
- H0: "Different light spectra have no effect on photosynthetic activity" (H0: x2=x1 or x2-x1=0)
- HA: "Pollen treated with chloramphenicol grow faster than untreated pollen" (HA: x2>x1 or x2-x1>0)
2. Hypothesis Testing
- Either reject or fail to reject the H0 based on statistical testing
- Statistical testing compares the p-value of observed data to an assigned significance level (α -- alpha)
- p-value - the frequency or probability with which the observed event would occur
- α = the probability that the outcome did not occur by chance
- Popular levels of significance are 5% (0.05), 1% (0.01), and 0.1% (0.001)
- If the p-value is SMALLER than α, reject the null hypothesis (H0)
2a. Visual Summary
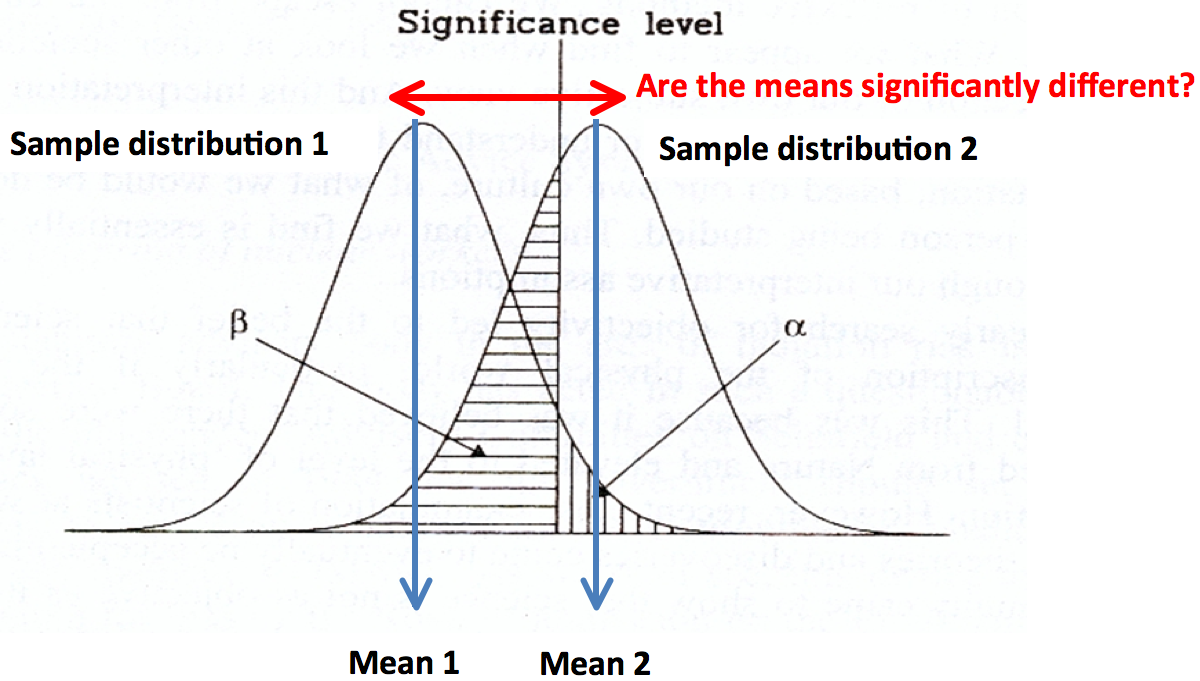
3. Common Statistical Tests
3a. Summary statistics
You should already be aware of the basic summary statistics. Usually, scientific data are summarized by reporting the mean, the standard deviation and the sample size.
3b. T tests
For this course you are expected to understand and use t-tests
T-tests are used to determine if two sets of data (2 means) are significantly different from each other. It assumes that the data are normally distributed and samples are equal.
Two decisions must be made when selecting a t-test:
- Are the samples paired or independent?
- Is the comparison 1-tailed or 2-tailed?
4. Setting Up a T-Test
4a. Paired versus independent t-tests
- A One-sample (paired) t-test compares two samples in cases where each value in one sample has a natural partner in the other (data are not independent). It can be used during pre- or post- data analysis. It is also used to compare a sample mean to a specified value.
One example of paired t-test analysis is comparing patient performance before and after the application of a drug. The data are paired because the same patuent is compared before and after treatment.- A two-sample (independent) t-test compares the means for two groups of cases.
An example of independent t-test analysis is comparing patient performance in a group receiving a drug versus a separate group receiving a trial drug.4b. 1-tailed versus 2-tailed t-tests
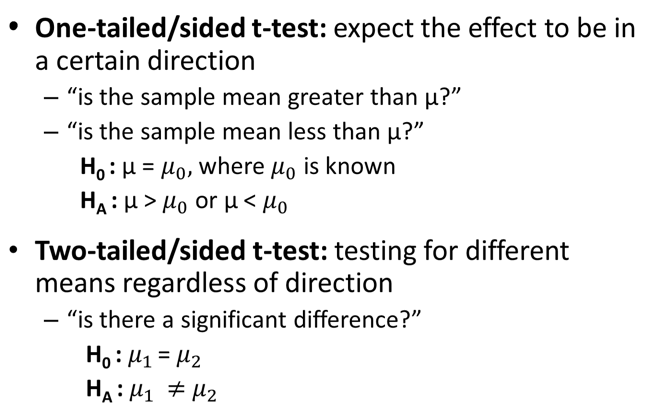
- A One-tailed/sided t-test expects the effect to be in a certain direction.
- Is the sample mean greater than μ? (μ is the population mean, the greek letter 'mu')
- Is the sample mean less than μ?
H0: μ = μ0 where μ0 is known
HA: μ > μ0 or μ < μ0- A Two-tailed/sided t-test tests for different means regardless of whether it is greater or smaller.
- Is there a significant difference?
H0: μ1 = μ2
HA: μ1 ≠ μ2
- A carefully stated experimental hypothesis will indicate the type of effect you are looking for
- For example, the hypothesis that "Coffee improves memory" suggests paired, one tailed because you will repeatedly measure the same participants and expect an improvement
- "Men weigh a different amount from women" suggests an independent two tailed test as no direction is implied.
So remember, don't be vague with your hypothesis if you are looking for a specific effect! Be careful with the null hypothesis too - avoid "A does not affect B" if you really mean "A does not improve B".
5. Running a T-test in SPSS
Question: Do two photosynthetic organisms have the same oxygen evolution capability?
Null Hypothesis: HA: μ1 = μ2 (Both photosynthetic organisms produce the same amount of oxygen)
An independent 2-tailed t-test!
Alternative Hypothesis: HA: μ1 ≠ μ2 (the two photosynthetic organisms DO NOT produce equal amounts of oxygen)
5a. Importing the data and analysis in SPSS
In your browser, 'viewing image' should enlarge the screenshots

Excel spreadsheets can be imported into SPSS
After selecting a file, a window will give you the option of reading Row 1 data as column labels.
- Make sure your spreadsheet is saved on the C: drive of your computer
- Make sure excel file types are selected
Having difficulty importing the excel file?
Manually entering the data is possible. Make sure that your first column is set for labels and the second column for the data.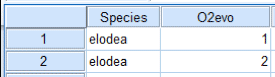
Sometimes you will automatically see a summary of your data rather than the data -- to correct:
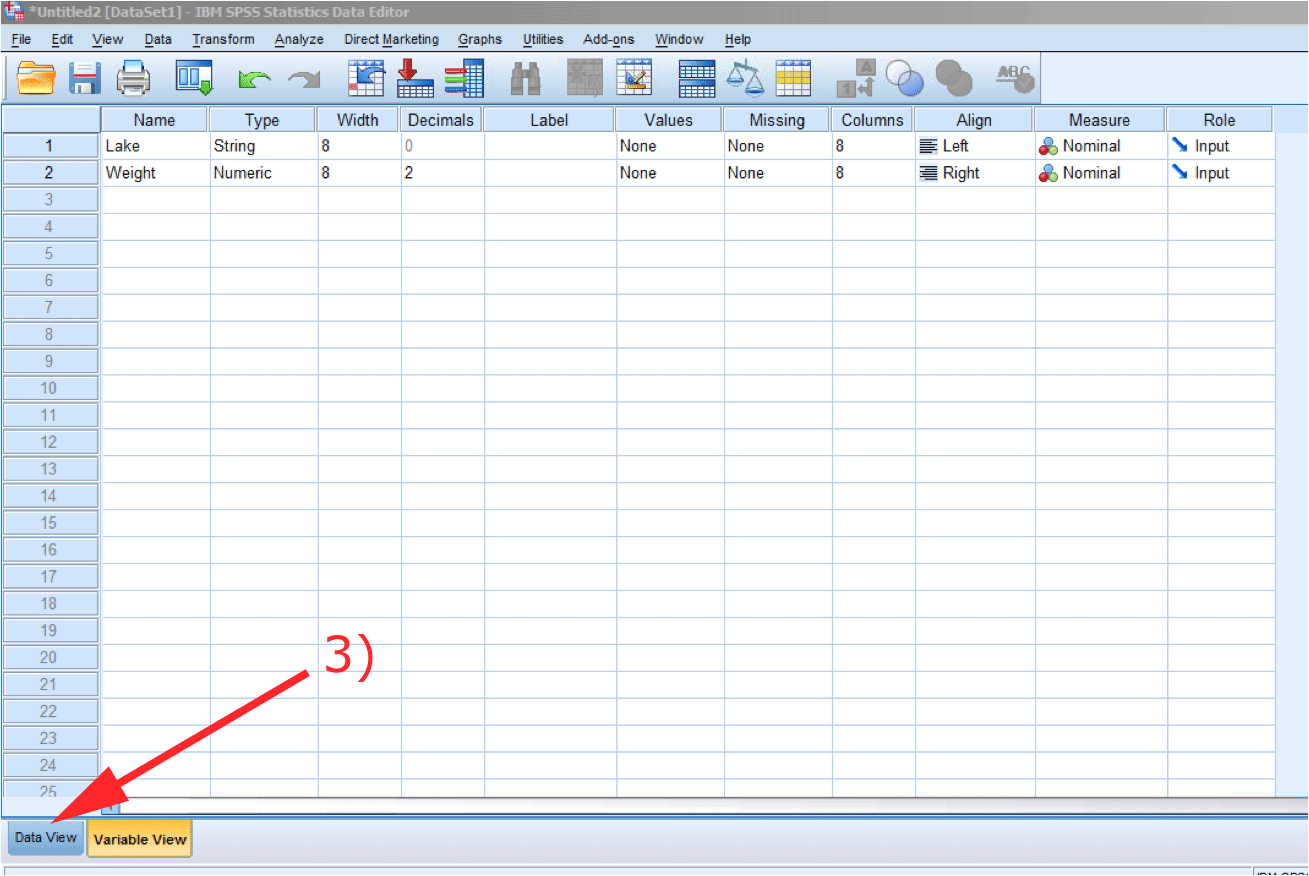
- Click 'Data view' tab rather than 'Variable view'
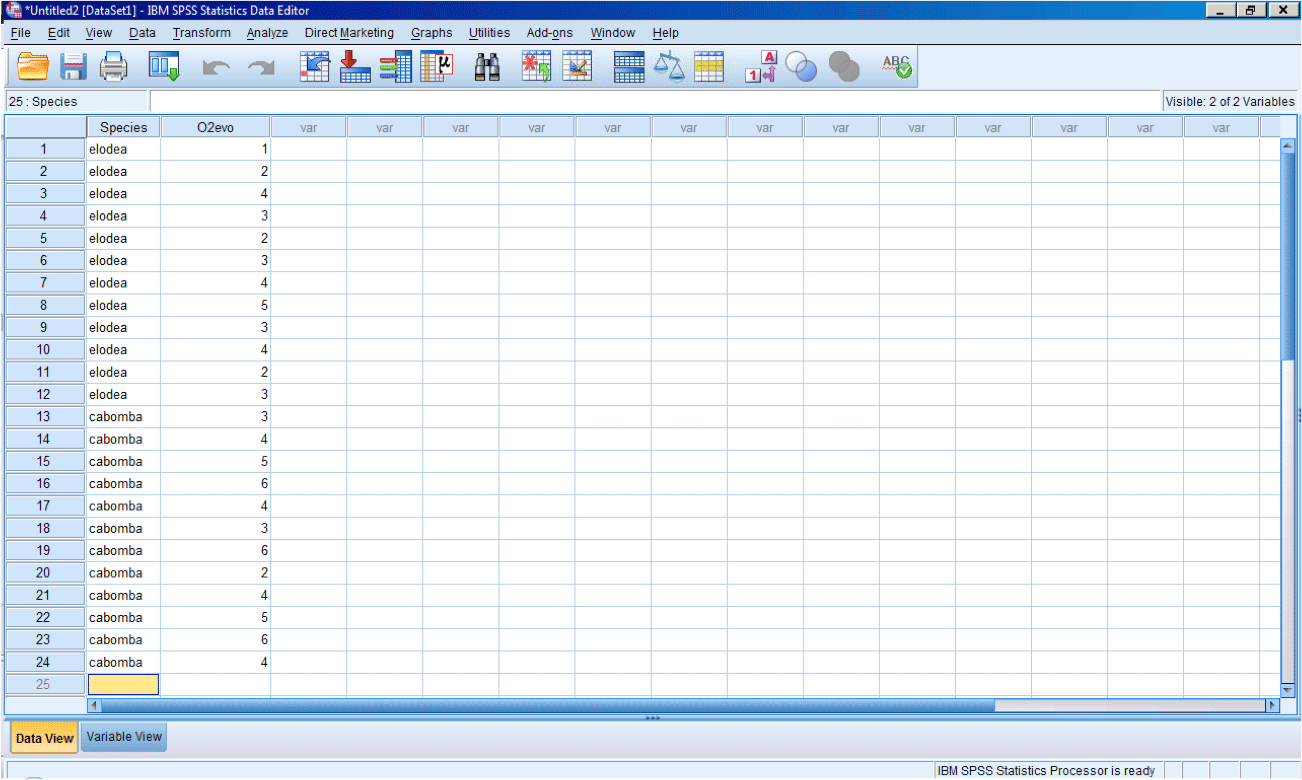
Data view and layout in SPSS
- Notice the variable names in the column headers
- All raw data is listed (SPSS will calculate means for you)
- Data is listed in one column (all with the same units) with the first column indicating the grouping
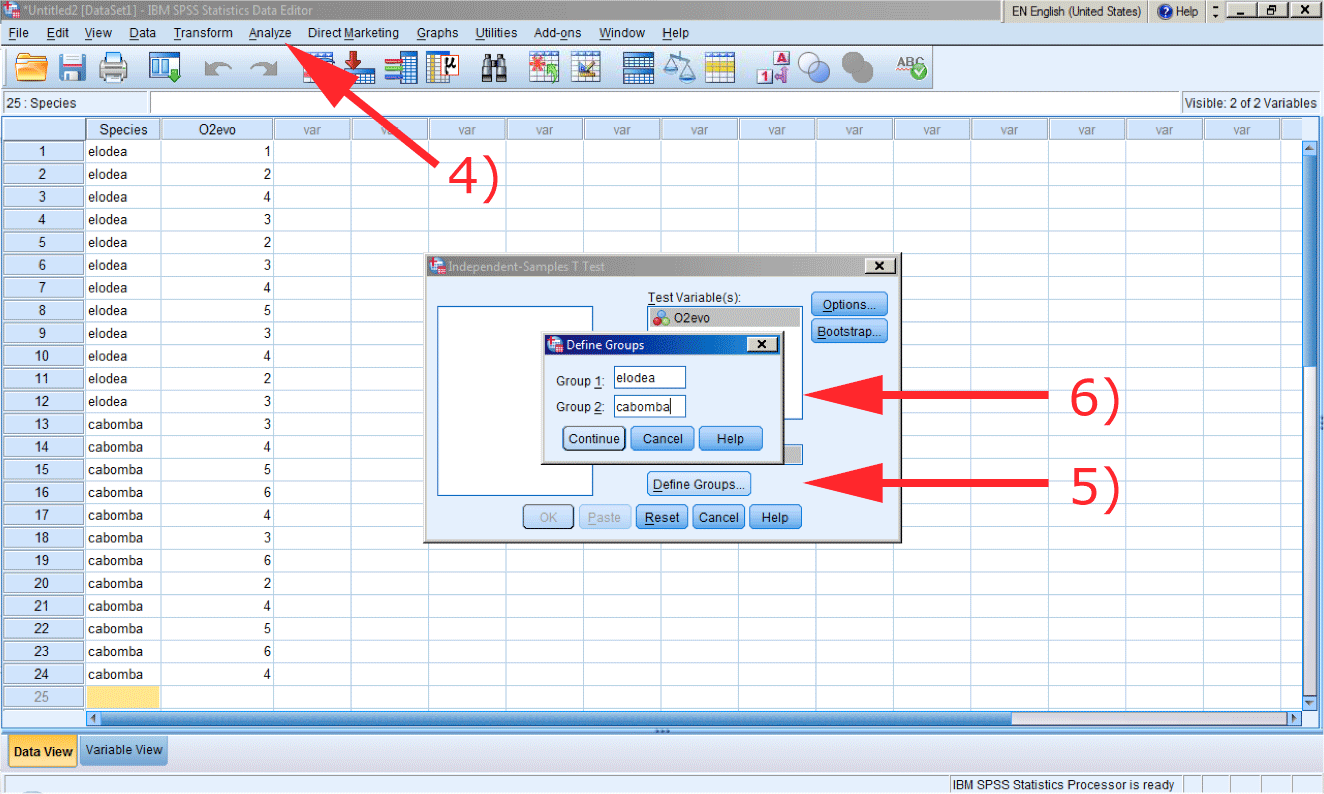
Analyzing data
- Select Analyze --> compare means --> independent samples t test
O2evo is the test variable, species is the grouping variable- Click on define groups, then
- type the two names used in the data view
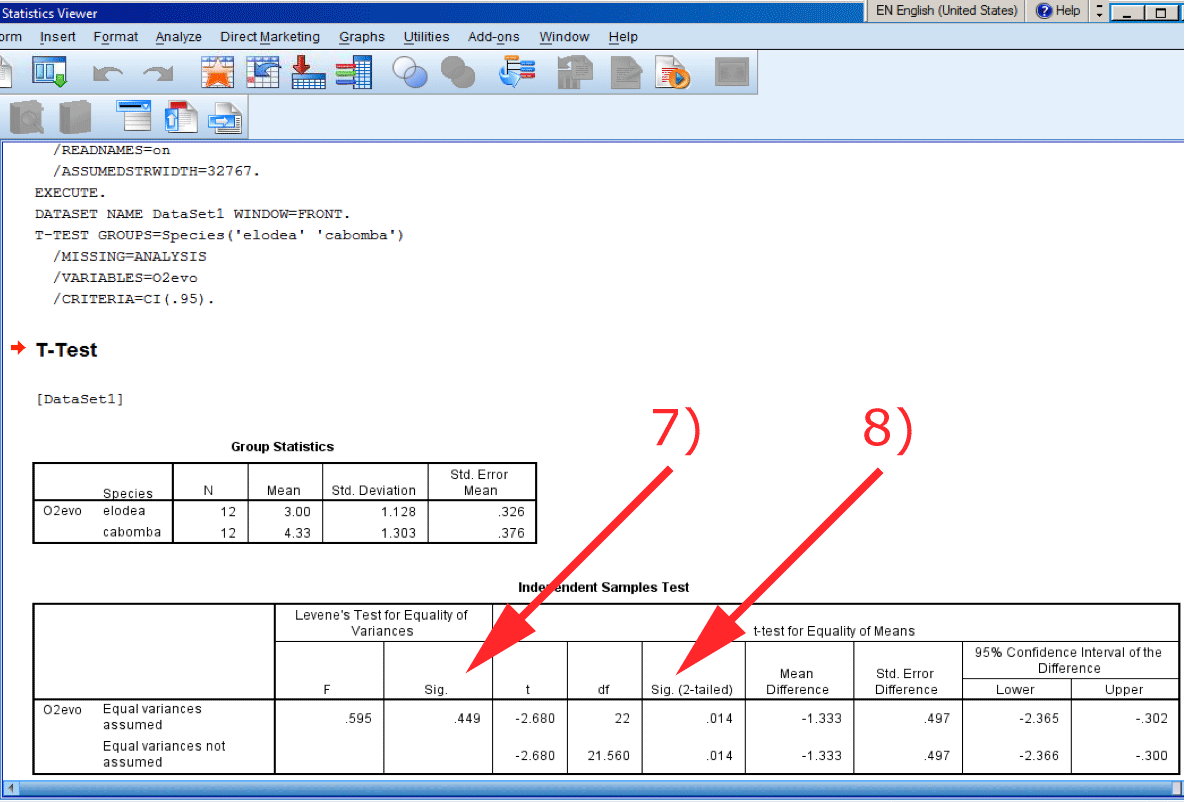
Analysis output
Interpreting the output in our example
- We first check Levene's test --which assesses if variances are equal
if p > 0.05, then the variances are equal and you can interpret the t results- The t-test result is p = 0.014
so we can reject the null hypothesis, thus the two photosynthetic organsims DO NOT produce equal amounts of oxygen.
5b. Reporting t-test results
For purposes of this course you are required to take a print screen of your SPSS output (as in the previous slide) and attach this in your report.
- All performed statistics MUST be referred to in the text of your report
- You must indicate:
Here is an example: "An independent, 2-tailed t-test was performed comparing mean O2 production from species one and species two. A significant difference (α = 0.05, p=0.014) in production was found between species and we therefore reject the null hypothesis of this experiment."- The type of test performed
- The data the test was performed on
- The α (-- alpha) level used (0.05 is the default)
- The p-value outcome of your t-test
- Whether you accept or reject the null hypothesis
6. Graphing
Choosing Graphs
- Some tests are related to specific figures
For example, correlations and scatter plots
- The following examples outline the basic use of several common graphs
- Scatter plots
- Line Graphs
- Bar graphs
- Histograms
 Your hypothesis and statistical test should guide your choice of figures!
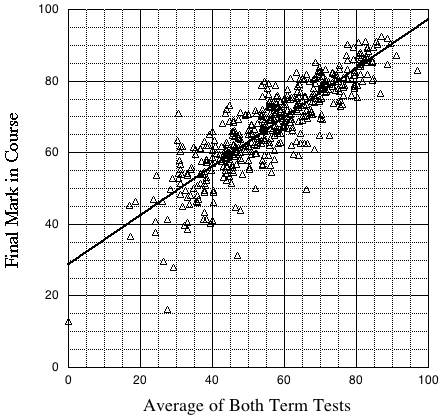
Scatter plots
- Displays 2 variables for a set of data
- Dependent vs. independent -- one variable is under the control of the other variable
Line graphs
- Shows relationship between values plotted on each axis (dependent vs. independent)
- Used on continuous variables

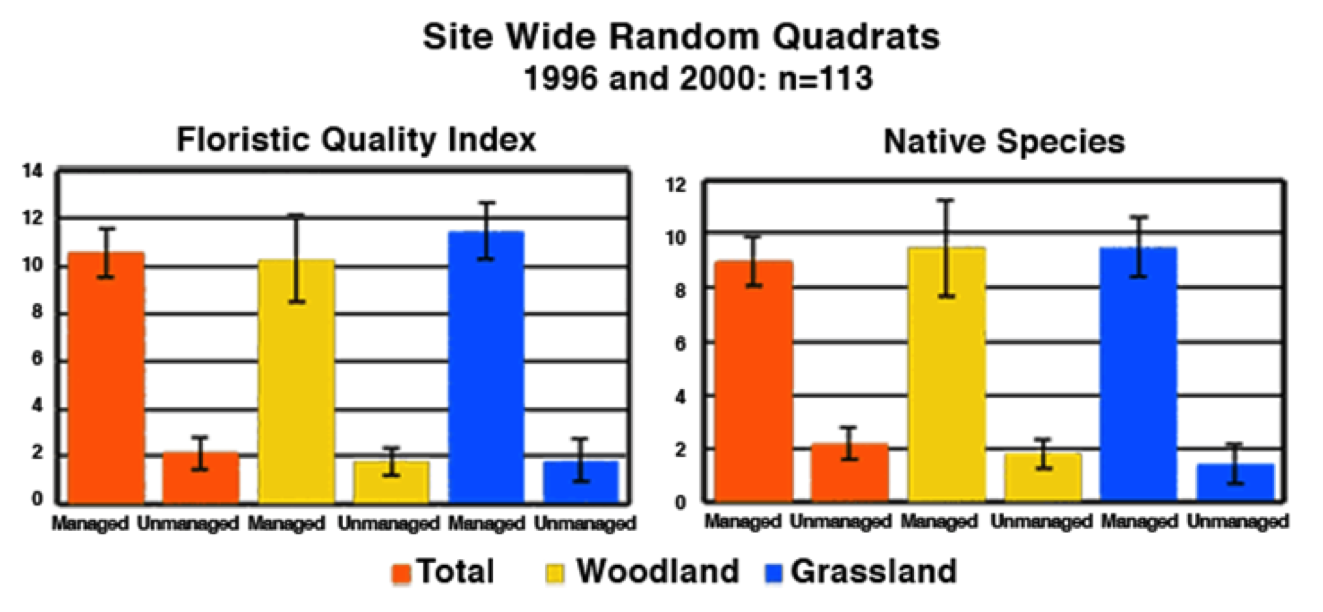
Bar graphs
- Used for discrete quantitative variables which are similar but not necessarily related
- Often used to display t-test results
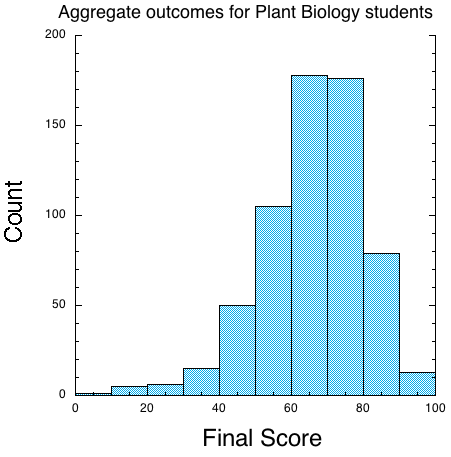
Histograms
- Used exclusively for showing the distribution of data that are continuous.
7. Correlations
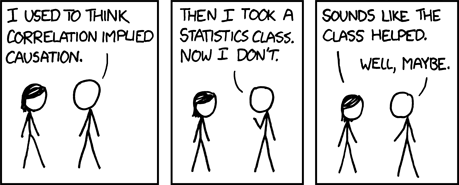 Correlation analysis measures the strength and direction of a linear relationship between two random variables.
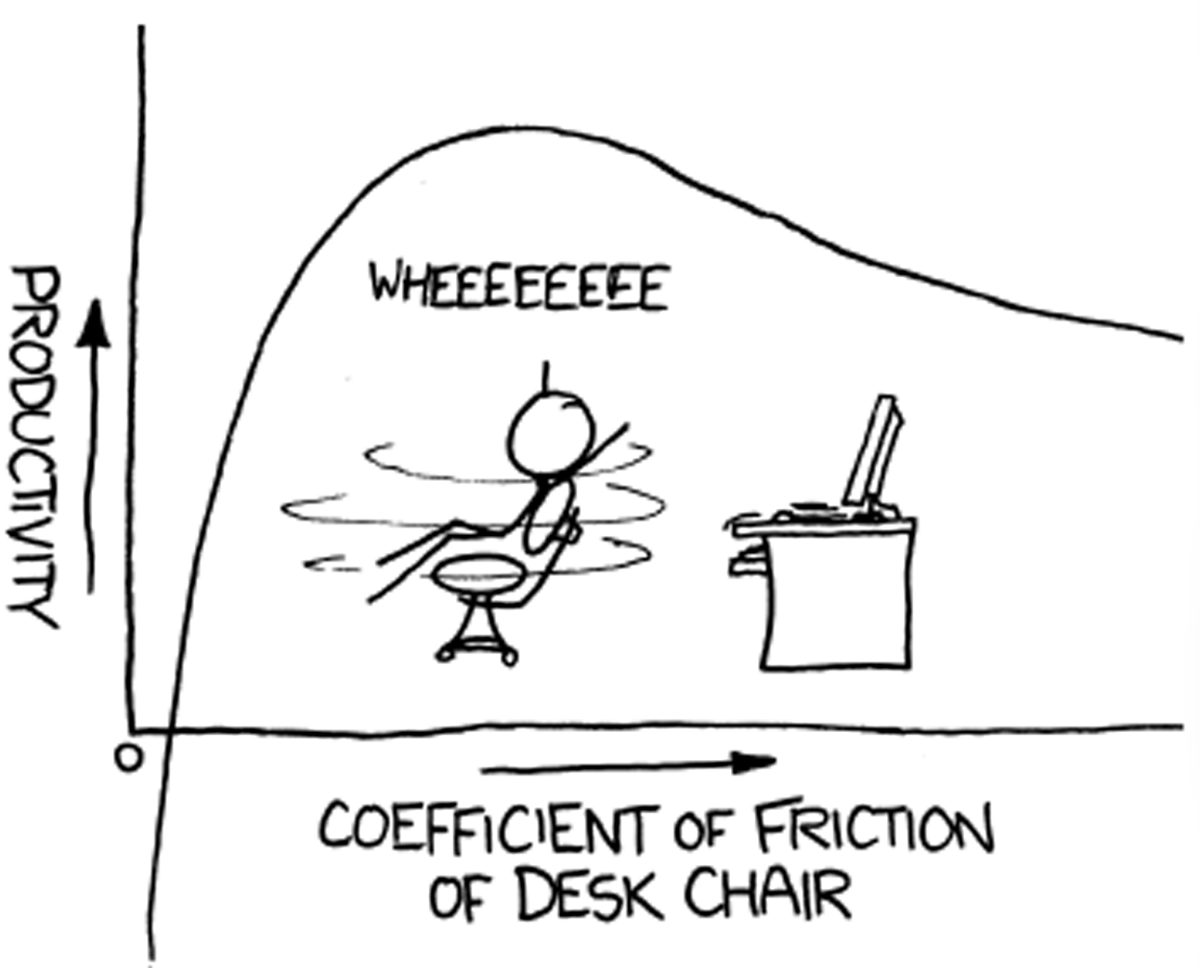
But be careful! Two random variables may be strongly correlated, but that does not mean the
relationship is causal (as explained by Randall Munroe --xkcd.com).
Correlation analysis measures the strength and direction of a linear relationship between two random variables.
But be careful! Two random variables may be strongly correlated, but that does not mean the
relationship is causal (as explained by Randall Munroe --xkcd.com).
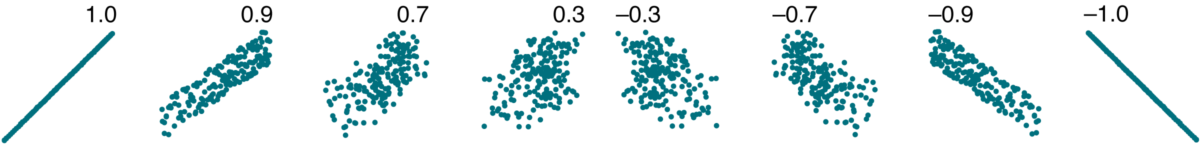
- Pearson's Correlation Coefficient (r) measures the relationship between two variables
- Positive r-values means that the two variables increase with each other. Negative r-values mean they decrease with each other. When the r-value is close to zero, the variables have no relationship, while r-values close to either -1 or 1 mean the relationship is strong.
- R2 (coefficient of determination) is used to assess how well a regression line fits the data: 0 means no fit, 1 means a perfect fit.
Pearson's
Conclusions
This tutorial has provided you with the basic theory, mechanics and applications of common statistical tests.
You should now be able to carry out scientific reporting from hypothesis formation to statistical testing and figure formatting