How to Report an F-Statistic
I. Scott MacKenzieDept. of Electrical Engineering and Computer Science
York University
Toronto, Ontario, Canada M3J 1P3
mack@cse.yorku.ca
Last update: 29/3/2015
Background
Human-computer interaction research often involves experiments with human participants to test one or more hypotheses. One of the most common statistical tools for hypothesis testing is the analysis of variance (ANOVA). The ANOVA result is reported as an F-statistic and its associated degrees of freedom and p-value.This research note does not explain the analysis of variance, or even the F-statistic itself. Rather, we explain only the proper way to report an F-statistic. "Proper way" refers to the formatting of the statistic and to the construction of a dialog to present it. Simple as this seems, F-statistics are often improperly formatted and poorly presented in research papers. Let's get to it.
Discussion
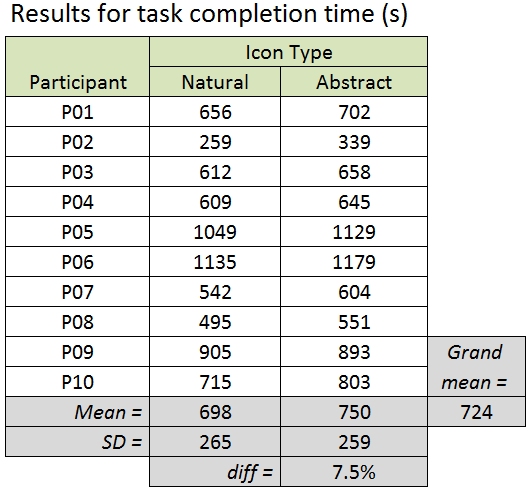
Assume you conducted an experiment with ten participants to compare natural and abstract icons. The independent variable is Icon Type with two levels, natural and abstract. Participants completed a timed task where they associated the meaning of icons with icon images, grouped according to type. The dependent variable is task completion time, in seconds.After conducting the experiment, you have the following data:
Using your favourite statistics program, you run an analysis of variance on the data and obtain the following:
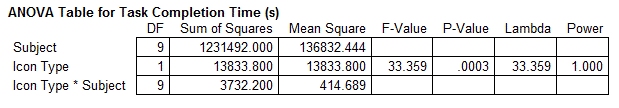
Because p is less than .05, the result is statistically significant. This might be conveyed in a research paper as follows:
There was a significant effect of Icon Type on task completion time (F1,9 = 33.4, p < .0005).
And that's about it. Of course, there are many ways to craft a dialog to report the result – this is just a simple example. Importantly, the sentence captures the relationship between the independent variable and the dependent variable; i.e., "There was a significant effect of [independent variable] on [dependent variable]".
Note in the sentence above that the ANOVA result is presented in parentheses. Bear in mind that the results of statistical tests are not the results per se. Statistical tests play a supporting role. They allow conclusions to be drawn with the weight of probabilities. The results lie in the observations and measurements. The measurements are best articulated in terms of the mean scores across test conditions and the effect size. (The "effect size" is the difference in mean scores.) Given this, a more informative presentation of the results might appear as follows:
The grand mean for task completion time was 724 seconds. By Icon Type, the means were 698 seconds for natural icons and 750 seconds for abstract icons. As evident in the means, the recongition task took 7.5% longer for the abstract icons compared to the natural icons. The difference was statistically significant (F1,9 = 33.4, p < .0005).
Of particular importance here is the presentation of the ANOVA result, including the F-statistic. The key points are as follows:
- Set in parentheses
- Uppercase for F
- Lowercase for p
- Italics for F and p
- F-statistic rounded to three (maybe four) significant digits
- F-statistic followed by a comma, then a space
- Space on both sides of equal sign and both sides of less than sign
- Degrees of freedom set as subscript, plain, smaller font
- No space following the comma in the degrees of freedom
- Exact value of p not reported
- p rounded up to a more conservative value from the set {.05, .01, .005, .001, .0005, .0001}
- No zero before the decimal point for p (because it is constrained between 0 and 1)
If p is above .05, the result is not statistically significant. In this case, there are two possibilities. If p is greater than .05 and F is greater than 1, report the result something like this:
There was no significant effect of Icon Type on task completion time (F1,9 = 2.34, p > .05).
If p is greater than .05 and F is less than 1, report the result something like this:
There was no significant effect of Icon Type on task completion time (F1,9 = 0.876, ns).
Statistical significance is impossible if F is less than 1; hence, the convention of reporting the probability simply as "ns" for "not significant".
Good luck!
More discussion on the ANOVA and other statistical tools commonly used in HCI research are found in Chapter 6 in Human-Computer Interaction: An Empirical Research Perspective.
Acknowledgement
The motivation to put together this research note came from discussions with Wendy MacKay at CHI 2008 in Florence. The hypothetical experiment and data are from Dix et al.'s Human-Computer Interaction (Prentice Hall, 2004, 3rd ed., p. 337).