DeLong, S. , & MacKenzie, I. S. (2018). Evaluating devices for object rotation in 3D. Proceedings of 20th International Conference on Human-Computer Interaction - HCII 2018 (LNCS 10907), pp. 160-177. Berlin: Springer. doi:10.1007/978-3-319-92049-8_12 [PDF] [video]
Abstract. An experiment with 12 participants was conducted to compare the performance of a mouse, a mobile phone accelerometer, and a joystick in a 3D rotation task. The 3D rotation task was designed to measure throughput, the user performance metric specified in ISO 9241-9. The mouse had a throughput and error rate of 4.09 bps and 0.88%, respectively, the mobile phone 2.05 bps and 3.46%, and the joystick 2.42 bps and 1.76%. The differences were significant between the mouse and both the mobile phone and joystick, but not between the mobile phone and joystick. There was a significant difference in error rate only between the mouse and mobile phone conditions. The mobile phone condition did not appear to conform to Fitts' law as task index of difficulty had no apparent relationship with movement time. This was most likely caused by reaction time and homing time for that condition. Evaluating Devices for Object Rotation in 3D
Sean DeLong & I. Scott MacKenzie
York University
Dept of Electrical Engineering and Computer Science
Toronto, Canada
{seand, mack}@cse.yorku.ca
Keywords: Input Devices, User Interfaces, Performance Measurement, Fitts' Law, 3D Interfaces, Object Orientation.
1 Introduction
Advancements in virtual reality (VR) and augmented reality (AR), along with the ever-increasing graphical capabilities of modern computers, emphasizes the need for improved three-dimensional, or 3D, interaction. Given that objects in real 3D space can be described and controlled in six degrees of freedom (DOF), it is reasonable to assert that similar DOFs are needed for an input control to achieve natural interaction in virtual 3D space.There has been substantial research on methods of input with DOFs higher than the typical two DOF common in traditional inputs like the mouse and capacitive touch. Ortega et al. [15] provide an extensive overview of the technologies and devices supporting higher DOF inputs.
Despite emerging methods of input, the traditional computer mouse remains the primary device for 3D tasks in areas such as 3D modeling, computer-aided design (CAD), and game development. Inputs with only two DOF are also ubiquitous in the video game industry, as joysticks are designed into nearly every controller for Nintendo, Xbox, and PlayStation consoles.
Whether lower DOF devices are better, or even adequate, for 3D tasks seems inconclusive. While there is some evidence that two-DOF inputs are fast and accurate for 3D selection [18] and 3D object translation [1], other evaluations found that input devices with three DOF are faster for 3D object rotation [e.g., 6].
The research described herein is the first empirical study of 3D object rotation using Fitts' law and the performance measure throughput, as described in ISO 9241-9 [7].1 In the following section, we review related work and the calculation of throughput, as per the ISO standard with extensions to our technique for 3D rotation. Then, we discuss the methodology and results of our user study. This is followed with our conclusions on user performance with the devices tested and task employed.
2 Related Work
Table 1 gives an overview of research where user studies evaluated devices for 2D and 3D tasks. The table is organized is by task type, with target selection tasks on top and object translation and rotation tasks on the bottom. The table also identifies the performance measurements and the types of inputs.
Table 1. Overview of user studies evaluating methods of 2D and 3D input.
First Author
[ref]Primary Quantitative
Performance MeasurementsTask Type Input Method Input DOF MacKenzie
[11]Movement Direction Change,
Movement Variability,
Movement Error,
Movement time,
Error rate,
Throughput2D target selection Mouse 2 2D target selection Trackball 2 2D target selection Joystick
(rate control)2 2D target selection Touchpad 2 Natapov
[14]Movement Direction Change,
Movement Error,
Error rate,
Throughput2D target selection Joystick (rate control) 2 2D target selection Trackball (rate control) 2 Teather
[18]Movement time,
Error rate,
Throughput2D target selection Mouse Cursor 2 3D target selection Pen Ray 6 3D target selection Pen Touch 2 3D target selection Floating Cursor 2 3D target selection Sliding Cursor 2 Young
[21]Movement time,
Error rate,
Throughput3D target selection Gyro-based wearable 6 Bérard
[1]Galvanic skin response,
Blood volume pulse amplitude,
Heart rate,
Session time,
Error rate3D object translation Mouse 2 3D object translation DepthSlider 3 3D object translation SpaceNavigator 6 3D object translation Free-space 6 Hinckley
[6]Task time,
Accuracy3D object rotation Mouse- virtual sphere 2 3D object rotation Mouse- Arcball 2 3D object rotation Magnetic sensor- 3D Ball 3 3D object rotation Magnetic sensor - Tracker 3
Additional discussion on the studies in Table 1 is provided in the following sections.
2.1 Degrees of Freedom in Input Devices for 3D Tasks
The number of DOF in an input control determines the mappings to an output display. Interaction where an input device has the same DOFs as an object on an output display can achieve spatial congruence, resulting in natural interactions that are easy to learn [9, p. 78]. When there are less DOF in the device than the display, modes or mappings are required. These must be learned, however, and this may impact usability.
Table 1 highlights evaluations of devices with varying DOF. Both mice and joysticks have been evaluated using Fitts' law tasks for target selection in 2D [11, 14]. Since these devices have two DOF, they have a near-congruent relationship with a desktop display, where only the input z-axis requires mapping to the output y-axis. As an example, the 2D control display mappings for the mouse are shown in Fig. 1.
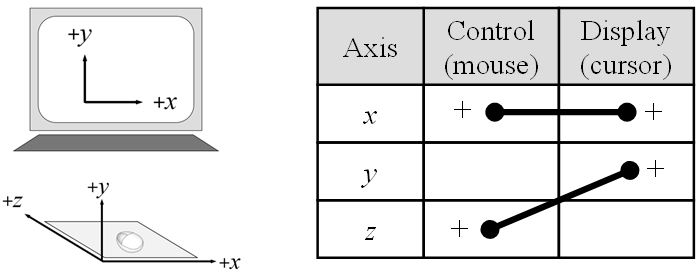
Fig. 1. Mapping of mouse control space to cursor display space [9, p. 76]. The plus (+) symbol indicates that positive motion of the control yields positive motion in the display.
The mapping from the z-axis to the y-axis is simple and is easily learned. However, these two-DOF devices require complex mappings to control 3D displays. Consider the translation and rotation of an object in 3D, a task that requires six DOF. A mouse or joystick can only control two DOF at once without mappings or modes. Common practices for 3D rotation with two-DOF devices are to introduce additional graphical controls [2] or to implement a virtual sphere mapping [2, 4-6]. The virtual sphere maps each axis in the two-DOF device to an axis of rotation in the three-DOF display. This is shown in Fig. 2. Note that rotation around the z-axis cannot be controlled.
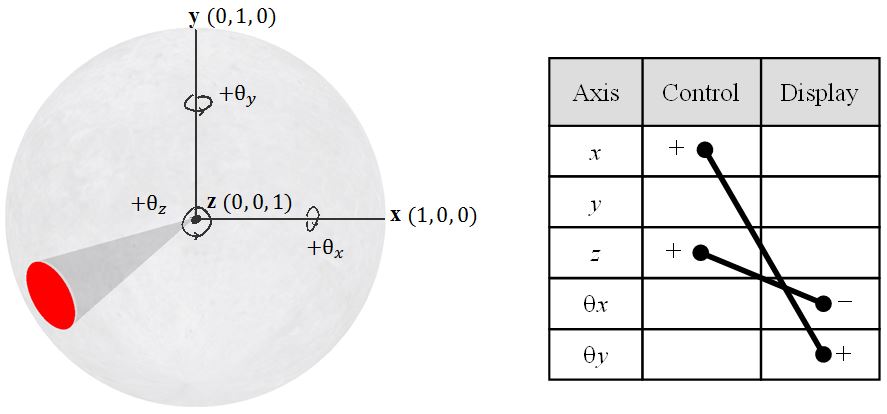
Fig. 2. Virtual sphere mapping of two-DOF controls.
The translation of an object in 3D can be accomplished with two DOF using multiple viewpoint cameras [1] or ray-casting techniques [18].
In contrast, devices with six DOF can achieve spatial congruence in 3D translation and rotation with one-to-one control-display mappings. Typically, the six DOF are implemented via an accelerometer and magnetic sensor [1, 20, 22]. Such mapping is shown in Fig. 3.
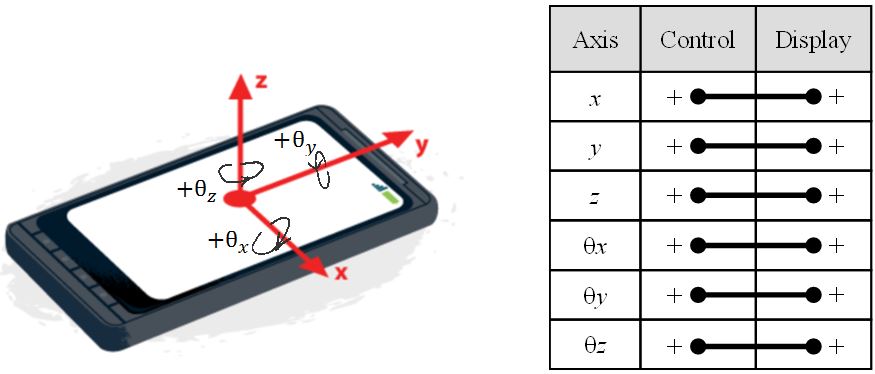
Fig. 3. 3D spatially congruent mapping with a six-DOF input control.
Prior work found that spatially congruent mappings with higher DOF devices do not necessarily make 3D target selection faster or more accurate than with two-DOF devices like the mouse [1, 18]. The robust user performance measure known as throughput has been used for some of these evaluations [18, 21].
Other empirical evidence, such as the work of Hinckley et al. [6], suggests that for the three-DOF task of object rotation, spatial congruency reduces task time compared to the mouse. However, to our knowledge, no such study exists using throughput as a performance measure for 3D rotation.
2.2 Fitts' Law and Throughput for 2D Target Selection
Fitts' law quantifies the relationship between distance, movement time, and accuracy for rapid aimed movements [3]. The usual formulation of this relationship is
| MT = a + b ID | (1) |
where MT is the movement time to complete a target-selection task, a and b are linear regression coefficients, and ID is the index of difficulty, with units "bits". ID was originally defined as
| ID = log2(2A / W). | (2) |
The A variable is the amplitude of the movement, or the distance from the start of an initial location to a final target of width W.
Fitts also defined the term IP, called the index of performance, which quantifies the human information capacity of the motor system. IP has units "bits per second", or "bps", and is defined as
| ID = ID / MT. | (3) |
MacKenzie proposed a variation of ID according to Shannon's information theory [16], modifying ID to
| ID = log2(A/W + 1). | (4) |
This variation has been incorporated into an ISO standard for performance measurements of pointing devices. ISO 9241-9 proposes the throughput (TP) measurement [7], which has been refined to
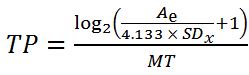 . .
| (5) |
Throughput is the current equivalent of Fitts' index of performance. The Ae term in eq. 5 is the effective amplitude, which is the amount a participant or cursor moved, rather than what the task specified. The SDx term is the standard deviation of the selection endpoints, as projected on the task axis.
Throughput's usefulness comes from its robustness and inclusion of both speed and accuracy [10]. Furthermore, if calculated consistently, it provides a basis for between-study comparisons, where device evaluations and findings are directly compared in different studies [16].
2.3 3D Target Selection
Since the emergence of ISO 9241-9, throughput is the standard user performance measure for evaluating of 2D pointing devices, and thus extensive comparisons can be made with existing literature. However, despite throughput being robust enough to describe movements in 3D as well as 2D, the calculation of throughput in 3D tasks is much less common.
Some exceptions are the work of Young et al. [21], where throughput is a performance measure for a 3D arm-mounted inertial controller, and the work of Teather and Stuerzlinger [18], where the throughputs of various 3D pen and cursor inputs are compared with throughputs typical of two-DOF mice and pen devices. Teather et al. [19] designed a system to extend the ISO 9241-9 Fitts' law pointing task into 3D environments, adding a depth component to targets.
2.4 Throughput Calculation for Rotation Tasks
Fitts' law has also been examined in rotation tasks. Meyer et al. [13] conducted 1D rotation experiments using Fitts' original definition of ID, shown in eq. 2. Using an apparatus for measuring wrist rotation, they studied rotation about the wrist joint from an initial angle to a target angle. A was defined as the specified rotation, in degrees, from the starting position to the target, and W was defined as the specified target range, in degrees. From their experiments, Meyer et al. presented Fitts' law-derived descriptive models for total, primary-submovement, and secondary-submovement endpoint distributions and movement times [13]. Since this work predates the introduction of throughput, index of performance is used instead of throughput in their quantitative analysis.
In more recent work, Stoelen and Akin conducted a 1D rotation Fitts' law experiment using the modified definition of ID, shown in eq. 4 [17]. Throughput was used in their quantitative analysis. They defined the rotational index of difficulty ID as
| ID = log2(α/ω + 1). | (6) |
where α is the rotation amplitude between a cursor's start and target angle, and ω is the target angle width. These parameters are shown in Fig. 4.
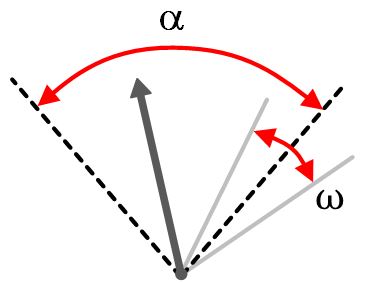
Fig. 4. Definition of α and ω in a rotational index of difficulty (ID) [17].
2. 5 Defining a Fitts' Law Task for 3D Rotation
The experimental task presented herein was designed to be a spatially congruent interpretation of the 2D Fitts' law task described in the ISO 9241-9 standard. A standard 2D implementation is provided in the FittsTaskTwo software, as shown in Fig. 5.2
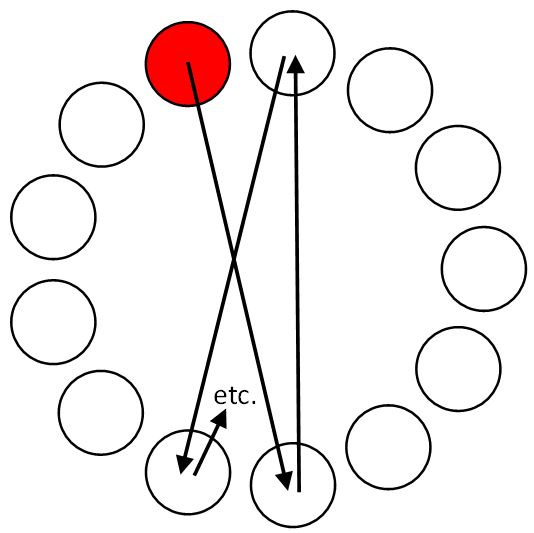
Fig. 5. ISO 9241-9 2D task showing a sequence of 13 targets.
Some challenges were faced in designing a suitable task to test throughput for object rotation in 3D. Firstly, because of the 3D nature of the task, both the cursor and the target become warped when oriented at certain angles in 3D space. For example, when oriented along the x-axis, all depth in the z-direction of the target range of angles is lost. This removes the user's ability to place the cursor in the center of the target angle range. The image on the left in Fig. 6 illustrates this. It was therefore decided that the target should not be fixed at any orientation other than along z-axis perpendicular to the screen. This prevents the true target angle range from becoming distorted.
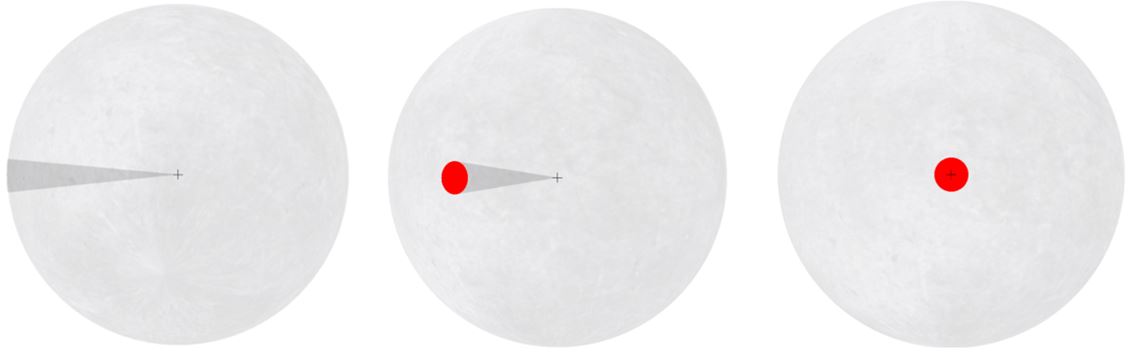
Fig. 6. A single discrete rotation task.
Furthermore, the target can be represented by a cone because it encompasses a range of angles; however, the cursor can only be represented by a single line. Thus, the cursor becomes foreshortened when oriented in the z-direction, becoming a single point when parallel to it. For this reason, it was decided that the cursor should be fixed in the positive z-direction, facing towards the user. Although this restricts the cursor to a single point, it can be represented by a crosshair and becomes consistent throughout the trials. These issues can be mitigate somewhat if the apparatus includes 3D glasses and head tracking; however, our apparatus was limited to 2D rendering of 3D space.
Extending eq. 6 to 3D, and considering adjustments for the effective index of difficulty, the parameters α and ω are defined as
| α = cos-1(A • z). | (7) |
and
| αe = α + dx. | (8) |
The coefficients in eq. 7 and eq. 8 are illustrated in Fig. 7.

Fig. 7. Amplitude (α), width (ω), and axes definitions.
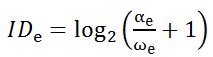
Recommendations outlined by Soukoreff and MacKenzie [16] were used for Fitts' law model construction. For calculating the effective index of difficulty IDe, amplitude α was adjusted to the effective amplitude αe using the angle difference between the cursor and the center of the target at the end of the task, as projected onto the task axis. The target width ω was adjusted to ωe using the standard deviation SDx of the task endpoint differences dx. Eq. 7 through eq. 11 were used for throughput calculation:
| ωe = 4.133 × SDx | (9) |
| (10) |

| (11) |
This is a three DOF task, but only requires two DOF to complete. This has the benefit of removing the need for modes in the two-DOF input conditions, so that the results are more comparable to those obtained in the standard 2D ISO 9241-9 task.
3 Methodology
3.1 Participants
Twelve unpaid participants were recruited from local universities. The participants were a mixture of graduate and undergraduate students. Two of the participants were female, eight were male. Ages ranged from 21 to 28 years. All participants were right-handed, though not by experimental design. Furthermore, all participants use computers daily.
The participants' median response to the number of hours of video games played per week was two to four hours. Two of the participants do not play video games on a regular basis. Only two participants use CAD software, between two to four hours a week. Seven participants had more than two hours of experience using AR or VR technology.
3.2 Apparatus
Hardware. A Microsoft Surface Pro 4 tablet running Windows 10 ran the experiment for all conditions (Fig. 8a). The tablet configuration included the optional keyboard. Only the ENTER key was used on the keyboard.
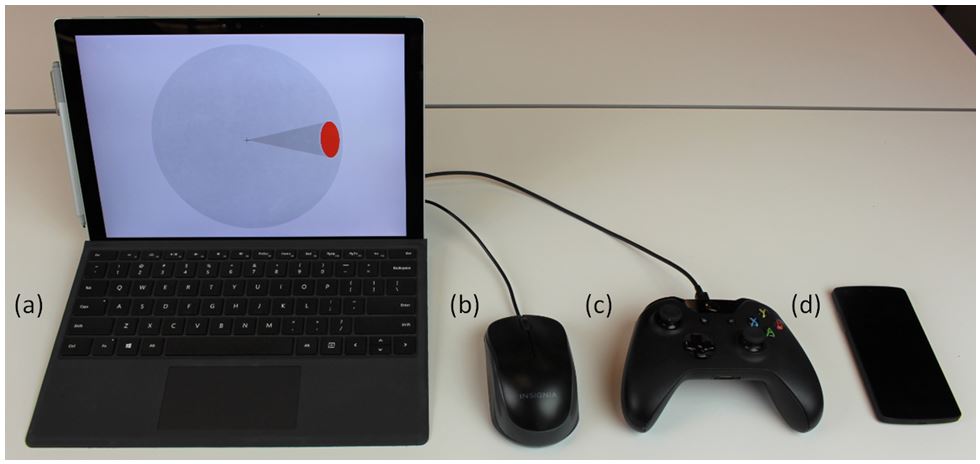
Fig. 8. The host system and input devices. (a) Microsoft Surface Pro 4 tablet with optional keyboard, (b) Logitech M-U0026 mouse, (c) Microsoft Xbox One game controller, and (d) LG Nexus 5 mobile phone.
A Logitech M-U0026 optical USB mouse was used for the mouse condition (Fig. 8b). The default Windows 10 mouse pointer speed was used, with enhanced pointer precision enabled. A Microsoft Xbox One controller was used for the joystick condition (Fig. 8c). Either the left or right thumb stick could be used for object rotation, depending on a participant's preference. Joystick control-display gain was measured as the velocity of sphere rotation, in degrees per second. The gain was linear from 0°/s to 150°/s, corresponding to the joystick's rest position and maximum displacement, respectively.
An LG Nexus 5 was used for its on-board magnetic gyroscope for the mobile phone condition (Fig. 8d). The gyroscope data were recorded at 50 Hz and streamed over an ad-hoc Wi-Fi network to the remote application on the tablet. The data streaming introduces a 46-ms lag in the system, but was not expected to increase error rates by more than about 5% [12]. Cursor movement was position-control with 1:1 gain (1° of device rotation caused 1° of cursor rotation on the sphere).
Software. The experimental software was developed primarily in JavaScript and compiled using Electron.3 A Node.js server was hosted on the tablet for all conditions and was responsible for data logging, as well as streaming gyroscope data in the mobile phone tasks. The 3D orientation task was implemented with the three.js library.4
For both the mouse and joystick input methods, the Arcball method of rotation for two-DOF inputs was implemented because of its intuitiveness and ease of implementation [6].
Task. The software implemented the experiment task described in the preceding section. For each input method, the participant performed eight sequences of 19 trials. For each input method, the participant was instructed to hold the device in their preferred hand, then place their other hand on the ENTER key. This was meant to reduce homing time.
3.3 Procedure
When participants arrived, they were seated at the system and familiarized with the task. For each input method, they performed a practice sequence of at least 19 trials to get used to the input method. These practice trials were meant to nullify any learning effects during the timed trials.
After the practice trials, participants were asked to perform all eight sequences continuously. They were instructed to select the targets at a comfortable pace, while proceeding as quickly and accurately as possible. The participants were permitted a rest break after each method of input. An example of a participant performing the experiment task with each input method is shown in Fig. 9.

Fig. 9. Input methods: mobile phone (left), mouse (middle), and joystick (right).
A questionnaire was given after the experiment to gather information on how much time they played video games, worked with CAD software, and worked with VR or AR technology. The questionnaire also inquired about participants' impressions of the input methods on a 7-point Likert scale.
3.4 Design
The experiment was a fully within-subjects 3 × 4 × 2 design, with the following independent variables and levels:
Input Method: mobile phone, mouse, joystick Amplitude (α): π/4, π/3, 3π/4, 5π/6 Width (ω): π/8, π/16
The independent variable of primary interest was input method. The amplitude and width independent variables were necessary to ensure the computation of throughput covered a range of task difficulties. The primary dependent variables were movement time, error rate, and throughput.
To offset learning effects the order of presenting the three input methods was counterbalanced. Two participants were assigned to each of the six possible orders. The amplitude and width variations give way to eight IDs ranging from 1.58 bits to 3.84 bits. See Table 2. These were presented in each condition in a random sequence. For each of the eight sequences, 19 trials were performed. Throughput and error rate were calculated for each of the eight sequences.
Table 2. Task amplitudes, widths, and index of difficulties.
α (rads) π/4 π/3 π/4 π/3 3π/4 5π/6 3π/4 5π/6 ω (rads) π/8 π/8 π/16 π/16 π/8 π/8 π/16 π/16 ID (bits) 1.58 1.87 2.32 2.66 2.81 2.94 3.70 3.84
In all, there were 12 Participants × 3 Input Methods × 4 Amplitudes × 2 Widths × 19 Trials = 5472 trials.
4 Results and Discussion
After the experiment was finished, the data were imported into a Microsoft Excel spreadsheet where summaries of various measures were calculated and charts were created. The statistical tests were performed using the GoStats application.5
4.1 Data Adjustment
During many of the trials for the mobile phone condition, participants had to adjust their grip on the device or had trouble mapping the device's orientation to the virtual object's orientation. This usually happened when the target amplitude changed from one sequence to the next, resulting in a task that required a new, drastic rotation. These trials, which typically had movement times greater than two standard devia-tions from the 19-trial mean, were considered outliers and removed. Using this crite-rion, 369 of 5472 trials (6.7%) were excluded from analysis.6 After outlier removal, input method throughput and error rate were calculated by first calculating throughput and error rate on each 19-trial sequence, then averaging these measures to produce values across participants and conditions.
4.2 Throughput
The grand mean for throughput was 2.86 bps. Fig. 10 shows the throughputs for each input method. The mouse throughput of 4.09 bps was about 100% greater than the mobile phone throughput at 2.05 bps and 70% greater than the joystick throughput at 2.42 bps. An ANOVA revealed that input method had a significant effect on throughput (F2,10 = 45.04, p < . 0001). A Scheffé post hoc analysis revealed that the difference was significant between the mouse and the mobile phone and the mouse and the joystick, but not between the mobile phone and the joystick.
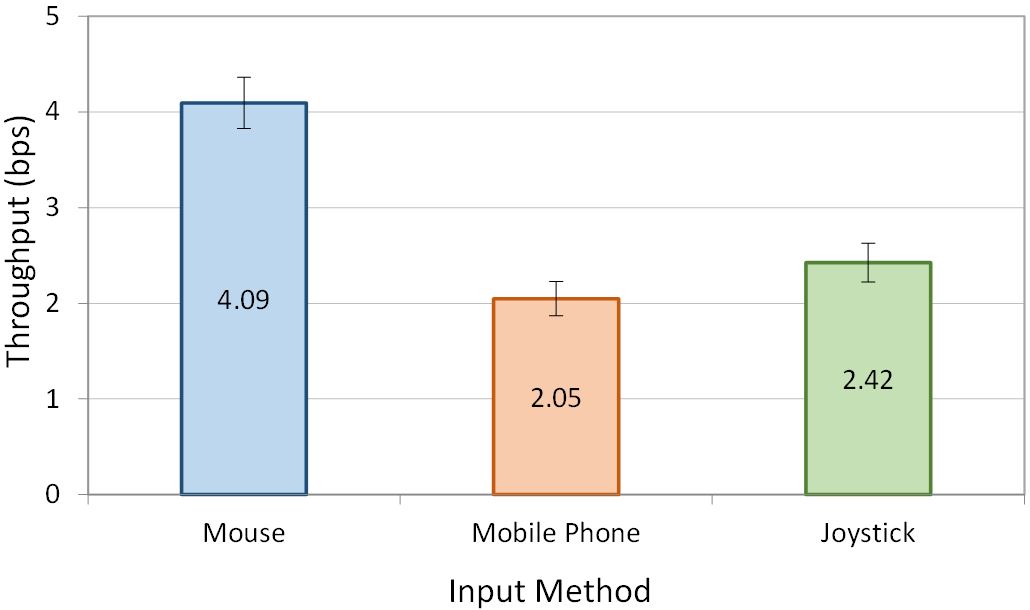
Fig. 10. Throughput by input method. Error bars show ±1 SE.
The throughputs for the mouse and joystick were similar to values reported in other work [11, 14, 18]. Interestingly, the joystick in this rotation task yielded a higher throughput (2.42 bps) than it did for 2D selection experiments performed by MacKenzie et al. [11] (1.8 bps) and Natapov and MacKenzie [14] (2.01 bps). This suggests that the thumb-controlled joystick is better suited to the 3D rotation task than it is to the 2D target-selection task. However, a true assessment of this would require a within-study comparison of these conditions, to eliminate confounding influences. Despite the spatially congruent mapping, the mobile phone condition still performed worse than the input methods with less DOF. The possible reasons are discussed below.
4.3 Error Rate
The grand mean for error rate was 2.03%. Fig. 11 shows the error rate for each input method. The mouse condition had the lowest error rate of only 0.88%, and the mobile phone condition had the highest error rate of 3.46%. The joystick error rate was about half the mobile phone error rate (1.76%). There was a significant effect of input method on error rate (F2,10 = 10. 63, p < . 001). A Scheffé post hoc analysis revealed that the error rate only differed significantly between the mouse and mobile phone.

Fig. 11. Error rate by input method. Error bars show ±1 SE.
The error rates for each input method were relatively low compared to other research. The mouse in the work of MacKenzie et al. [11] had a throughput and error rate of 4.9 bps and 9.4%, whereas we observed 4.09 bps and 0.88% in the 3D rotation task. This discrepancy might be caused by our participants emphasizing accuracy over speed in the rotation task, along with the relatively large target widths.
4.4 Effective Index of Difficulty
Since participants rarely performed the task exactly as specified, the effective index of difficulty IDe varies. Table 3 shows the specified and effective index of difficulties averaged across participants, along with the standard deviation of endpoints for each condition.
Table 3. Expected index of difficulty (ID) and endpoint variation (SDx) and for each condition the observed effective index of difficulty (IDe) and standard deviation (SDx).
Expected Observed Mouse Mobile Phone Joystick ID (bits) SDx (rads) IDe (bits) SDx (rads) IDe (bits) SDx (rads) IDe (bits) SDx (rads) 1.58 0.095 2.58 0.041 2.08 0.062 2.01 0.065 1.87 0.095 2.86 0.045 2.18 0.073 2.33 0.073 2.32 0.047 3.34 0.024 2.81 0.032 2.53 0.048 2.66 0.047 3.63 0.026 3.04 0.037 3.05 0.036 2.81 0.095 3.79 0.050 3.18 0.107 3.33 0.064 2.94 0.095 3.63 0.058 3.54 0.060 3.32 0.105 3. 70 0. 047 4. 65 0. 025 4. 24 0. 034 4. 19 0. 034 3. 84 0. 047 4. 86 0. 024 4. 32 0. 035 4. 35 0. 033
The specified, or "expected", endpoint variation is normalized to a 4% error rate [16], and is calculated as
| SDx = ω / 4.1333. | (12) |
As for the observed participant behavior, there was a consistent discrepancy between the difficulty of the task specified and the difficulty of the task performed. For all conditions, IDe > ID. This is a natural consequence of participants focusing on accuracy and achieving low error rates. With a low error rate, participants' endpoint variation was lower than the variation expected for a nominal 4% error rate. This tends to push IDe up, as seen in Table 3.
4.5 Fitts' Law Linear Regression
By averaging the eight sequence conditions separately over all the participants, a linear regression model was created for each input method. The models are shown in Fig. 12 in the plots of movement time vs. IDe.
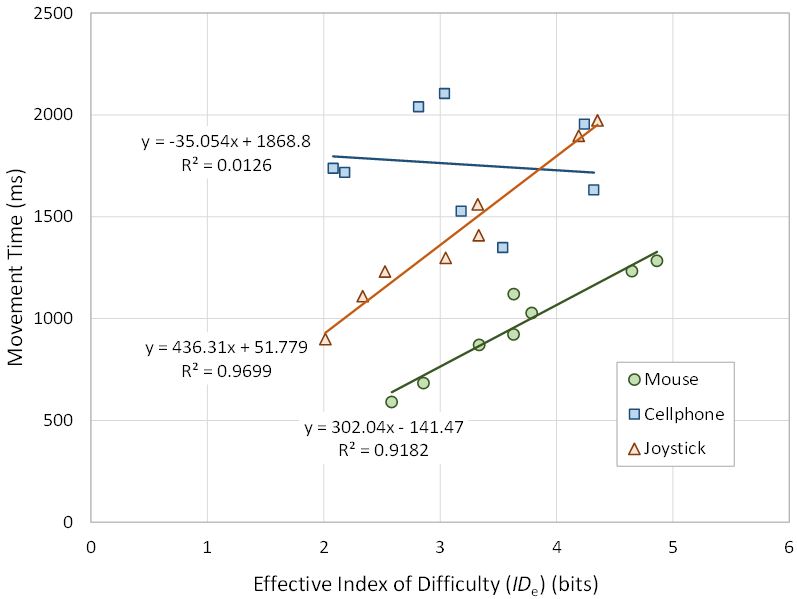
Fig. 12. Movement time (ms) vs. effective index of difficulty (bits) with regression models.
For both the mouse and joystick conditions, the linear regression model fits the data well (R2 > .9), indicating that both conform to Fitts' law. Furthermore, the intercepts are relatively small, within the range outlined by Soukoreff and MacKenzie [16].
These results, along with the resemblance of the 3D rotation throughput to 2D target selection throughput in other work, validate the methodology and task design. The 3D rotation task can be representative of how a device with two DOF might perform in the 2D ISO 9241-9 task. However, there is no overlooking the exceptionally poor fit of the mobile phone data to the regression model (R2 = .0126). The effective index of difficulty for the mobile phone condition had no apparent impact on the movement time. There are a couple of explanations.
First, the mobile phone condition was not performed single-handed for this task, as originally expected. In many cases, participants had to use both hands to manipulate the mobile phone, taking their second hand from the ENTER key. This doubly impacted homing time, since time was spent moving from the ENTER key both before and after movement to the target.
Reaction time was also not properly eliminated in the mobile phone condition. A negligible dead zone was created at the start of each trial, inside which the movement timer would not start. For the mouse and joystick conditions, this effectively removed reaction time because the dead zone was never left before the participant purposely moved the cursor. However, because the mobile phone operated in position-control and is inherently affected by noise in the magnetic sensor, it frequently triggered a false start, causing the system to record reaction time as well.
4.6 Qualitative Results
Participants provided their impressions on the input methods at the end of the experiment. On a 7-point Likert scale, they were asked to rate how well they thought each input method was implemented (1 = not well, 7 = very well). The results are seen in Fig. 13. From best to worst, the results favored the mouse (6.8), then the joystick (6.1), then the mobile phone (4.2). A Friedman non-parametric test deemed the differences statistically significant (χ2 = 20.4, df = 2, p < .0001). All pairwise differences were also significant, as indicated by Conover's F (p < .05). The mobile phone rating is quite poor compared to the mouse and joystick ratings.
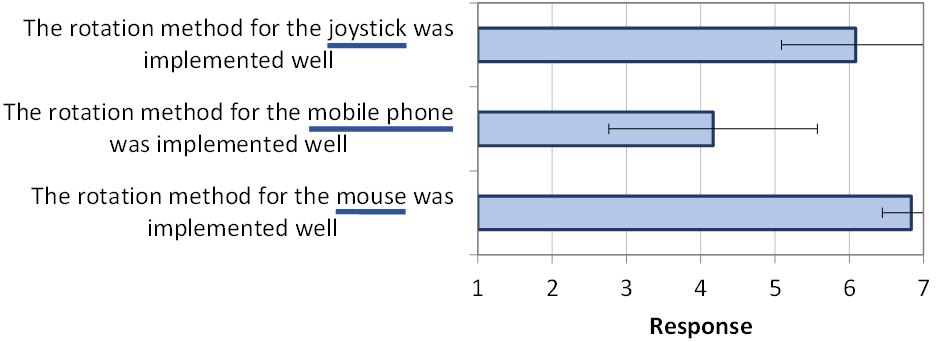
Fig. 13. Seven-point Likert-scale responses on participants' impressions on the implementation of each input method. Higher scores are better. Error bars show ±1 SD.
Clearly, there is room for improvement in the mobile phone interaction. Many participants also described the mobile phone condition as fatiguing, possibly negatively impacting their performance. One participant commented on arm pain when using the mobile phone condition. Another noted, "I had to mind [the] spatial mapping between several things: what I see, hand movements (and its limit), [the] phone, [and the] phone's shape."
5 Conclusion
A novel task for testing two- and three-DOF devices was designed and evaluated. The task used throughput as a performance measure and was intended to support the comparison of two-DOF devices used for 2D selection tasks with higher-DOF devices used for 3D rotation tasks.
The throughput for the mouse and joystick and the corresponding linear Fitts' law equations demonstrate that, with proper control-display mapping, a two-DOF device performs just as well in a 3D rotation task as it does in a 2D target-selection task. The mobile phone accelerometer, however, did not work well, producing a low value of throughput, a poor Fitts' law model, and an overall negative impression on participants.
6 Future Work
Though the 3D rotation task performed favorably for the standard two DOF inputs, it requires more testing and validation for three DOF inputs. Homing time can be further reduced by introducing a method of rotation confirmation that does not require a free hand, such as a foot pedal or button on each input method. Reaction time can be reduced by implementing a larger dead zone, and then adjusting for its impact on effective amplitude.
References
1. Bérard, F., Ip, F., Benovoy, M., El-Shimy, E., Blum, J. R., Cooperstock, J. R.: Did "Minority Report" get it wrong? Superiority of the mouse over 3D input devices in a 3D placement task, In: Proceedings of INTERACT 2009, pp. 400-414. Springer, London (2009). https://doi.org/10.1007/978-3-642-03658-3_45
2. Chen, M., Mountford, S. J., Sellen, A.: A study in interactive 3-D rotation using 2-D control devices, Computer Graphics, 22, 121-129 (1988). https://doi.org/10.1145/54852.378497
3. Fitts, P. M.: The information capacity of the human motor system in controlling the amplitude of movement, Journal of Experimental Psychology, 47, 381-391 (1954). https://psycnet.apa.org/doi/10.1037/h0055392
4. Henrysson, A., Billinghurst, M., Ollila, M.: Virtual object manipulation using a mobile phone, In: Proceedings of the International Conference on Augmented Tele-Existence - ICAT 2005, pp. ACM, New York (2005). Henrysson, A., Billinghurst, M., Ollila, M.: Virtual object manipulation using a mobile phone
5. Hinckley, K., Pausch, R., Goble, J. C., Kassell, N. F.: A survey of design issues in spatial input, In: Proceedings of the ACM Symposium on User Interface Software and Technology - UIST '94, pp. 213-222. ACM, New York (1994). https://doi.org/10.1145/192426.192501
6. Hinckley, K., Tullio, J., Pausch, R., Proffitt, D., Kassell, N.: Usability analysis of 3D rotation techniques, In: Proceedings of the ACM Symposium on User Interface Software and Technology - UIST '97, pp. 1-10. ACM, New York (1997). https://dl.acm.org/doi/pdf/10.1145/263407.263408
7. ISO: Ergonomic requirements for office work with visual display terminals (VDTs) - part 9: Requirements for non-keyboard input devices (ISO 9241-9), International Organisation for Standardisation Report Number ISO /TC 159/SC4/WG3 N147 (2000). https://www.iso.org/standard/30030.html
8. ISO: Evaluation methods for the design of physical input devices - ISO /TC 9241-411: 2012(e), International Organisation for Standardisation Report Number ISO /TS 9241-411:2102(E) (2012). https://www.iso.org/standard/54106.html
9. MacKenzie, I. S.: Human-computer interaction: An empirical research perspective. Waltham, MA: Morgan Kaufmann (2013). https://www.yorku.ca/mack/HCIbook2e/
10. MacKenzie, I. S., Isokoski, P.: Fitts' throughput and the speed-accuracy tradeoff, In: Proceedings of the ACM SIGCHI Conference on Human Factors in Computing Systems - CHI 2008, pp. 1633-1636. ACM, New York (2008). https://doi.org/10.1145/1357054.1357308
11. MacKenzie, I. S., Kauppinen, T., Silfverberg, M.: Accuracy measures for evaluating computer pointing devices, In: Proceedings of the ACM SIGCHI Conference on Human Factors in Computing Systems - CHI 2001, pp. 119-126. ACM, New York (2001). https://doi.org/10.1145/365024.365028
12. MacKenzie, I. S., Ware, C.: Lag as a determinant of human performance in interactive systems, In: Proceedings of the INTERACT '93 and CHI '93 Conference on Human Factors in Computing Systems - INTERCHI '93, pp. 488-493. ACM, New York (1993). https://doi.org/10.1145/169059.169431
13. Meyer, D. E., Abrams, R. A., Kornblum, S., Wright, C. E., Smith, J. E. K.: Optimality in human motor performance: Ideal control of rapid aimed movements, Psychological Review, 95, 340-370 (1988). https://psycnet.apa.org/buy/1988-31551-001
14. Natapov, D., MacKenzie, I. S.: The trackball controller, In: Proceedings of the International Academic Conference on the Future of Game Design and Technology - Futureplay 2010, pp. 167-174. ACM, New York (2010). https://doi.org/10.1145/1920778.1920803
15. Ortega, F. R., Abyarjoo, F., Barreto, A., Rishe, N., Adjouadi, M.: Interaction design for 3D user interfaces: The world of modern input devices. CRC Press, New York (2016). https://doi.org/10.1201/b19563
16. Soukoreff, R. W., MacKenzie, I. S.: Towards a standard for pointing device evaluation: Perspectives on 27 years of Fitts' law research in HCI, International Journal of Human-Computer Studies, 61, 751-789 (2004). https://doi.org/10.1016/j.ijhcs.2004.09.001
17. Stoelen, M. F., Akin, D. L.: Assessment of Fitts' law for quantifying combined rotational and translational movements, Human Factors, 52, 63-77 (2010). https://doi.org/10.1177/0018720810366560
18. Teather, R. J., Stuerzlinger, W.: Pointing at 3D targets in a stereo head-tracked virtual environment, In: Proceedings of the IEEE Symposium on 3D User Interfaces - 3DUI 2011, pp. 87-94. ACM, New York (2011). https://doi.org/10.1109/3DUI.2011.5759222
19. Teather, R. J., Stuerzlinger, W., Pavlovych, A.: FishTank Fitts: A desktop VR testbed for evaluating 3D pointing techniques, In: Proceedings of the Extended Abstracts of the ACM SIGCHI Conference on Human Factors in Computing Systems - CHI 2014, pp. 519-522. ACM, New York (2014). https://doi.org/10.1145/2559206.2574810
20. Wobbrock, J. O., Myers, B. A.: The performance of hand postures in front- and back-of-device interaction for mobile computing, International Journal of Human-Computer Studies, 66, 857-875 (2008). https://doi.org/10.1016/j.ijhcs.2008.03.004
21. Young, T. S., Teather, R. J., MacKenzie, I. S.: An arm-mounted inertial controller for 6DOF input: Design and evaluation, In: Proceedings of the IEEE Symposium on 3D User Interfaces - 3DUI 2017, pp. 26-35. IEEE, New York (2017). https://doi.org/10.1109/3DUI.2017.7893314
22. Zhai, S., Milgram, P.: Quantifying coordination in multiple DOF movement and its application to evaluating 6 DOF input devices, In: Proceedings of the ACM SIGCHI Conference on Human Factors in Computing Systems - CHI '98, pp. 320-327. ACM, New York (1998). https://dl.acm.org/doi/pdf/10.1145/274644.274689
-----
Footnotes:
1. The standard was updated in 2012 as ISO 9241-411 [8]. With respect to performance evaluation, the two versions are the same.
2. The FittsTaskTwo software download and API are found at http://www.yorku.ca/mack/FittsLawSoftware/
4. https://github com/mrdoob/three.js/
5. Available as a free download at http://www.yorku.ca/mack/HCIbook/
6. Prior studies have used three standard deviations away from the mean as recommended by Soukoreff and MacKenzie [16], but like in the work of Wobbrock et al. [20], not all of the outliers were excluded under this criteria.