Sister Watersheds Research Project
Capacity Building in Civil Society for Watershed Management
About the Watersheds
The Bacias Irmãs project (the Sister Watersheds project) was based on action research in two sub-watersheds of the Tietê and Paraná Rivers where University of São Paulo campuses are located - the Pirajussara watershed in São Paulo and the Piracicamirim (PISCA) watershed in Piracicaba - as well as the Black Creek watershed in Toronto, a sub-watershed of the Humber River, where York University is located. The following sections provide an overview of each watershed.
Piracicamirim (PISCA) Sub-Basin
History
The landscape of the Piracicamirim sub-watershed has changed dramatically since 1850. The discovery of deep fertile soil brought on the introduction of plantation coffee growing. During the 1850's, through to the 1900s, coffee became the main resource in the area and deforestation of the natural vegetation was an inevitable consequence.
The end of the 19th century marked the first settlement in the Piracicaba area. Mills for sugar cane processing were built and processing became the main activity in the area. Sugar cane enabled economic development to take place and required land for economic expansion. Both sugar cane and coffee shared in economic importance during the second half of the 19th century. In the Piracicamirim sub-watershed sugar cane cultivation only began in the 1920's after WW1 halted production of the European sugar industry. Sugar prices in the international market were good, which led to a cultural change and creating a homogenous sugar cane community in the watershed that is still predominant today.
In 1910, the district of Piracicaba began its first phase of industrialization. The sugar and alcohol mills resulted in the formation of other industrial businesses, with the first metal work industries of the area supplying equipment and parts to the mills. During WW2, industrialization and urbanization soared in the city. The Import Substitution Policy of the postwar period encouraged regional economic diversification. During the 70's, the pro-alcohol program drove growth in the mills and distilleries that had a history in the area and brought about a change from sugar production. However, the Piracicamirim sub-watershed preserved its agricultural character by maintaining immense areas for sugar cane cultivation.
Soon after, pressure for further industrialization began when in 1985, the Piracicaba municipal district prepared a Master Plan for Piracicaba Development (PDDP) to regulate the use of urban land. This plan designated two directions for urban growth: northwest and southeast. The southwest region corresponded with the final section of the Piracicamirim stream sub-watershed and was designated as favorable to urban expansion due to its level topography. In the 1980's an intense urbanization phase began in the sub-watershed mouth with the transformation of residential and industrial divisions into lots. Work was undertaken to straighten the Piracicamirim during this period.
The urban centers of Rio das Pedras and Saltinho became official municipal districts in the years 1894 and 1991. Located in the area of the watershed recharge, these municipal districts house the main tributaries of the Piracicamirim. The area surrounding the Joaquim Bento (Rio das Pedras), Campestre and Saltinho streams are leased as small properties for sugar cane cultivation.
In the period between 1962 and 1995, the agricultural land area of the sub-watershed was reduced by nine fold, and agricultural areas with annual crops were reduced by six. This suggests that small subsistence properties might have been incorporated into sugar cane production areas belonging to sugar-alcohol plants. This resulted in the decline of the sub-watershed rural community, the loss of land and income, and the reduction of per capita food production.
Migration of the rural and indigenous populations of the sub-watershed resulted in a change in the environment and a loss of identity and cultural heritage. In addition, problems developed with the formation of slums, insufficient housing, increased threat to public health, education and transportation infrastructures, and further degradation of life and the environment with worsening urban growth.
With regard to water pollution in 1985, the Piracicamirim stream was considered the most polluted tributary of the Piracicaba River. Today, the situation has changed since the construction in 1997 of the Piracicamirim Sewer Treatment Station (ETE - Piracicamirim) which made progress toward the elimination of pollution in the stream. The major sources of pollution are sewer releases and chemical products from sugar cane plantations.
Even at current pollution levels, a strong historical bond still exists between the local population and the Piracicamirim stream. They continue to use the stream as a source of food and leisure, and there have been requests from neighborhoods regarding the recovery of floodplain vegetation, the clean-up of pollution, the creation of green (protected) areas, the improvement of general housing conditions and the quality of life within the neighboring communities.
The mouth of the Piracicamirim stream is located on the campus of the Luiz of Queiroz Agricultural School (ESALQ); university researchers monitor aquatic factors in the stream, contribute specialized human resources, and involve the university with local watershed issues.
Location of the Piracicamirim Stream Watershed
The State of São Paulo is divided into twenty-two water resource management areas, administered through Watershed Committees, which serve as advisory members of the SIGRH - the Integrated Water Resources Management System. Watershed committees are participatory and allow water management to be integrated with other natural resources, giving attention to both qualitative and quantitative factors. The watershed is the physical unit for planning and management of water resources.
The Piracicaba, Capivari, and Jundiaí Watershed Committee promotes a decentralized approach to the administration of water resources within its operational area. These three watersheds occupy an area of 15 320 square km. 4.5 million people live in the 59 municipal districts of the State of São Paulo and the 4 counties located within the State of Minas Gerais which make up the watershed. The area accounts for more than 7 percent of Brazil's GDP and it is the second largest industrialized area within Brazil.
These watersheds occupy an area of 15 320 km2. 4.5 million people live in the 59 municipal districts of the State of Sao Paulo and the 4 counties located within the State of Minas Gerais. The area accounts for more than 7 percent of the Brazilian GDP and it is the second largest industrialized area within Brazil.
The Piracicaba River travels 370 km and 1,400 meters in elevation from its headwaters on the Mantiqueira Ridge in the State of Minas Gerais to its mouth where it enters the Tietê River at the Barra Bonita Reservoir.
The sub-watershed of the Piracicamirim stream, the object of our study and intervention, is a tributary of the Piracicaba River. It occupies a drainage area of 133 km2, includes part of the municipal districts of Piracicaba, Saltinho, and Rio das Pedras, and is home to a population of approximately 95,000 people.
The sub-watershed of the Piracicamirim stream, the object of our study and intervention, is a tributary of the Piracicaba River. It occupies a drainage area of 133. km2, and it includes part of the municipal districts of the Piracicaba, Saltinho, and Rio das Pedras (SP) and is home to a population of approximately 95, 000 people.
The Piracicamirim is the largest urban sub-watershed of the Piracicaba. The population is predominantly concentrated within the urban areas of the watershed which make up 9% of the watershed's total area. The municipal district with the largest urban area, population and demographic density in the watershed area is the city of Piracicaba.
Sugar cane production occupies more than 60% of the land use in the watershed. In Piracicaba the importance of cane cultivation and agribusiness is unquestionable; industry, tourism and trading also contribute to municipal economic activity. It is important to emphasize the seasonal nature of employment involved in sugar cane production as well as the social implications. A large portion of rural workers needed for this type of labour come from other municipal districts and other areas within the country. They are only hired during the harvest. They are housed in precarious accommodations, suffer from unsafe transportation, and work in conditions that are risky and expose them to accidents.
A factor that positively influences the watershed area is the presence of two universities, the Methodist University of Piracicaba and the Luiz Queiroz Agriculture School (ESALQ). These institutions employ many professionals who are recognized for their expertise in the diverse fields of the environment, socio-cultural studies, and agricultural disciplines.
Municipal Demographic Data Saltinho, Rio das Pedras e Piracicaba (2000)
| Saltinho | Rio das Pedras | Piracicaba | |
| Municipal district area | 98,94 km2 | 226,92 km2 | 1.368,37 km2 |
|---|---|---|---|
| Total population (inhabitants) | 5.775 | 23.441 | 328.312 |
| Domiciles - Urban Area | 1.462 | 6.324 | 104.850 |
| Men | 2.915 | 11.948 | 162.038 |
| Women | 2.860 | 11.493 | 166.274 |
| Urban population | 4.804 | 21.905 | 316.518 |
| Rural population | 971 | 1.536 | 11.794 |
| Domiciles - Rural Area | 409 | 600 | 5.460 |
|
Resident Population 1991 (inhabitants) |
5.076 | 19.104 | 278.714 |
|
Resident Population 1996 (inhabitants) |
5.261 | 22.265 | 302.886 |
Source: IBGE, Preliminary synopsis of the 2000 Demographic Census, Municipal Digital Net of Brazil, 1997.
Municipal Demographic Data Saltinho, Rio das Pedras e Piracicaba (2004)
| Saltinho | Rio das Pedras | Piracicaba | |
| Geometric rates of annual population growth from 2000 to 2004 (in % p.a.) | 1,45 | 1,92 | 1,65 |
|---|---|---|---|
| Total Population (inhabitants) | 6.136 | 25.301 | 350.915 |
| Urbanization rate (%) | 85,22 | 94,40 | 96,91 |
| Urban Population (inhabitants) | 5.229 | 23.885 | 340.076 |
| Rural Population (inhabitants) | 907 | 1.416 | 10.839 |
Source: SEADE (São Paulo State Data Analysis System Foundation).
Municipal Data - Life Standard (2000)
| Saltinho | Rio das Pedras | Piracicaba | Estado | |
| IPRS (São Paulo State Social Responsibility Index): | Wealth | 51 | 50 | 59 | 60 |
|---|---|---|---|---|
| Life Expectancy | 69 | 69 | 65 | 65 |
| Education | 95 | 91 | 88 | 87 |
| IDHM (São Paulo State Human Development Index): | 0,851 | 0,791 | 0,836 | 0,814 |
Source: SEADE (São Paulo State Data Analysis System Foundation)
Municipal Data - Public finance (2000, 2001, 2002)
| Tax collection per capita | Saltinho | Rio das Pedras | Piracicaba | Estado |
| ICMS (in 2002 Reais) | 132,27 | 414,91 | 939,21 | 939,21 |
|---|---|---|---|---|
| IPTU (in 2001 Reais) | 39,44 | 23,26 | 50,82 | - |
| ISS (in 2001 Reais) | 29,48 | 21,02 | 61 | - |
| Total added value (in 2002 Reais) | 42.379.478 | 318.378.056 | 3.097.488.134 | 309.497.504.387 |
| Contribution to the State | 0,01369 | 0,010287 | 1,00081 | 100 |
| Per capta added value (in 2002 Reais) | 7.109,46 | 13.071,85 | 9.121,10 | 8.118,25 |
| Total municipal income per capita (in 2001 Reais) | 874,05 | 801,29 | 749,78 | - |
| ICMS quota per capita (in 2002 Reais) | 253,01 | 281,86 | 214,32 | - |
| FMP quota per capta (in Reais 2001) | 265,11 | 141,02 | 37,78 | - |
| Rate of participation in ICMS (%) | 0,01778953 | 0,07874303 | 0,87888718 | 100 |
Source: São Paulo State Data Analysis System Foundation - SEADE
Municipal Data - Labor and Income (2000)
| Saltinho | Rio das Pedras | Piracicaba | Estado | |
| Responsible Persons for Domiciles with Income up to minimal wage salary (In %) | 0,06 | 0,26 | 0,20 | 0,37 |
|---|---|---|---|---|
| Responsible Persons for Domiciles with Income between more than 1/2 and 01 minimal wage salary (In %) | 6,67 | 7,87 | 6,58 | 9,31 |
| Responsible Persons for Domiciles with Income between more than 01 and 02 minimal wage salary (In %) | 11,73 | 16,99 | 12,39 | 14,76 |
| Responsible Persons for Domiciles with Income between more than 02 and 03 minimal wage salary (In %) | 15,37 | 18,22 | 12,94 | 13,58 |
| Responsible Persons for Domiciles with Income between more than 03 and 05 minimal wage salary (In %) | 25,56 | 23,72 | 21,80 | 18,98 |
| Responsible Persons for Domiciles with Income between more than 05 and 10 minimal wage salary (In %) | 27,96 | 18,87 | 24,62 | 19,77 |
| Responsible Persons for Domiciles with Income larger than 10 minimal wage salary (In %) | 10,74 | 7,56 | 16,08 | 14,30 |
| Responsible Persons for Domiciles without Income. (In %) | 1,91 | 6,51 | 5,38 | 8,94 |
| Responsible Persons for Domiciles without State of Income. (In %) | - | - | - | - |
| Average Income of Responsible Persons for Domiciles (in July/2000 Reais) | 902,66 | 749,05 | 1.114,52 | 1.076,21 |
Source: São Paulo State Data Analysis System Foundation - SEADE
Municipal Data - Health and Sanitation (2000/2002)
| Saltinho | Rio das Pedras | Piracicaba | Estado | Health |
|---|---|---|---|---|
| Physical resources | ||||
| Leitos SUS (2002) | - | 55 | 288 | 77.629 |
| SUS Hospital Beds (2002) | - | 2,26 | 0,85 | 2,04 |
| Sanitation | ||||
| Water Supply - Service Level (In %, 2000) | 97,34 | 99,04 | 99,38 | 97,38 |
| Sewage - Service Level (In %, 2000) | 96,45 | 98,01 | 96,85 | 85,72 |
| Garbage picking - Service Level (In %, 2000) | 98,67 | 98,97 | 99,57 | 98,90 |
Source: São Paulo State Data Analysis System Foundation - SEADE
Municipal Data - Education (2001/2002)
| Saltinho | Rio das Pedras | Piracicaba | Estado | |
| Illiteracy rate of population with, or over, 15 year-old (In %,2000) | 4,22 | 8,52 | 5,05 | 6,64 |
|---|---|---|---|---|
| Initial Registration in kindergarten | ||||
| State Net (2001) | - | - | - | 143 |
| Municipal Net (2001) | 209 | 658 | 5.712 | 1.073.281 |
| Private Net (2001) | - | 17 | 3.702 | 252.298 |
| Total (2001) | 209 | 675 | 9.414 | 1.325.949 |
| Initial registration in Fundamental School | ||||
| State Net (2001) | 444 | 1.335 | 33.949 | 3.108.410 |
| Municipal Net (2001) | 457 | 2.305 | 6.551 | 2.012.287 |
| Private Net (2001) | - | 88 | 8.126 | 777.712 |
| Total (2001) | 901 | 3.728 | 48.626 | 5.898.603 |
| Initial Registration in High-School | ||||
| Public Net (2001) | 379 | 1.127 | 14.317 | 1.828.333 |
| Private Net (2001) | - | - | 3.238 | 272.490 |
| Total (2001) | 379 | 1.127 | 17.555 | 2.100.823 |
| Initial Registration in High-School | ||||
| Federal Net (2002) | - | - | - | 8.102 |
| State Net (2002) | - | - | 1.962 | 92.029 |
| Municipal Net (2002) | - | - | 1.687 | 53.301 |
| Private Net (2002) | - | - | 330 | 550.191 |
| Community /Religious / Philanthropy Net | - | - | 9.935 | 285.073 |
| Total | - | - | 13.914 | 2.100.823 |
Source: São Paulo State Data Analysis System Foundation - SEADE
Participation Overview
An Overview of the Participation of the Pisca Watershed Community in Water Resources Administration
The activities that were carried out by the Pisca Watershed Team during the months of March through to June 2004 were concentrated on research and the strengthening of the project's methodology, establishing partnerships, performing actions throughout the Pisca Watershed, and creating collaborative plans for the participation of actors in the priority areas outlined by the Pisca Project (Saltinho, Rio das Pedras, Urban Pisca, and the Pisca mouth).
The Pisca Project is an extension of the ESALQ/USP Department of Forestry Sciences that works as an interdisciplinary program. It seeks to promote synergy between people and institutions that are searching to turn the Pisca watershed into a model of social and environmental sustainability integrating both rural and urban environments. Since its inception in 2001, the project has been characterized as an open space for dialogue among teachers and researchers and has attracted increased participation from undergraduate and graduate students in various disciplinary programs. The Pisca Program calls for the involvement of partners, watershed residents and other participants as well as the dissemination of its results.
The Pisca Project is organized through a management committee responsible for the formation, discussion, and implementation of proposals. The committee is made up of project representatives and partners focusing on four areas within the Pisca Watershed. They include:
- Saltinho: Micro-watersheds of Saltinho and Campestre streams
- Rio das Pedras: Micro-watersheds of Joaquim Bento and Palmeiras streams
- Pisca Urbano: The urban section of the Piracicamirim stream and its tributaries
- Foz do Pisca: The meeting area between the Piracicamirim stream and the Piracicaba River on the ESALQ campus
The Pisca Project deals specifically with the Piracicamirim sub-watershed located in the three counties of Piracicaba, Saltinho, and Rio das Pedras. The "Pisca Watershed Association" was formed to develop and support initiatives that aim for environmental recovery, informed citizenship, and participation of institutions and groups to perform actions focused on the local population, using biodiversity as a key concept to plan activities intended to achieve sustainable development within the sub-watershed. The use of conservation actions as an educational instrument stimulates each person to feel responsible and capable of transforming her/his own reality. Other activities include: field visits within the watershed, partnership formation, and network creation.
The operations and guidelines put forth by the management committee of the Pisca Project for the coming years are:
- Mobilization of Action in the Watershed: To invite and stimulate the many people within the watershed to participate in citizenship building exercises in creating and implementing proposals and also to discuss experiences.
- Create and Implement Courses dealing with Social-Environments: These courses will provide instruments to the people within the watershed to participate in their realities in a conscious and active way.
- Communication and Network Strengthening: To promote evaluation processes, system building and discussion of the many issues identified in the watershed.
- Promotion of Aquatic Health of the Watershed: To engage in the monitoring of water quantity and quality, local production of seedlings in nurseries, restoration of bordering forests and the conscious use of water.
- Institutional Management: This includes the management of financial resources, creating and maintaining partnerships, and managing actions along the watershed.
In 2004, a series of partnership activities occured. One of the activities included a publication to document the results of forest restoration activities for the whole watershed community along with spring restoration, environmental education and social mobilization. This document provides a visual overview of the whole watershed for the public and private entities working in the area. Finally, it suggests future possibilities. In the final week of November, Pisca Week takes place. The week is comprised of debates, courses and workshops, as well as intense cultural activities covering some of the major objectives and guidelines drawn up by the project.
Pirajussara Basin
History
The Pirajussara Watershed has 1.2 million inhabitants and its main problem is periodic flooding of its watercourse and its tributaries, such as the Poá and Joaquim Cachoeira Streams. In order to begin a restorative process, we first sought out a doctoral thesis entitled Integrated systematic for flood control in urban sub-watershed - A case study: The watershed of the Pirajussara stream under the focus of works integration together with education actions and environmental perception, by Maria de Sampaio Bonafé Owstrosky, who collected a series of reports, from state and local newspapers, on the Pirajussara Watershed since the 1950's. These reports bring us much closer to understanding the history of the flooding, and of people's relationship to the watershed, than any other statistic on the watershed that could be used and/or explored. In this sense, and this will certainly be deepened in the course of the project, we noticed a very strong relationship between the Pirajussara watershed and its perception as problematic for the nearby population, mainly due to the apparent lack of land use planning in the occupation process (that still prevails in the few areas where the watershed includes vegetation remnants from the Atlantic forest), or, in its Embú spring, where it is presently totally occupied by settlement.
The Fifties and Sixties
By the 1950's and 60's, the first flooding threats of the Pirajussara Stream were apparent, mainly at the mouth of the stream (the Butantã neighborhood, where the Pirajussara enters the Pinheiros River). According to professor Kokei Uehara of the USP/Polythecnic Institute, a long time resident in Butantã and a relevant player in the process of popular mobilization of the watershed, the floods reached all the way to the residences of the USP students, who stayed in the college premises during floods, with no possibility of returning to their homes. In 1969 paving of 137 streets in the Pinheiros neighborhood began, sealing important receptacles of underground water in the watershed. At this time it was already said that the solution for flooding was the canalization and straightening of existing waterways.
The Seventies
"The Pirajussara Stream is winning the battle against the city hall, whenever it rains the scene repeats itself, the stream overflows and water threats the houses nearby..." 01/09/76 (source: Pinheiros Gazette)
"The peace that vanished today gave place to distress and fear because the Pirajussara Stream has suffered so many and such large transformations along the years that is now a fearsome enemy." 07/28/79 (source: Pinheiros Gazette)
In the face of river overflows that were already a problem for the people in flood-plain areas - mainly in Butantã and University City - the focus in the seventies was toward popular mobilization processes that put pressure on authorities for infrastructure to be built in the area aiming to decrease or eradicate floods. The Association of Butantã Residents, founded in 1966 by the neighborhood residents, among which was Prof. Kokei Uehara, was the start of popular participation in the area. In the 1960's, requests concentrated on structural works, such as installation of water, sewer, and drainage nets, as well as paving and illumination. In the 1970's, however, emphasis was on canalization works and stream confinement, which were seen as a definitive solution for the flooding problems, in spite of the fact that, since those days, the stream suffered degradation due to erosion and heavy garbage and illegal dumping in its bed.
Before these pressures began, in the beginning of the 70's, the Pirajussara was channeled, and in 1976, channeling proposals extended to Taboão da Serra. In 1979 a new gallery was built in the stream's final section, to the displeasure of the community. This put the community in contact with the whole problem of the stream for the first time: "With the stream narrowing it is impossible for it not to overflow" said a headline in 03/09/79. At the same time, development of the hillsides, with low-standard and self-built constructions, continued to occur, which were to cause further problems in the region.
The Eighties
With the end of canalization works, everything suggested that flooding would calm down and even experience incremental improvements, at the beginning of the 1980's. However, progress was soon reverted, considering that the flooding problem's solution did not yet consider the whole watershed as a system. This happened with the periodic canalization work of the stream section, mainly downstream, ignoring a overall drainage planning of the watershed, and causing floods to increase with time in spite of the investment made in works.
In 1984 there was a change in public authorities rhetoric and in popular pressure, with officials still pointing at short-term solutions, but abandoning promises of final solutions, and neglecting to connect to a planning process of treating the watershed as a whole. Meanwhile, lack of maintenance and garbage spilling continued to affect the canalization which already existed.
From the Nineties to the Present
The 90's were marked by a wave of strong floods in the upstream area of the stream, particularly in São Paulo neighborhoods that border Taboão da Serra near the stream's headwaters. In 1996, a great flood occurred, of catastrophic consequences, which led to the creation of the Residents' Commission for Pirajussara and Fighting Poà Floods, a civil society organization created to reinforce popular pressure for measures and works concerning the flooding problem.
The Residents' Commission had many successes, and through them 5 "giant pools" were built for flood water retention, which produced a significant drop in flooding and in the size of the area affected by flooding. However, 70% of the watershed area still is impermeable; the remaining section being a narrow strip of the north slope of the Poà Stream, which still has some extensions of denser vegetation, plus some select areas with vegetation along the watershed. Another factor that continued to devastate the Pirajussara is irregular occupation of headwaters, as well as garbage and sewer spilling, mainly in Taboão da Serra and Embú. These factors will eventually bring more problems to the watershed and to the nearby population.
This report on the Pirajussara Watershed highlights its history of existing as a problem neglected by state and public organizations, in which neither took responsibility for urban problems. Historically the stream was always seen as the ugly backyard of the city, where garbage is spilled, which is, unfortunately, a characteristic of São Paulo in relation to its rivers and watersheds. Elsewhere in Brazil and in the world, a river crossing a metropolis can be a leisure area, where people meet to practice sports along tree-lined shores, a condition that does not occur in São Paulo, where rivers serve as sewer and garbage deposits.
This short report exposes the estranged relationship of carelessness and antipathy among local residents, the public authorities, and the Pirajussara Stream, which is generally seen more as a villain than as a source of water and, therefore, of life.
This participative diagnosis provides insight into the understanding of the Watershed, mainly in its relation to the bordering population. We shall certainly deepen this short historic account of the watershed during a participative diagnosis of the area.
Localization
The Watershed of the Pirajussara Stream, a tributary of the Pinheiros River Lower Channel, is situated in the State of São Paulo, in the west sector of the Great São Paulo Metropolitan Area, as shown:
Covering an area of 73.1 km2, the watershed falls under the political-administrative municipal districts of São Paulo, Embú and Taboão da Serra, according to the proportions given below:
Source: "Zero Erosion" Report, IPT, 2004
| County | % of the area in the basin | Localization | Sub-committee or area |
| Embú | 10,3 km2 | North outpouring of the basin | Cotia-Guarapiranga |
|---|---|---|---|
| Taboão da Serra | 20,0 km2 | Southwest outpouring of the basin | Penha-Pinheiros |
| São Paulo | 40,6 km2 | from headwaters to Poá Streram mouth Penha-Pinheiros | Penha-Pinheiros |
The political-administrative division of the Pirajussara watershed. (Source: Technical Report of the Pirajussara Watershed - DAEE).
Regarding the Integrated System of Watershed Resources, the Pirajussara Stream Watershed is in one of 22 watersheds of the State of São Paulo, being part of the Upper Tietê Watershed Watershed.
The area of the Upper Tietê Watershed is almost identical to the one of the São Paulo Metropolitan Area, with 5,985 km2 and 34 municipal districts. The Tietê river begins in the Serra do Mar, 22 km from the Atlantic Ocean, but instead of running towards the sea, it flows inland through the state of São Paulo, crossing 1,150 km to the Paraná River, on the boundary of bordering state Mato Grosso do Sul. The watershed is only 2.7% of the São Paulo territory, but it is occupied by almost 50% of the state population and is the main source of water resources for the region of São Paulo. In 2001, the population of residents in the watershed was approximately 17.5 million people, 60% of which lived in the municipal district of São Paulo.
Watershed of the Upper Tietê (Source: www.comiteat.sp.gov.br as of May/2004)
The watershed consumes much more water than it produces. Of the 63.1 m3/s used for public provisioning, 31 m3/s are imported from the Piracicaba river watershed and 2m3/s come from the Capivari and Guaratuba rivers, with total losses calculated at 31.5%. Irrigation uses 2.6 m3/s, while the water demand of industrial activities is supplemented by the public sources, since many of the industrial companies use underground water through their own private water intake.
During its first eight years of existence, the watershed committee has developed four basic tasks: capacity development to analyze and define priorities and goals for the watershed, creation of the tools to achieve these goals, the promotion of collaboration and integration of efforts of the governments, participants, and the public in understanding the situation of water resources in the watershed, and the possibilities of managing them. The committee has concentrated on three categories: its own operation, the creation of sub-committees and Technical Chambers, and the growth of plans, programs, and financial resource allocation. Funds from FEHIDRO - The State Fund for Water Resources- are derived from royalties paid by hydroelectric power plants. These resources are to be reinforced with levies collected from water use, once this program is implemented. The FEHIDRO resources are divided between major projects of interest to the whole watershed (1/3) and equitably among the five Sub-Committees (2/3).
The Committee of the Upper Tietê Watershed committee was created in 1994. Since 1997, it extended its structure, creating five sub-committees: Cotia-Guarapiranga (1997), with 33 members; Juqueri-Cantareira (1997), with 21 members; Billings-Tamanduateí (1997), with 24 members; Pinheiros-Pirapora (1998), with 27 members and the Tietê-Headwaters with 39 members. Besides the 5 sub-committees, the Upper Tietê watershed committee also has an area, the Penha-Pinheiros area, an end location of much of the water of the Pirajussara Watershed:
Upper Tietê Watershed and its sub-committees
The "Penha-Pinheiros" Region mentioned above does not have its own sub-committee, and, according to the 2002 Watershed Watershed Plan for the Upper Tietê, its area is being incorporated by other sub-committees that inscribe it, as determined in the document transcribed below:
"(…) In the process of preparing the Watershed Plan some modifications were made regarding the division of sub-watersheds registered in the Zero Report. The main ones are: a) Incorporation of the districts of São Paulo county in the different sub-watersheds that outline the former "Penha-Pinheiros", which, by its turn almost incorporated all São Paulo districts, even in cases that visibly belonged to the area of influence of other sub-watersheds (…)"
This factor generates an intermediate situation for the Pirajussara Watershed regarding its representation before the Upper Tietê watershed committee, furthered by the fact that the incorporation mentioned above was not adopted by the sub-committees until now. The representation of the Pirajussara Watershed is still within the structure of the watershed committee, supported by sub-committees that surround it, especially, the Pinheiros-Pirapora (São Paulo region and Taboão da Serra), and, Cotia-Guarapiranga (from the Embú area).
General Characteristics
Data on Topsoil Use and Occupation
The Pirajussara River watershed is a region of quite diverse land uses, varying from clusters of restricted forests of the Poá stream watershed and other isolated forests of the Pirajussara river watershed, to urban areas with a high population density.
Data concerning top-soil use and occupation for this report were taken from the Technical Report of the Pirajussara Watershed prepared by the DAEE that updated the original information using digital data obtained in 1997 by the TM/Landsat satellite divided into the following classes: high-density urban area, low-density urban area and areas covered with vegetation.
As can be seen in the map, the stream sources are in areas with some growth but a generally low level of urbanization. In contrast, the areas that already experience high density are found in the municipal district of São Paulo, while industrial and commercial centres are found along the main roads and highways.
The vegetation shortage in the watershed is a result of the urban intensification process in Taboão da Serra and Embú Counties, as well as in the Capão Redondo and Campo Limpo counties, of the São Paulo district, where this is a major problem. Surveys carried out at the state and municipal level show that in the Pirajussara river watershed, there is almost no designation of any of these areas for preservation. Furthermore, the densely vegetated areas, found in the fountainheads of the Poá stream, are designated for industrial uses, according to Taboão county zoning.
The quantitative analysis of top-soil use in the watershed can be depicted in the following table:
| Classes | Areas - 1997 | % of Total Area |
| High-density urban area | 47,49 km2 | 65,96 |
|---|---|---|
| Low-density urban area | 16,74 km2 | 23,25 |
| Area with vegetation | 7,77 km2 | 10,79 |
| Total of urban areas | 64,23 km2 | 89,22 |
| Total of areas with vegetation | 7,77 km2 | 10,78 |
| Totals | 71,99 km2 | 100,00 |
Demographic and Socioeconomic Data
The Pirajussara watershed has a population of 1,141,455 inhabitants, distributed into districts in the following proportions:
| Counties | Population |
| Embú | 157.230 |
|---|---|
| Taboão da Serra | 210.895 |
| São Paulo | 773.330 |
| Counties | Population |
| Embú | 157.230 |
|---|---|
| Taboão da Serra | 210.895 |
| São Paulo | 773.330 |
| São Paulo - Campo Limpo sub-district | 191.527 |
| São Paulo - Capão Redondo sub-district | 240.793 |
| São Paulo - Vila Andrade sub-district | 75.393 |
| São Paulo - Butantã sub-district | 52.649 |
| São Paulo - Morumbi sub-district | 34.588 |
| São Paulo - Vila Sônia sub-district | 87.379 |
| São Paulo - Raposo Tavares sub-district | 91.204 |
The population of the area is predominantly low income residents, according to the information obtained on socioeconomic data from the 2000 census.
The tables and graphs below rely on data obtained from the IBGE demographic census (The Brazilian Institute of Geography and Statistics) in 2000.
Monthy average income of municipal districts
| Counties | Population |
| Embú | R$ 663,28 - 2 a 2,7 minimal wage salaries |
|---|---|
| Taboão da Serra | R$ 849,08 - 2,2 a 3,5 minimal wage salaries |
| São Paulo | R$ 2.418,03 |

Monthly average income (per municipal districts + sub- districts of São Paulo)
| Counties | Population |
| Embú | R$ 663,28 2 a 2,7 minimal wage salaries |
|---|---|
| Taboão da Serra | R$ 849,08 2,2 a 3,5 minimal wage salaries |
| São Paulo - Campo Limpo sub-district | R$ 958,78 2,2 a 3,9 minimal wage salaries |
| São Paulo - Capão Redondo sub-district | R$ 711,37 2 a 2,9 minimal wage salaries |
| São Paulo - Vila Andrade sub-district | R$ 3.383,44 3,3 a 14 minimal wage salaries |
| São Paulo - Butantã sub-district | R$ 2.584,46 6,6 a 10,7 minimal wage salaries |
| São Paulo - Morumbi sub-district | R$ 6.498,82 16 a 27 minimal wage salaries |
| São Paulo - Vila Sônia sub-district | R$ 2.554,87 4,5 a 10,6 minimal wage salaries |
| São Paulo - Raposo Tavares sub-district | R$ 968,03 2,2 a 4 minimal wage salaries |
Average education per municipal districts
| Counties | Attended till the 1st to 4th grades of elementary school | Concluded the 4th grade of elementary school | Concluded College |
| Embú | 38% | 17% | 2% |
|---|---|---|---|
| Taboão da Serra | 22% | 15% | 4% |
| São Paulo | 17% | 11% | 14% |
Average education (per municipal districts + sub- districts of São Paulo)
| Counties | Attended till the 1st to 4th grades of elementary school | Concluded the 4th grade of elementary school | Concluded College |
| Embú | 38% | 17% | 2% |
|---|---|---|---|
| Taboão da Serra | 22% | 15% | 4% |
| São Paulo Campo Limpo sub-district | 52,9% | 19,38% | 3,38% |
| > São Paulo Capão Redondo sub-district | 54,9% | 20% | 1,84% |
| São Paulo Vila Andrade sub-district | 45,9% | 11,7% | 12,6% |
| São Paulo Butantã sub-district | 7% | 5% | 38% |
| São Paulo Morumbi sub-district | 8% | 5% | 45% |
| São Paulo Vila Sônia sub-district | 15% | 9% | 27% |
| São Paulo Raposo Tavares sub-district | 20% | 13% | 6% |
Environmental aspects of the basin
The Pirajussara River Watershed has countless environmental problems, with the most significant being floods caused, largely, by the existence of countless areas along the watercourse subject to high risk of erosion. These areas were recently identified by a study of the IPT - Institute of Technological Research, called "Zero Erosion", according to which, the following proportion were found:
| Counties | Areas with risk erosion | % of Total Area |
| Embú | 5 | 10 |
|---|---|---|
| Taboão da Serra | 20 | 40 |
| São Paulo | 25 | 50 |
Such risk areas are intimately related to the main flooding areas of the watershed, which are given in the map below
It is important to point out that, besides the construction of retention pools (5 in the total, 3 in course), there are a series of measures suggested in the "Zero Erosion" Report to alleviate and even solve such problems. With this recent study (the document was delivered to the Butantã sub-prefecture in January of 2004), it is still unknown if the public authorities responsible for taking initiatives will apply these new documents in coming years, but this will certainly be followed by the Bacias Irmãs project during in the years to come.
Map 6: Flood areas of the Pirajussara Watershed (Source: IPT's "Zero Erosion" Report)
Black Creek Sub-watershed
Black Creek, situated in southern Ontario, is the smallest of the five subwatersheds that make up the Humber Watershed system, draining an area of 66 square kilometres. Geographically, the headwaters of the Black Creek begin in Vaughan, just west of Canada's Wonderland, and then travel south, roughly along Jane Street, to join with the Lower Humber between Eglinton and St. Claire Avenues, in the City of Toronto (See Figure 2).
About eighty percent of the Black Creek lies in the City of Toronto, and the upper fifth is located in the City of Vaughan. The Humber Watershed system, as illustrated in Figure 1, originates in the Oak Ridges Moraine, and the Niagara Escarpment, and travels 120 kilometers from its source to Lake Ontario in the Greater Toronto Area (Wahl, 2002). Hoover Creek, Lavender Creek and Rabbit Creek are all tributaries that join the Black Creek along the way. For a comprehensive summary of important aspects of the Black Creek, see Table 1.
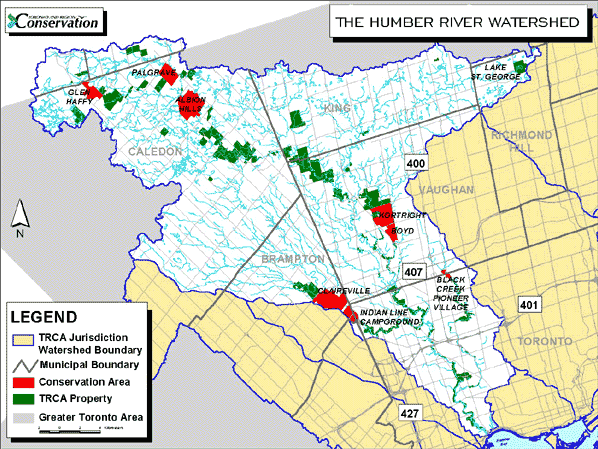
Map of the Humber Watershed
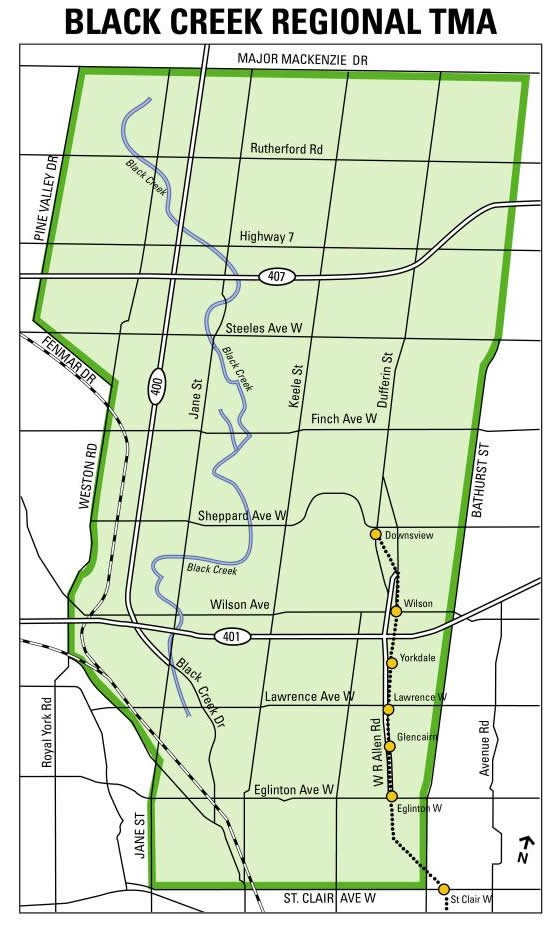
Black Creek Region
The following section will include a brief discussion on both the Oak Ridges Moraine and Lake Ontario (Figure 3), followed by analysis of the other influences on the state of the Black Creek watershed.
The Oak Ridges Moraine
One-quarter of the Humber's total land area is located on the Oak Ridges Moraine, a valuable conservation site, where more than thirty of the province's rivers originate. As urban sprawl continues to encroach on the farmland surrounding the Greater Toronto Area, and valuable headwater lands like the moraine, the health of the regions hydrological system is threatened, along with the loss of one of the few remaining natural ecological systems of the region. This undoubtedly has an impact on the Humber Watershed System, and in turn the Black Creek.
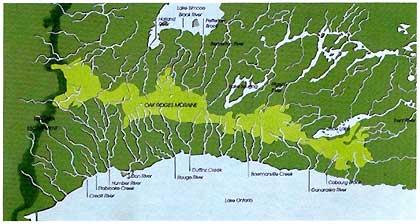
Oak Ridges Moraine
Lake Ontario
Lake Ontario is the 14th largest lake in the world, covering an area of 19,529 square kilometers. It is the smallest and lowest of the Great Lakes with nearly a quarter of Canada's population living near its shores. Historically, the lake was contaminated with industrial and chemical pollutants, untreated sewage, phosphates and fertilizers. The lake has since recovered significantly with the dedication and concern of NGOs, governments and community members. Current problems are E.coli and invasive species that threaten native aquatic and terrestrial populations within the ecosystem.
Ecology
Historically, the Black Creek watershed was rich in forests, fertile soils and clean water. Over the years, however, the landscape has been logged, converted to farmland, and eventually transformed into the heavily urbanized landscape of today. This urban development has reduced the size and quality of the creek, while land clearance, altered drainage patterns, and pollution have degraded the ecological health of the entire watershed (TRCA website/BCP, 2005). Residential, industrial and commerical development have resulted in a fully urbanized watershed and today, of the five subwatersheds within the Humber system, the Black Creek is the most degraded (HWTF, 1997). Therefore Black Creek acts as a storage basin for pollutants.
Current State of the Watershed
According to a document titled A Report Card on the Health of the Humber River Watershed, most of the aspects - environmental, social, and economic - of the watershed are in fair health (receiving a "C"). However, nearly one third of the indicators are in poor health, receiving a "D" or lower. On a more positive note, 75% of the indicators have either remained stable, or show signs of improvement. Below is a summary of the changes in the state of the watershed, as outlined in the Report Card, and the complete report card findings are outlined in Appendix 1.
- B or higher: Good Health, or relatively healthy areas include benthic vertebrae communities (bottom dwelling), publicly owned green space, and municipal stewardship
- C: Fair Health, or areas that are not in critical condition, include forest cover, wildlife, groundwater quality, trails, heritage resources, and community stewardship
- D or lower, Poor Health, or degraded indicators are air quality, wetlands, bacteria levels in surface water, chloride and nitrate levels in ground water storm water management, agricultural land protected from development, and conventional pollutants
Water Contamination
Concerns about water quality and water quantity in an urbanized watershed like the Black Creek are common and inevitably affect the health of the creek. Outlined below are a number of sources (as cited by Wahl and Creed) responsible for the degraded water quality of the Black Creek.
- Spills and deliberate dumping of comtaminants/effluents from both upstream and downstream industrial areas
- Herbicides and fertilizers used on commerical and residential properties
- Fecal matter introduced by pets and large geese populations
- Sewer overflow
- Metal pollutants in street dust and roadside soils such as cadmium, chromium, copper, lead, mercury, nickel and zinc
- Contaminants from cars (lead from gasoline and exhausts; nickel from diesel fuel and lubricating oil; cadium and zinc from tires)
- Runoff from two of the most heavily used highways in Canada, Highways 400 and 401
- Road salt (a large municipal snow dump is located on the bank of the creek)
- Increased amounts of impermeable surfaces (roof tops, roadways, parking areas) result in run off carried directly to the creek - this causes 'flash' floods, bank slumping, erosion and channel reformation
Land Use Related Contamination
Below is a list of problems, related to poor land use, that affect the aquatic and terretrial habitats within the Black Creek ecosystem (Wahl, 2002).
- Garbage dumping and littering from residential and industrial communities
- Excessive use by people in sensitive areas
- Poor design of constructed stormwater management ponds
- The lack of any natural wetland areas
- Areas of new development
- Five areas with major fish barriers
- Invasive species, including Manitoba male, dog strangling vine, and garlic mustard, that choke out native plants throughout the watershed
Three Key Stresses on Ecological System
Three physical stresses -- sediment loading, filling of valleys, and channelization -- are suggested by Creed as factors affecting the health and the rehabilitation of the Black Creek.
- Sediment loading within the Black Creek is very high and has been associated with erosional processes, street dusts (from areas with high traffic density), and construction sites. According to Creed, "Along many sections of Black Creek, the loss of most of the natural shrubs, bushes, trees and ground plants that originally protected the banks, have resulted in the "exposure" of banks. During storms, the water scours the banks of the creek, eventually increasing the width of the channel. The sediments that are lost from the eroded banks are loaded directly into the creek" (1985). In addition to this, particulates from street dusts and construction sites are transported in both wet and dry periods with harmful affects to plant and animal life and therefore the entire Black Creek ecosystem.
- Filling of Valleys: When urban development processes call for increased land use, major aspects within the ecological system are disrupted. Specifically, development within Black Creek has resulted in the creek valley and tributary ravines being filled by government and private agencies. As such, the loss of valley, which acts as a natural flood plain, has resulted in higher water levels and velocities during storm events (Creed, 1985). Other consequences include the loss of natural habitats for urban wildlife, flooding problems, and erosion.
- Channelization: In the case of the Black Creek, fluctuations in water levels have resulted in the channelization of the watershed. Creed argues that "along most of its length, the land surrounding the creek has been classified as "flood hazard" areas. To reduce the dangers of floods after heavy storms, large sections of Black Creek have been channelized and paved with concrete to enable water to move rapidly off the land and into Lake Ontario" (1985). This of course has impacted plant and animal species negatively and also resulted in varying levels of water throughout the Black Creek. Likewise, aquatic species have lost habitat and only those that are capable of adapting to a uniform habitat and swift flowing/high velocity waters are able to survive in the creek (1985).
Socio-cultural and Economic Factors
Census tracts and municipal borders are not based on watershed boundaries, but rather on political criteria, therefore a demographical analysis of the Black Creek watershed, for the purposes of this report, will include the Black Creek neighbourhood, which is part of the City of Toronto (Figure 4), and the City of Vaughan, wards 1 through 5. Analysis of the following data, based on the 2001 census, will lead to a greater understanding of the population dynamics within the watershed.
It should be noted that only a small portion of the population in the City of Vaughan resides within this specific watershed, however Mayor Di Biase, the Mayor of Vaughan, does have significant decision making power regarding activities and development within the watershed.
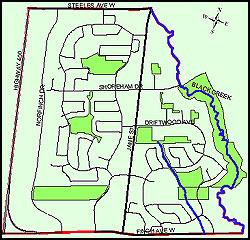
Black Creek Neighbourhood
Economic Analysis
The population of the Black Creek neighbourhood in 2001 was more than 24,000, earning an average household income of $44k / year, up from $37k / year from five years previously. However, in 2001, more than 3% of families in the area were earning less than $10,000, and one quarter of the families had low-income status. By comparison, Vaughan's population of 181,000 were earning roughly twice the Black Creek average income (between $72k and $90k / year), making the residents of the City of Vaughan significantly more affluent than those of the Black Creek neighbourhood, who live on more modest incomes.
With regard to home ownership in the Black Creek neighbourhood, approximately 30% of the population owned their homes, while 70% were renting. As such, most of the income earned by this community was, and still is today, spent on shelter. In stark contrast, approximately 90% - 95% of Vaughan residents, across all wards, own their own homes.
Cultural Analysis
The ethnic composition of the Black Creek neighbourhood further emphasizes this element of diversity. For instance, the top five languages spoken, not including English (11,030) and French (30), were Vietnamese, Arabic, Italian, Tamil and Spanish. To further illustrate the neighbourhood's diversity, Appendix 2 shows ethnic origins and recent immigrants in 1996 and 2001.
In contrast, the Vaughan community cites an estimated 90% - 96% of its population as Canadian citizens. The ethnic composition of Vaughan's five wards contains a consistently lower proportion of immigrants to Canadian residents, with the exception of few predominant cultures. While small percentages of East Indian, Portuguese, and other communities exist, the percentage of Italian speaking Vaughan residents ranges from 11% to 71% in the various census wards. Another predominant culture is the Jewish population, which numbers up to 42% in two of the census wards, suggesting that the population of the City of Vaughan is much more homogenous in regards to ethnic composition than that of the Black Creek neighbourhood.
While immigrants have arrived over the last census period (1996-2001) from Pakistan, Russia, Ukraine, Jamaica, India, Philippines, South Africa, South Korea, Iraq, Afghanistan, Italy, Germany, United Kingdom, and Guyana, their population numbers are still low. Finally, it is important to note that most of the immigrants living within these areas arrived prior to 1971 and to 1991, resulting in the first and third generation of Canadians residing in the Vaughan area today.
Socio-economic Drivers of Pollution in the Black Creek Watershed
The Black Creek watershed is one of the most polluted watersheds within Ontario, as described above. While the sources of pollution can be attributed to the overdevelopment of the watershed, and the large ecological footprint associated with heavy urbanization, it is the two main users of the water system that contribute to the pollution within the Black Creek watershed: residents and businesses.
Business
While there are no major industrial users operating directly near Black Creek, business has significantly affected the water quality, in that independent retailers and service providers, or mom + pop businesses, are proportionally more contaminating than larger corporate businesses. One reason for this, according to watershed specialist Gary Wilkins, is the greater availability of training and education on contaminants that is often achieved in larger companies with greater liabilities. Typically, the cleaning products used in these smaller establishments amount to a constant influx of harmful chemicals from restaurants and hair salons that go directly into the Black Creek waters (Wilkins).
Residents
The contamination of the watershed caused by residents largely occurs through residents' negligence in terms of animal waste pick up, illegal dumping of household chemicals, and the overuse of products harmful to the watershed, such as salt, fertilizers or pesticides. One of the largest misconceptions about the watershed is that water from the storm water drains is treated before it reaches the Creek; on the contrary, residents who dispose of garage and automobile chemicals in the storm water management drains are pouring contaminants directly into the creek.
One of the most complicated issues in the implementation of the sustainable watershed management plan at the residential level is the extensive socio-economic diversity that exists within the region, supported by the area census information. According to Wilkins, these issues have a very significant impact on the watershed, as factors such as responsibility, ownership, and power have very different meanings to different communities and different groups within those communities (Wilkens, 2005). According to the Humber River planners at the Toronto and Region Conservation Aurthority, residents that come from different backgrounds may not perceive their watershed as one in need of stewardship or may not view their individual actions as relevant to the health of the Humber River and its tributaries. Moreover, the Black Creek neighbourhood has been branded as having high rates of criminal activity (drugs and gangs), stemming from what many believe to be socio-economic instability. This has proven to be a challenge to the Black Creek Project, which aims to build conservation activities in the watershed (2005).
Politics
The Humber watershed sprawls into more than ten municipalities, and is therefore affected by the political decisions that take place in each of these jurisdictions. As well, the watershed is home to many stakeholders, who have varying levels of influence on watershed politics. York University is an example of one of the more powerful stakeholders in the Black Creek region, and for its size alone, its decisions in terms of development, conservation, and environmental management have a tremendous impact on the health of the watershed. While the focus of this paper is not to identify all of the stakeholders in the Black Creek watershed, it is important to highlight some of the contentious issues of the region, given that the decision making processes take into account the interests of such diverse stakeholders.
It is also important to note here that the issue of potable water distribution as well as the service of water delivery and wastewater management are controlled by water services through the City of Toronto. Water services controls the price of water and sells water to the surrounding municipalities, while each of the municipalities is responsible for providing the necessary water delivery infrastructure.
One implication of this system is that, given the region's abundance of fresh water resources, residents have become among the world's highest consumers of water per capita, without feeling scarcity or depletion of water supply (Statistics Canada, 2003). As such the most contentious political issues in the watershed are largely due to the threat of further development in the region and excessive water usage for private organizations.
Oakdale Golf and Country Club
Another major implication of the municipal water supply system on community engagement is that community groups have no legal power to affect the water distribution system and little impact on the high water demand of the users. One of the recent issues of contention regarding the right of users to use large quantities of the public water supply involved the provincial government, the Conservation Authority, and community based interest groups in a debate over whether a public well can be used as a source of fresh water for a private business, in this case a golf course. Community organizations believe that removing large quantities from public water sources must be controlled and that this water removal will bring a negative effect to Black Creek stream flows and ecological systems. The issue will be decided in the next 2 years, and interest groups hope that this could set a precedent for fee based water usage policies for private sector users.
The Oak Ridges Moraine
In the Oak Ridges Moraine, which accounts for almost one-quarter of the Humber's total land area, urban sprawl continues to absorb the farmland and natural environment surrounding the GTA. Since the scope of the power of community groups is nested in their ability to protect the few remaining natural ecological systems of the region, groups like the Humber Alliance and Friends of the Oak Ridges Moraine have worked arduously to mobilize against developers and property owners in the area, resulting in public meetings, protests, and hearings with the Ontario Municipal Board. A recent victory includes the Oak Ridges Corridor Park, an important ecological linkage within the Oak Ridges Moraine. However, much of the land is still under threat and advocacy for land conservation remains a priority.
Appendix 1: Black Creek Vital Statistics
| Characteristics | Description |
|---|---|
| Geographical |
|
| Ecological |
|
| Socio-economic |
|
| Political |
|
Appendix 2: Humber Watershed Report Card Summary of Indicators and Grades
| Landforms |
|
|
|---|---|---|
| Terrestrial Habitat |
|
|
| Groundwater |
|
|
| Surface Water |
|
|
| Aquatic Habitat |
|
|
| Air |
|
|
| Heritage |
|
|
| Outdoor Activities |
|
|
| Agriculture |
|
|
| Development |
|
|
| Stewardship |
|
|
Appendix 3: Top ten ethnic origins in the Black Creek neighbourhood: ancestry
(Chart courtesy of 'Neighbourhood Profiles' prepared by the City's Community and Neighbourhood Services Department and Toronto Public Health)
| Ethnic Origin | Total Responses |
| Jamaican | 3,155 |
|---|---|
| East Indian | 2,300 |
| Italian | 2,230 |
| Canadian | 1,890 |
| Vietnamese | 1,595 |
| Chinese | 1,550 |
| English | 1,135 |
| Guyanese | 935 |
| Spanish | 915 |
| African Black | 635 |
Top ten recent imigrant groups: 2001, 1996
(Chart courtesy of 'Neighbourhood Profiles' prepared by the City's Community and Neighbourhood Services Department and Toronto Public Health)
| 2001 | 1996 | ||
|---|---|---|---|
| Iraq | 545 | Sri Lanka | 745 |
| Sri Lanka | 355 | Iraq | 670 |
| Guyana | 350 | Vietnam | 650 |
| Jamaica | 330 | Guyana | 615 |
| Ghana | 315 | Jamaica | 375 |
| China | 210 | India | 305 |
| Pakistan | 190 | Ghana | 290 |
| India | 160 | Somalia | 275 |
| Vietnam | 150 | Pakistan | 185 |
| Ukraine | 115 | El Salvador | 155 |