| TIEDI Labour Force Update: CANADA January 2013 |
   
|
|
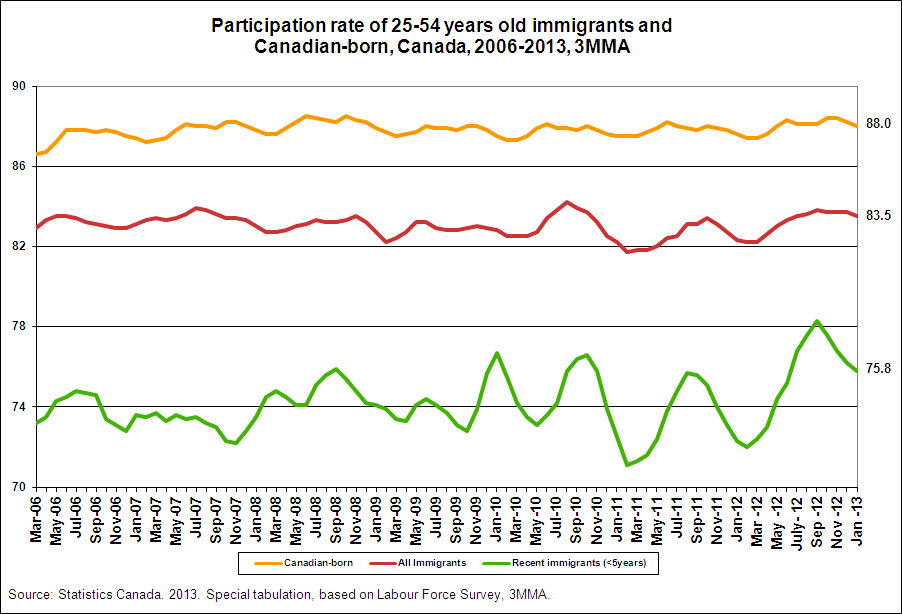
On this page: Participation rate: In January 2013, the participation rate of all immigrants across Canada was 83.5% compared to 88.0% for Canadian-born. At 75.8%, recent immigrants (immigrants who gained permanent residency within the last 5 years) had much lower participation rates than Canadian-born and all immigrants. The greater monthly variability in the participation rates of recent immigrants is likely attributable to a smaller sample size.
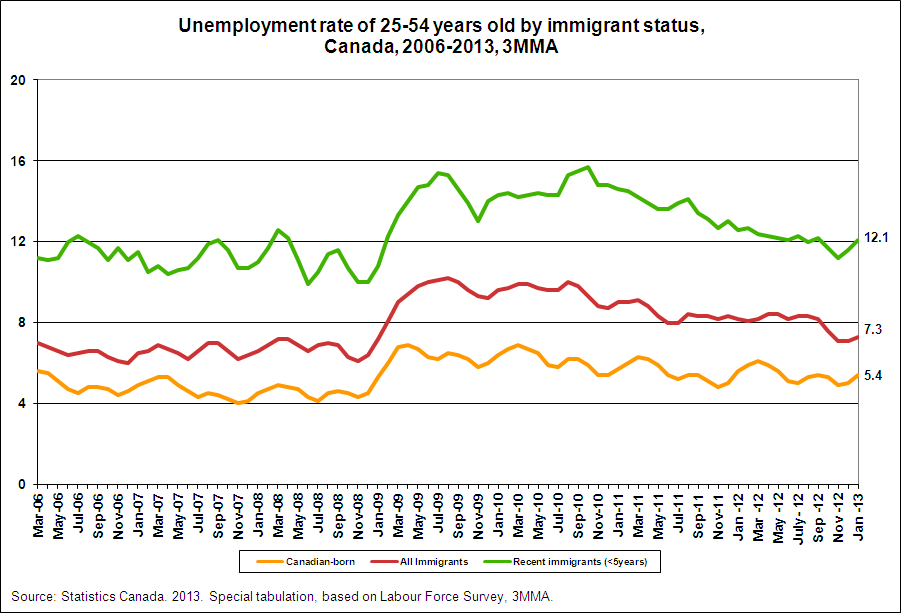
Unemployment rate: Since 2006, the Canadian-born have had consistently lower unemployment rates than immigrants. Recent immigrants have the highest unemployment rate among all groups: their unemployment rate has rarely fallen below 10% since March 2006. Comparing unemployment rates in January 2012 and 2013, for Canadian-born, by January 2013, unemployment had fallen by 0.2 percentage points, from 5.6% in January 2012. For all immigrants, by January 2013, unemployment had fallen by 0.9 percentage points, from 8.2% in January 2012. For recent immigrants, unemployment had fallen by 0.5 percentage points, from 12.6% in January 2012.
For definitions, please consult our Glossary. |
 |
 |

 March 8, 2013
1) January 2013 Labour Force Update
2) TIEDI's Public Outreach Events(2011-2013)
3) Dr. Kelly- part of Ontario's Expert Roundtable on Immigration, click here to see report submitted to MCI.
4) TIEDI Roundtable Discussion papers