| TIEDI Labour Force Update: TORONTO CMA January 2013 |
   
|
|
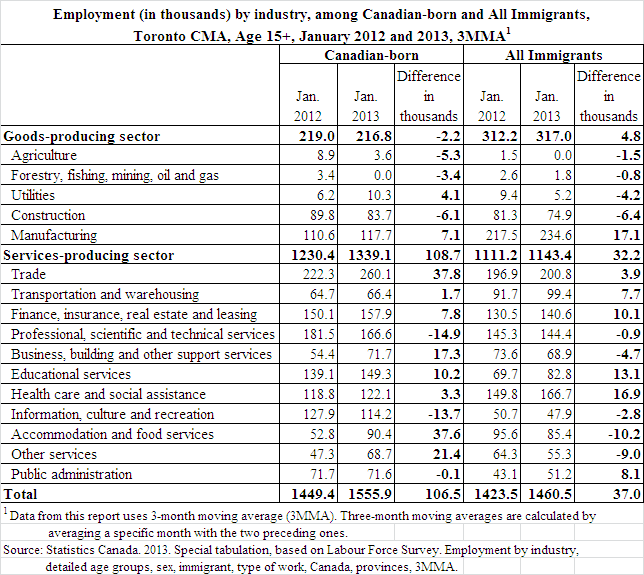
On this page: Employment by industry: For Canadian-born, jobs were gained in the following industry sectors: trade (37,800 jobs), accommodation/food services (37,600 jobs), and other services (21,400 jobs). The very large percentage increase in the accommodation/food services sector is notable. Large job losses occurred in professional, scientific and technical services (14,900 jobs) and information, culture and recreation (13,700 jobs). For immigrants, notable job gains were found in manufacturing sector (17,100 jobs), health care and social assistance (16,900 jobs) and educational services (13,100 jobs). Large job losses for immigrants were found in accommodation and food services (10,200 jobs), other services sectors (9,000 jobs) and construction (6,400 jobs).
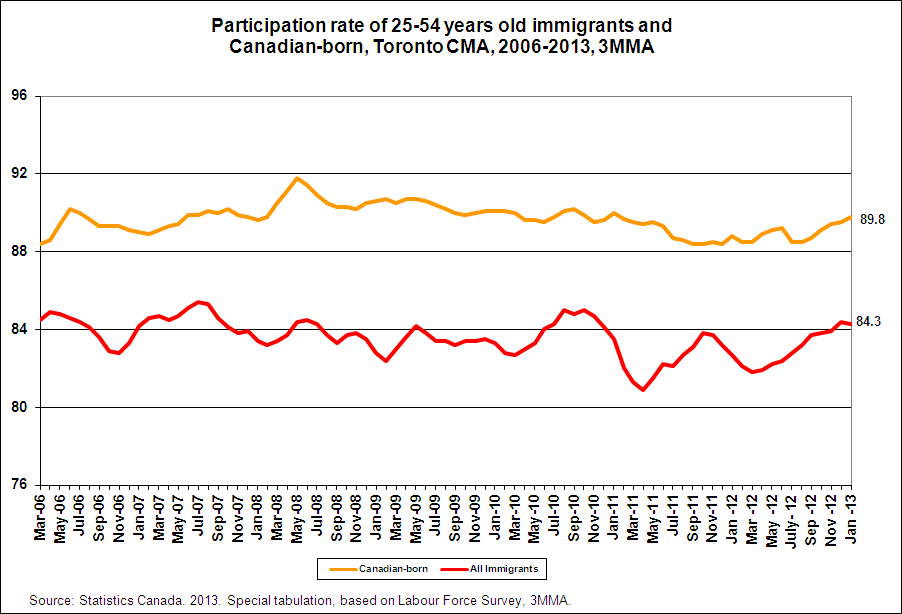
Participation rate: Since 2006, the participation rate among Canadian-born has remained within the range of 88%-92%. This has been consistently higher than the participation rate for immigrants, which has ranged between 80% and 86%.
.
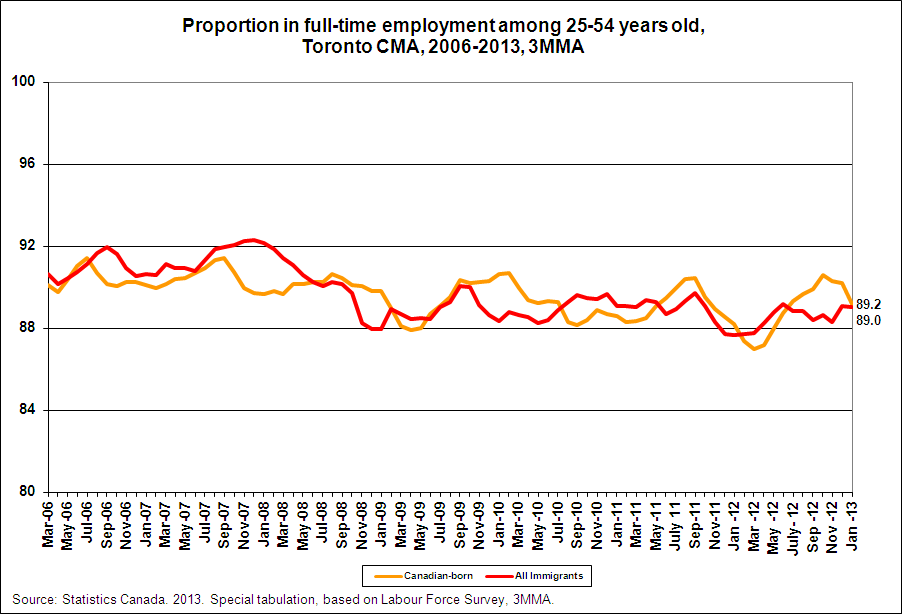
Proportion in full-time employment: In January 2013, the Canadian-born in Toronto had a slightly higher rate of full-time employment (89.2%) compared to all immigrants (89.0%). Canadian-born and immigrants have generally had similar rates of full-time employment, fluctuating from month to month. Overall, the proportion in full-time employment for immigrants and the Canadian-born has decreased in the past 7 years, with the trend more pronounced among immigrants.
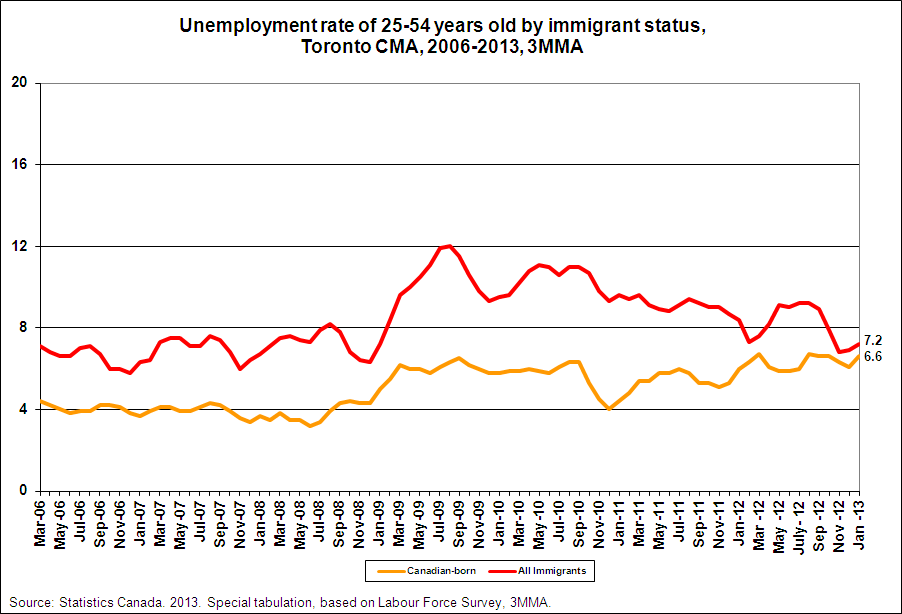
Unemployment rate:
In January 2013, the unemployment rate for Canadian-born in the Toronto CMA was 6.6 %, compared to 7.2% for immigrants. Immigrant unemployment rates have been consistently higher than Canadian-born since 2006, and this gap widened during the economic downturn starting in late 2008 . Recently, however, there has been a narrowing of the spread in unemployment rates, with immigrants much closer to Canadian-born. TIEDI Report 22 has more details about how Canada's recession affected the Canadian-born and immigrants' labour market outcomes from 2006 to 2011. This report can be found in, http://www.yorku.ca/tiedi/pubreports22.html.
For definitions, please consult our Glossary. |
 |
 |

 March 8, 2013
1) January 2013 Labour Force Update
2) TIEDI's Public Outreach Events(2011-2013)
3) Dr. Kelly- part of Ontario's Expert Roundtable on Immigration, click here to see report submitted to MCI.
4) TIEDI Roundtable Discussion papers