MacKenzie, I. S. (2015). Fitts' throughput and the remarkable case of touch-based target selection. Proceedings of the 17th International Conference on Human-Computer Interaction - HCII 2015 (LNCS 9170), pp. 238-249. Switzerland: Springer. doi: 10.1007/978-3-319-20916-6_23 [PDF] [software]
Fitts' Throughput and the Remarkable Case of Touch-based Target Selection
I. Scott MacKenzie
Dept. of Electrical Engineering and Computer ScienceYork University, Toronto, Ontario, Canada
mack@cse.yorku.ca
Abstract. The method of calculating Fitts' throughput is detailed, considering task characteristics, the speed-accuracy trade-off, data collection, and data aggregation. The goal is to bring consistency to the method of calculation and thereby strengthen between-study comparisons where throughput is used as a dependent measure. In addition, the distinction between indirect and direct pointing devices is elaborated using the examples of a mouse as an indirect pointing device and a finger as a direct pointing device. An experiment with 16 participants using a smart phone was conducted as an empirical test of direct touch-based target selection. Overall, the throughput was 6.95 bps. This is a remarkable figure – about 50% higher than accepted values for a mouse. The experiment included task type (1D vs. 2D) and device position (supported vs. mobile) as independent variables. Throughput for the 1D task was 15% higher than for the 2D task. No difference in throughput was observed between the supported and mobile conditions.Keywords: Fitts' law, throughput, touch input
1 Background
The graphical user interface (GUI) first appeared in 1981 when Xerox Corp. introduced the 8100 Information Workstation, better known as the Star [9, p. 11]. The Star was the first commercial system to use a mouse and point-and-click interaction. About the same time, Shneiderman coined the expression direct manipulation to reflect this promising new genre of interaction [13]. Instead of typing commands in a terminal window, users maneuver a mouse to directly manipulate on-screen graphical objects, such as icons, menus, and buttons.
While Shneiderman's broad insights were correct, a lower level of analysis reveals that mouse operation is an example of indirect input: Input actions occur on the desktop while output responses appear on the display. Because of the indirectness, a cursor is required as an intermediary. With direct input, the input and output spaces are merged. We will return to this point shortly.
In the 35 years since the GUI appeared, there has been considerable research on evaluating the mouse and comparing it with alternative devices or techniques (see [8, 15] for reviews). Most evaluations use target selection tasks modeled after Fitts' law [4, 5]. For the mouse and other indirect input devices, this involves manipulating the device to move an on-screen cursor over a specified amplitude (A) to acquire a target of a specified width (W). Selection involves a final button press.
Direct input is different: Targets appear on the display and the input device operates directly on the targets. Indirect input and direct input are contrasted in Fig. 1.
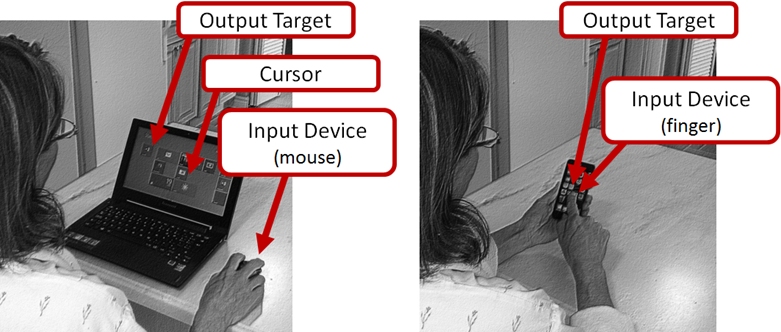
Fig. 1. Indirect input (left) requires a cursor as an intermediary. With direct input (right), actions occur directly on output targets
The primary dependent variable for a Fitts' law study is throughput in bits/s. In the next section, the calculation of throughput is detailed. Due to space limitations, the discussion is brief. Additional details are found in other sources (e.g., [4, 8, 15]) .
Fitts' Law and Throughput
Fitts' motivation was to investigate whether human performance in target acquisition tasks could be measured or quantified using an information metaphor. He reasoned that a human operator that acquires targets over a certain amplitude (signal) and with variable success (noise) is demonstrating a "rate of information transfer" [4, p. 381]. Fitts' index of performance, now throughput (TP), is
| TP = IDe / MT | (1) |
where IDe is a task's effective index of difficulty (in bits) computed from the movement amplitude (A) and target width (W) and MT is the mean movement time (in seconds) recorded over a sequence of trials. The IDe-term in eq. 1 expands as follows:
| IDe = log2(Ae / We + 1) | (2) |
Use of the effective values (subscript "e") is a change proposed by Crossman [2, 16, p. 146] and subsequently endorsed by Fitts [5] to include spatial variability or accuracy in the calculation. With this, We is computed as 4.133 × SDx, where SDx is the standard deviation in the selection coordinates and Ae is the mean of the actual movement amplitudes in the sequence of trials. Adjusted in this manner, throughput is a single human performance measure that embeds both the speed and accuracy in human responses. The trade-off is revealed in Fig. 2.
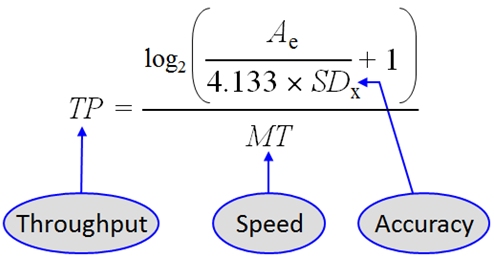
Fig. 2. The speed-accuracy trade-off in the calculation of Fitts' throughput
Throughput computed using eq. 1 is a measure of human performance in the context of the task, device, and environmental conditions when the data were collected. If testing over, say, two or three separate test conditions, the differences in throughput can be used to assess performance differences between the conditions.
Since throughput includes speed and accuracy, the comparison is a composite, and bears no prejudice toward speed or accuracy as viewed alone [10]. This is clearly a useful property of throughput. However, inconsistencies in the method of collecting data and performing the calculation have exacerbated the use of throughput as a dependent variable in experimental research. One goal in this paper is to remedy this.
Data Collection and Calculation of Throughput
In this section, the best-practice method for calculating throughput is detailed.
Most Fitts' law experiments combine either serial or discrete responses with one-dimensional (1D) or two-dimensional (2D) movements. See Fig. 3. Example tasks are described in the ISO 9241-9 standard for evaluating non-keyboard devices and interaction techniques [7, 15].
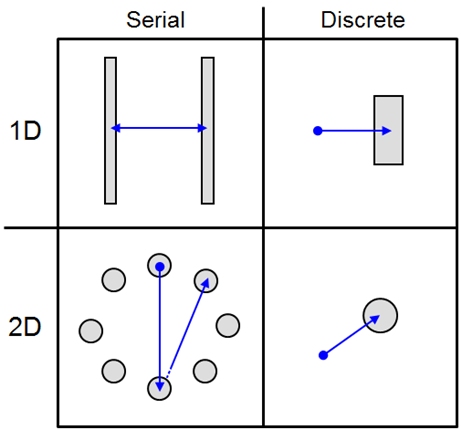
Fig. 3. Fitts' law tasks: 1D vs. 2D. Serial vs. discrete
Regardless of the task, the calculation of throughput requires Cartesian coordinate data for each trial for the starting position ("from"), the target position ("to"), and the select position. See Fig. 4.

Fig. 4. Geometry for a trial
The calculation begins by computing the length of the sides connecting the from,
to, and select points in the figure. Using Java syntax,
double a = Math.hypot(x1 - x2, y1 - y2);

double b = Math.hypot(x - x2, y - y2);

double c = Math.hypot(x1 - x, y1 - y);
The x-y coordinates correspond to the from (x1, y1), to
(x2, y2), and select (x,
y) points in the figure. Given a, b, and c, as above, dx
and ae are then
calculated:
double dx = (c * c – b * b – a * a) / (2.0 * a);

double ae = a + dx;
Note that dx is 0 for a selection at the center of the target (as projected on
the task axis), positive for a selection on the far side of center, and negative
for a selection on the near side. It is an expected behaviour that some
selections will miss the target.
The effective target amplitude (Ae) is ae in the code above. It is the actual
movement distance for the trial, as projected on the task axis. For serial
responses, an additional adjustment for Ae is to add dx from the previous trial
(for all trials after the first). This is necessary since each trial begins at
the selection point of the previous trial. For discrete responses, each task
begins at the center of the from target.
Given arrays for the from, to, and select points in a sequence of trials,
Ae is
the mean of the ae values and SDx is the standard deviation in the dx values.
With these, IDe is computed using eq. 2 and throughput (TP) is computed using
eq. 1.
The use of the effective target amplitude (Ae) has little influence on TP, provided selections are distributed about the center of the targets. However, it is important to use Ae to prevent "gaming the system." For example, if all movements fall short and only traverse, say, ¾ of A, TP is artificially inflated if calculated using A. Using Ae prevents this. This is part of the overall premise in using "effective" values: Participants get credit for what they actually did, not for what they were asked to do.
Calculate Throughput on Each Sequence of Trials
The correct level of data aggregation for calculating Fitts' throughput is a sequence of trials. The premise for this is twofold:
- Throughput cannot be calculated on a single trial.
- A sequence of trials is the smallest unit of action for which throughput can be attributed as a measure of performance.
On the first point, the calculation of throughput includes the variability in selection coordinates (akin to "noise"). Thus, multiple selections are required and from these data the variability in the coordinates is computed.
The second point is of ecological concern. After a sequence of trials, the user pauses, stretches, adjusts the apparatus, has a sip of tea, adjusts her position on a chair, or something. There is a demarcation between sequences and for no particular purpose other than to provide a break or pause between sequences, or perhaps to change to a different test condition. It is reasonable to assert that once a sequence is over, it is over! Behaviours were exhibited, observed, and measured and the next sequence is treated as a separate unit of action with separate performance measurements.
Related to the second point is the following: Throughput should not be calculated on larger sets of raw data. For example, if six participants each perform five sequences of trials under the same test condition, there are 6 × 5 = 30 calculations of throughput, rather than a single calculation on the pooled raw data.
Calculation of Throughput in the HCI Literature
A detailed review of the calculation of throughput in the HCI literature is beyond the scope of this paper. Inconsistency is common and this weakens between-study comparisons based on throughput. A few examples follow.1
Dijkstra et al. reported throughput in research on flexible displays [3]. The movement amplitude (A) differed from one trial to the next in a sequence. Furthermore, A was "freely determined by the participant" [3, p. 1300]. Pedersen and Hornbæk reported throughput in research on touch input with a tabletop surface [12, Table 1]. Error trials were excluded in the calculation. Wobbrock and Gajos reported throughput in research using participants with and without a motor impairment [17]. The calculation excluded accuracy, and used W instead of We. Forlines et al. reported throughput in a docking task on a tabletop display [6]. Throughput was calculated as 1 / b – the slope reciprocal from the regression equation: MT = a + b ID. Provided the intercept a is 0, or close to 0, there is little difference between this value and that computed using eq. 1. But, the intercept was large: 460 ms [6, Table 1]. Also, error trials were excluded.
Interpreting throughput as 1 / b from the regression equation is a point of particular contention in the HCI literature. (For contrasting opinions, see [18] and [15, Section 3.5].) Although 1 / b has units "bits per second", this term cannot be used as a dependent variable in experimental research – because of the wavering influence of the intercept, a, which is absent in 1 / b. Besides, using 1 / b as throughput is inconsistent with Fitts' original definition: "The average rate of information generated in a series of movements is the average information per movement divided by the time per movement" [4, p. 390].
It makes little sense to recite and compare the values for throughput in the studies just cited: They were computed in different ways. A goal herein is to remedy this by providing a clear articulation of the method of calculating Fitts' throughput .
2 Method
In this section, a user study is described that demonstrates the calculation of throughput for touch-based target selection. The study examined the effects of task type (1D vs. 2D) and device position (supported vs. mobile). For the supported condition, participants sat at a desk with the device positioned on the desktop. For the mobile condition, participants stood and held the device in one hand while selecting targets with the index finger on the opposite hand.
2.1 Participants
Participants were recruited from the local university campus. The only stipulation was that participants were regular users of a touchscreen phone, pad, or tablet. Sixteen participants were recruited from a wide range for disciplines. Six were female. The mean age was 24.3 years (SD = 3.0). Participants' average touchscreen experience was 22.9 months (SD = 15.8). All participants were right-handed.
As the experiment involved target selection using the finger on a small display, we also investigated the relationship between finger width and performance. The width of each participant's index finger was measured at the distal joint using the caliper in Fig. 5. The mean finger width was 14.0 mm (SD = 1.4).
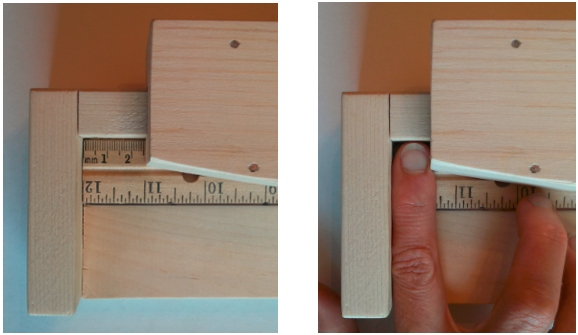
Fig. 5. Caliper used to measure the width of each participant's index finger
2.2 Apparatus (Hardware and Software)
Testing was done on a LG Nexus 4 touchscreen smartphone running Android OS version 4.2.2. The display was 61 × 102 mm (2.4 in × 4.0 in) with a resolution of 768 × 1184 px (pixels) and a px density of 320 dpi. All communication with the phone was disabled during testing.
Custom software called FittsTouch was developed using Java SDK 1.6. The software implemented the serial 1D and 2D tasks commonly used in Fitts' law experiments.
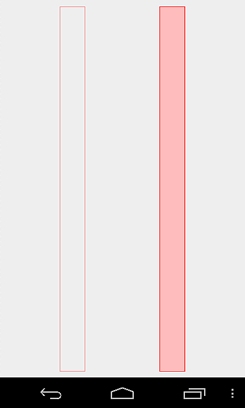
The same target amplitude and width conditions were used for both task types. The range was limited due to the small display and finger input. In all, six combinations were used: A = { 156, 312, 624 } px × W = { 78, 130 } px. These corresponded to task difficulties from ID = 1.14 bits to ID = 3.17 bits (see eq. 2). A wider range is desirable but pilot testing at W = 30 was deemed untenable. The scale of target conditions was chosen such that the widest condition (largest A, largest W) spanned the width of the display (portrait orientation) minus 10 px on each side. Examples of target conditions are shown in Fig. 6.
 (b)
(b)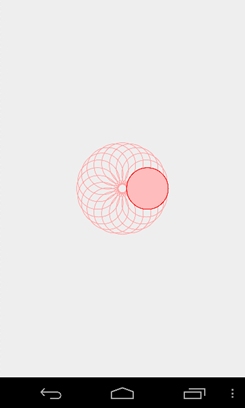 (c)
(c)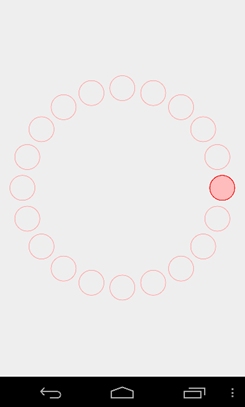
Fig. 6. Example target conditions: (a) 1D nominal (b) 2D easiest (c) 2D hardest
The 2D conditions included 20 targets, which was the number of trials in a sequence. The target to select was highlighted. Upon selection, the highlight moved to the opposite target. Selections proceeded in a rotating pattern around the layout circle until all targets were selected. For the 1D task, selections were back and forth.
Data collection for a sequence began on the first tap and ended after 20 target selections (21 taps). An auditory beep was sounded if a target was missed. At the end of each sequence a dialog appeared showing summary results for the sequence. Fig. 7 gives an example. The dialog is useful for demos and to help inform and motivate participants during testing.
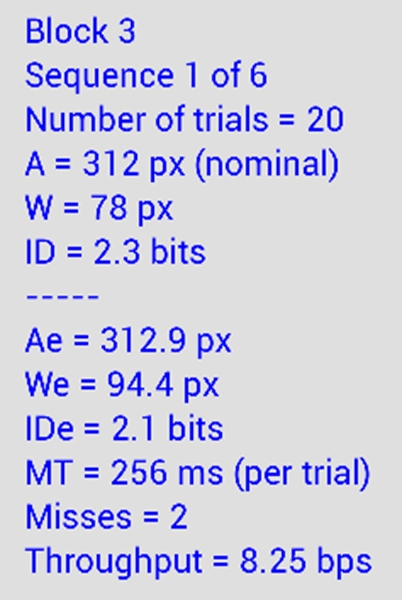
Fig. 7. End-of-sequence dialog
2.3 Procedure
After signing a consent form, participants were briefed on the goals of the experiment. The experiment task was demonstrated to participants, after which they did a few practice sequences for each test condition. For the mobile condition, participants were asked to stand and hold the device in their non-dominant hand and select targets with the index finger on their dominant hand. For the supported condition, participants sat at a desk with the device positioned on the desktop. They were allowed to anchor the device with their non-dominant hand if desired. An example of a participant performing the 1D task with the device supported on the desktop is shown in Fig. 8.
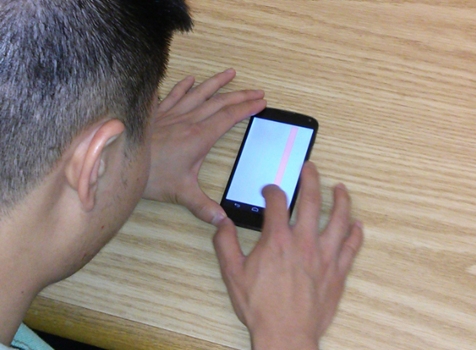
Fig. 8. A participant doing the experiment task in the 1D-supported condition
Participants were asked to select targets as quickly and accurately as possible, at a comfortable pace. They were told that missing an occasional target was OK, but that if many targets were missed, they should slow down.
2.4 Design
The experiment was fully within-subjects with the following independent variables and levels:
Device position mobile, supported Task type 1D, 2D Block 1, 2, 3, 4, 5 Amplitude 156, 312, 624 Width 78, 130
The primary independent variables were device position and task type. Block, amplitude, and width were included to gather a sufficient quantity of data over a reasonable range of task difficulties.
For each condition, participants performed a sequence of 20 trials. The 4 device position × task type conditions were assigned using a balanced Latin square with 4 participants per order. The amplitude and width conditions were randomized within blocks.
The dependent variables were throughput, movement time, and error rate. The relationship between participants' finger widths and performance was also examined.
Testing lasted about 45 minutes per participant. The total number of trials was 16 participants × 2 device positions × 2 task types × 5 blocks × 3 amplitudes × 2 widths × 20 trials = 38,400.
3 Results and Discussion
In this section, results are given for throughput, movement time, and error rate. As space is limited and the calculation and use of throughput is the primary theme in this paper, the results for movement time and error rate are abbreviated.
3.1 Throughput
The grand mean for throughput was 6.95 bps. This result, in itself, is remarkable. Here we see empirical and quantitative evidence underpinning the tremendous success of contemporary touch-based interaction. Not only is the touch experience appealing, touch performance is measurably superior compared to traditional interaction techniques. For desktop interaction the mouse is well-known to perform best for most point-select interaction tasks.2 In a review of Fitts' law studies following the ISO 9241-9 standard, throughput values for the mouse ranged from 3.7 bps to 4.9 bps [15, Table 5]. The value observed in the present study for touch input reveals a performance advantage for touch in the range of 42% to 88% compared to the mouse. The most likely reason lies in the distinguishing properties of direct input vs. indirect input, as discussed earlier. With a mouse (and other traditional pointing devices), the user manipulates a device to indirectly control an on-screen tracking symbol. Selection requires pressing a button on the device. With touch input there is neither a tracking symbol nor a button: Input is direct!
Participant by block results for throughput are shown in Fig. 9. Each point in the figure is the mean of 24 separate calculations for throughput.
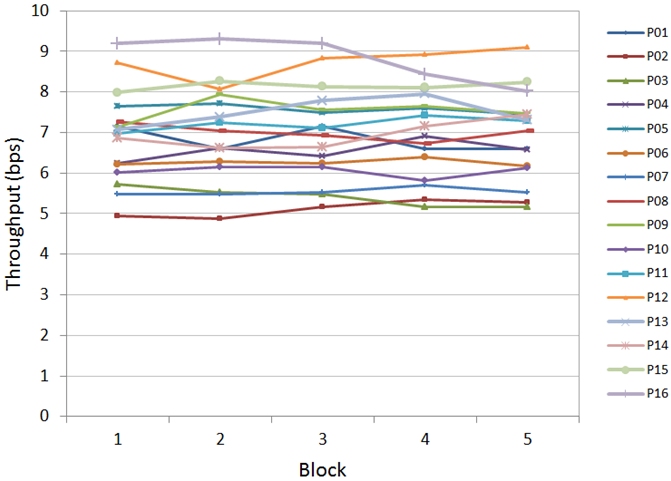
Fig. 9. Throughput by block for 16 participants
There was only a 0.2% performance difference between the 1st block and the 5th block. Three reasons seem likely: participants had prior experience with touch input, the task was simple, and practice trials were given before testing. The means for individual participants ranged from 5.12 bps to 8.83 bps. For subsequent analyses the block data are pooled.
Throughput across the two main independent variables is shown in Fig. 10. The difference by device position was small – only 3%, with values of 6.85 bps supported and 7.06 bps mobile. The difference was not statistically significant (F1,3 = 2.80, p > .05). At first glance, this result seems surprising since a device is clearly more stable when positioned on a desktop than when held in the hand. However, several participants commented that they felt the supported condition was odd or awkward: they wanted to hold the device! Clearly, there is a culture around mobile device usage – an expectation that the device is operated in an unsupported position, such as holding it in one hand while touching with fingers on the opposite hand.
The difference in throughput by task type revealed a different story. Throughput for the 2D condition was 6.39 bps. At 7.52 bps, performance in the 1D condition was 15.0% better. The difference was statistically significant (F1,12 = 29.6, p < .0001). With back-and-forth movement only, the 1D condition is clearly easier. Movements in the 2D condition are more complicated, since the direction of movement changes by 360° / 20 = 18° with each trial. Furthermore, occlusion is unavoidable for some trials in a sequence. This does not occur for the 1D task.
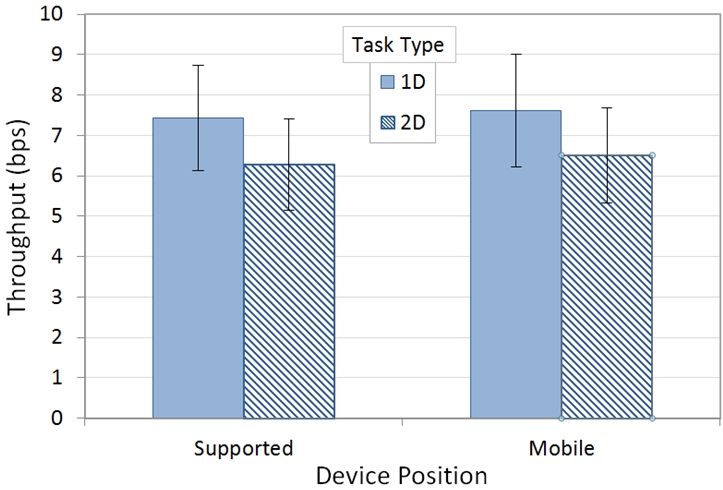
Fig. 10. Throughput (bps) by device position and task type. Error bars show ±1 SD
3.2 Movement Time and Error Rate
The grand mean for movement time was 341 ms per trial. By task type, the means were 306 ms (1D) and 377 ms (2D). The difference was statistically significant (F1,12 = 48.5, p < .0001). By device position, the means were 343 ms (mobile) and 339 ms (supported) The difference was not statistically significant (F1,12 = 0.35, ns).
The grand mean for error rate was 7.4% per sequence. By task type, the means were 7.3% (1D) and 7.6% (2D). The difference was not statistically significant (F1,12 = 0.03, ns). By device position, the means were 6.7% (mobile) and 8.1% (supported). The difference was not statistically significant (F1,12 = 1.60, p > .05).
The error rates cited are high compared to similar studies in desktop environments [15]. The reason is revealed by examining results by target width and participants' finger widths. By target width, the mean error rates were 2.7% for the large targets (W = 130 px) and 12.2% for the small targets (W = 78 px). Thus there were 4.6× more errors for the small targets. Clearly, selecting small targets with the finger is a problem for touch input. The display width of the 78-px target was 6.2 mm (0.25 in). As noted earlier, the mean width of the tip of participants' index finger was 14.0 mm, which is more than 2× the target width!
Not only are small targets harder to select, the effect is more pronounced for users with wide fingers. This is evident in Fig. 11, which shows both the increase in error rate for the small targets as well as a pronounced positive trend by finger width for the smaller target. It is no surprise then, that a research theme in touch-based mobile computing is improving the techniques for selecting small targets (e.g., [1, 14]).
It is worth noting that the trend in Fig. 11 for error rate does not appear in a similar chart for throughput (not shown). The scatter for throughput by finger width is essentially flat, demonstrating that participants' can achieve good performance (as indicated in measures for throughput) irrespective of finger width.
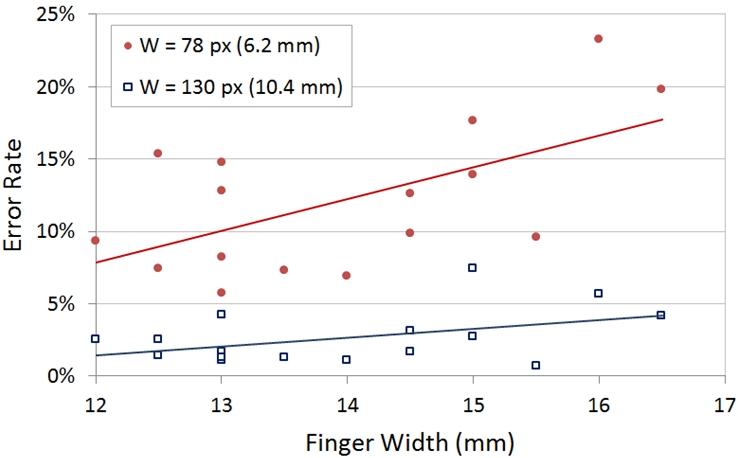
Fig. 11. Error rate by target width (W) and participants' finger width
3.3 Distribution Measures and Normality Test
A software tool was also used to assess the distribution characteristics of the selection coordinates. The mean skewness of the distributions, over all 1920 sequences, was −0.038 (SD = 0.523). The mean kurtosis was 0.120 (SD = 1.198). Both of these figures are low, indicating no overall tendency toward a negative or positive skewness or toward a flat or peaked distribution. A normality test was conducted using the Lilliefors procedure at alpha = .05. In all, 93.2% of the sequences were deemed to have selection coordinates conforming to the normal distribution, which is to say, the null hypothesis of normality was not rejected.
4 Conclusion
In this paper, the best-practice calculation for Fitts' throughput was demonstrated in a user study on touch-based target selection. During the experiment, throughput and other measures were calculated. The grand mean for throughput was 6.95 bps, which is 42%-88% higher than values typically reported for the mouse. The 1D condition yielded a throughput of 7.52 bps which was 15% higher than the 6.39 bps observed for the 2D task.
References
| 1. | Bi, X., Li, Y., and Zhai, S.: FFitts law: Modeling finger touch with Fitts'
law, In: Proc CHI 2013, pp. 1363-1372. New York: ACM (2013).
https://doi.org/10.1145/2470654.2466180
|
| 2. | Crossman, E.R.F.W.: The information-capacity of the human motor-system in
pursuit tracking, Q J Exp Psy, 12, 1-16 (1960).
https://doi.org/10.1080/17470216008416694
|
| 3. | Dijkstra, R., Perez, C., and Vertegaal, R.: Evaluating effects of structual
holds on pointing and dragging performance with flexible displays, In: Proc CHI
2011, pp. 1293-1302. New York: ACM (2011).
https://doi.org/10.1145/1978942.1979135
|
| 4. | Fitts, P.M.: The information capacity of the human motor system in controlling
the amplitude of movement, J Exp Psy, 47, 381-391 (1954).
https://psycnet.apa.org/doi/10.1037/h0055392
|
| 5. | Fitts, P.M. and Peterson, J.R.: Information capacity of discrete motor
responses, J Exp Psy, 67, 103-112 (1964).
https://doi.org/10.1037/h0045689
|
| 6. | Forlines, C., Wigdor, D., Shein, F., and Balakrishnan, R.: Direct-touch vs.
mouse input for tabletop displays, In: Proc CHI 2007, pp. 847-856. New York: ACM
(2007).
https://doi.org/10.1145/1240624.1240726
|
| 7. | ISO: Ergonomic requirements for office work with visual display terminals
(VDTs) - Part 9: Requirements for non-keyboard input devices (ISO 9241-9),
International Organisation for Standardisation. Report Number ISO/TC 159/SC4/WG3
N147 (February 15, 2000).
https://www.iso.org/standard/30030.html
|
| 8. | MacKenzie, I.S.: Fitts' law as a research and design tool in human-computer
interaction, Human-Computer Interaction, 7, 91-139 (1992).
https://doi.org/10.1207/s15327051hci0701_3
|
| 9. | MacKenzie, I.S.: Human-computer interaction: An empirical research
perspective. Waltham, MA: Morgan Kaufmann (2013).
https://www.yorku.ca/mack/HCIbook2e/
|
| 10. | MacKenzie, I.S. and Isokoski, P.: Fitts' throughput and the speed-accuracy
tradeoff, In: Proc CHI 2008, pp. 1633-1636. New York: ACM (2008).
https://doi.org/10.1145/1357054.1357308
|
| 11. | MacKenzie, I.S., Sellen, A., and Buxton, W.: A comparison of input devices in
elemental pointing and dragging tasks, In: Proc CHI 1991, pp. 161-166. New York:
ACM (1991).
https://dl.acm.org/doi/pdf/10.1145/108844.108868
|
| 12. | Pedersen, E.W. and Hornbæk, K.: An experimental comparison of touch
interaction on vertical and horizontal surfaces, In: Proc NordiCHI 2012, pp.
370-379. New York: ACM (2012).
https://doi.org/10.1145/2399016.2399074
|
| 13. | Shneiderman, B.: Direct manipulation: A step beyond programming languages, in
IEEE Computer, pp. 57-69. (1983, August).
https://www.cl.cam.ac.uk/~pr10/iui/shneiderman83.pdf
|
| 14. | Song, H.T., Clawson, J., and Radu, I.: Updating Fitts' law to account for
small targets, Int J Human-Computer Interaction, 28, 433-444 (2012).
https://doi.org/10.1080/10447318.2011.618096
|
| 15. | Soukoreff, R.W. and MacKenzie, I.S.: Towards a standard for pointing device
evaluation: Perspectives on 27 years of Fitts' law research in HCI, Int J
Human-Computer Studies, 61, 751-789 (2004).
https://doi.org/10.1016/j.ijhcs.2004.09.001
|
| 16. | Welford, A.T.: Fundamentals of skill. Methuen (1968).
https://gwern.net/doc/psychology/1968-welford-fundamentalsofskill.pdf
|
| 17. | Wobbrock, J.O. and Gajos, K.Z.: A comparison of area pointing and goal
crossing for people with and without motor impairments, In: Proc ASSETS 2007, pp.
3-10. New York: ACM (2007).
https://doi.org/10.1145/1296843.1296847
|
| 18. | Zhai, S.: Characterizing computer input with Fitts' law parameters: The information and non-information aspects of pointing, Int J Human-Computer Studies, 61, 791-801 (2004). https://doi.org/10.1016/j.ijhcs.2004.09.006 |
-----
Footnotes:
1 To be clear, the examples are not necessarily wrong. They are given and distinguished only to reveal inconsistencies in the literature.
2 A possible exception is the stylus. Performance with a stylus is generally as good as, or sometimes slightly better than, a mouse [11].