[updated Jan. 2021]
The JavaFX library is a good resource for making graphs. There are 8 basic graph types in JavaFX (Edencode link); Oracle tutorial link)
Getting started in Java is more difficult than in Matlab. Want graphics? You'll need JavaFX. That means first undertaking three steps:
- Download and install an IDE (e.g. IntelliJ),
- Download and install a Java Software Development Kit (JDK) (e.g. Adopt Open version 14)
- Download and install the JavaFX library.
I'm going to assume that you've done all three of these already.
Next, follow the tutorial on YouTube: https://youtu.be/6dSWCVOHJ_U (older, slightly different alternative: https://www.youtube.com/watch?v=BHj6zbH3inI)
Example 1. Create a simple "Hello World" window with JavaFX
- Start a new JavaFX project in IntelliJ.
- Create New Project
- Select "Java FX"
- then, within your SDK (14, in my case), make sure "JavaFX Application" is selected. At the bottom of the window it should say "Simple JavaFX 2.0 application that includes..."
- Make up a project name
- Don't use underscores in the name as IntelliJ may replace the underscores in other elements with periods... may have unintended consequences
- Use "CamelCase" in your naming, instead. For example, LikeThisIsAnExampleOfCamelCase.
- IntelliJ will then build the project & files, giving you a class called "Controller" in a file called "Controller.java"
- Navigate to the main method.
- Project menu (left side of screen) -> src -> sample -> Main
- the Main.java file should be open in your editor. You should see the Main class and main method here.
- Project menu (left side of screen) -> src -> sample -> Main
- Then, link to the actual JavaFX libraries / support files:
- Make sure that your project uses using the correct Java SDK (JDK):
- Project: File->Project Structure->Project
- Project SDK and Project Language level settings: make sure you've got the Java SDK Version 14 selected here
- Modules: File->Project Structure->Modules
- Language Level setting: make sure you've got the Java SDK Version 14 selected here
- Project: File->Project Structure->Project
- Point your project to JavaFX a first time:
- File->Project Structure->Global Libraries
- Right-click on javafx-swt
- Select "add to modules"
- select the name of the project. It should be selected by default. Just click "OK" when prompted.
- Click on "OK" to get out of the Project Structure window
- Find the location of your JavaFX "lib" folder. In my case, it's at /Users/jasmith/Documents/java/javafx-sdk-11.0.2/lib (modify the folder path to match settings on your own computer)
- Click OK a bunch of times... Click through any further prompts you get from IntelliJ by selecting the defaults in presents to you.
- Right-click on javafx-swt
- File->Project Structure->Global Libraries
- Point your project to JavaFX a second time:
- Run->Edit Configurations -> VM Options:
- Inside the textbook for VM Options type in the following:
- --module-path /Users/jasmith/Documents/java/javafx-sdk-11.0.2/lib --add-modules javafx.controls,javafx.fxml
- In the above text it's important that you modify the text that I coloured in blue. You need to modify the folder path to match your own computer's JavaFX SDK location.
- Inside the textbook for VM Options type in the following:
- Run->Edit Configurations -> VM Options:
- Make sure that your project uses using the correct Java SDK (JDK):
Example 2. Extend the Intro to make a line chart
There are some good examples of line charts, a favourite among engineers, here: https://docs.oracle.com/javafx/2/charts/line-chart.htm . So, given that we have an example of such a chart, but Example 1, above, is just a boring, blank Hello World example, what would I need to do to make it work?
- Bring over some of the import statements from teh chart example. You can bring in all of them, but you'll see (because they'll get greyed-out in your project) that you only need three: javafx.scene.chart.LineChart, NumberAxis and XYChart.
- Comment out the lines in your existing project that start with "primaryStage": primaryStage.setTitle..., primaryStage.setScene..., and primaryStage.show().
- Copy all of the lines inside the curly braces of the method start() from the Oracle example, from stage.setTitle("Lin... all the way to ... stage.show().
- Paste in those copied lines into your start() method from just below the commented line //primaryStage.show(); ... all the way to the final curly brace in that method.
- Replace "stage." inside that method with "primaryStage."
Compile and then run. You'll have a line chart.
- Copy and paste from another sample JavaFX project like this one: https://docs.oracle.com/javafx/2/charts/line-chart.htm#CIHGBCFI . Make the following changes:
- Add this at the top: package sample
package sample; // add this
- Modify the name of the class to: Main
public class Main extends Application { // Main
- Add this at the top: package sample
Now you can click on the Run button and a graph will pop up.
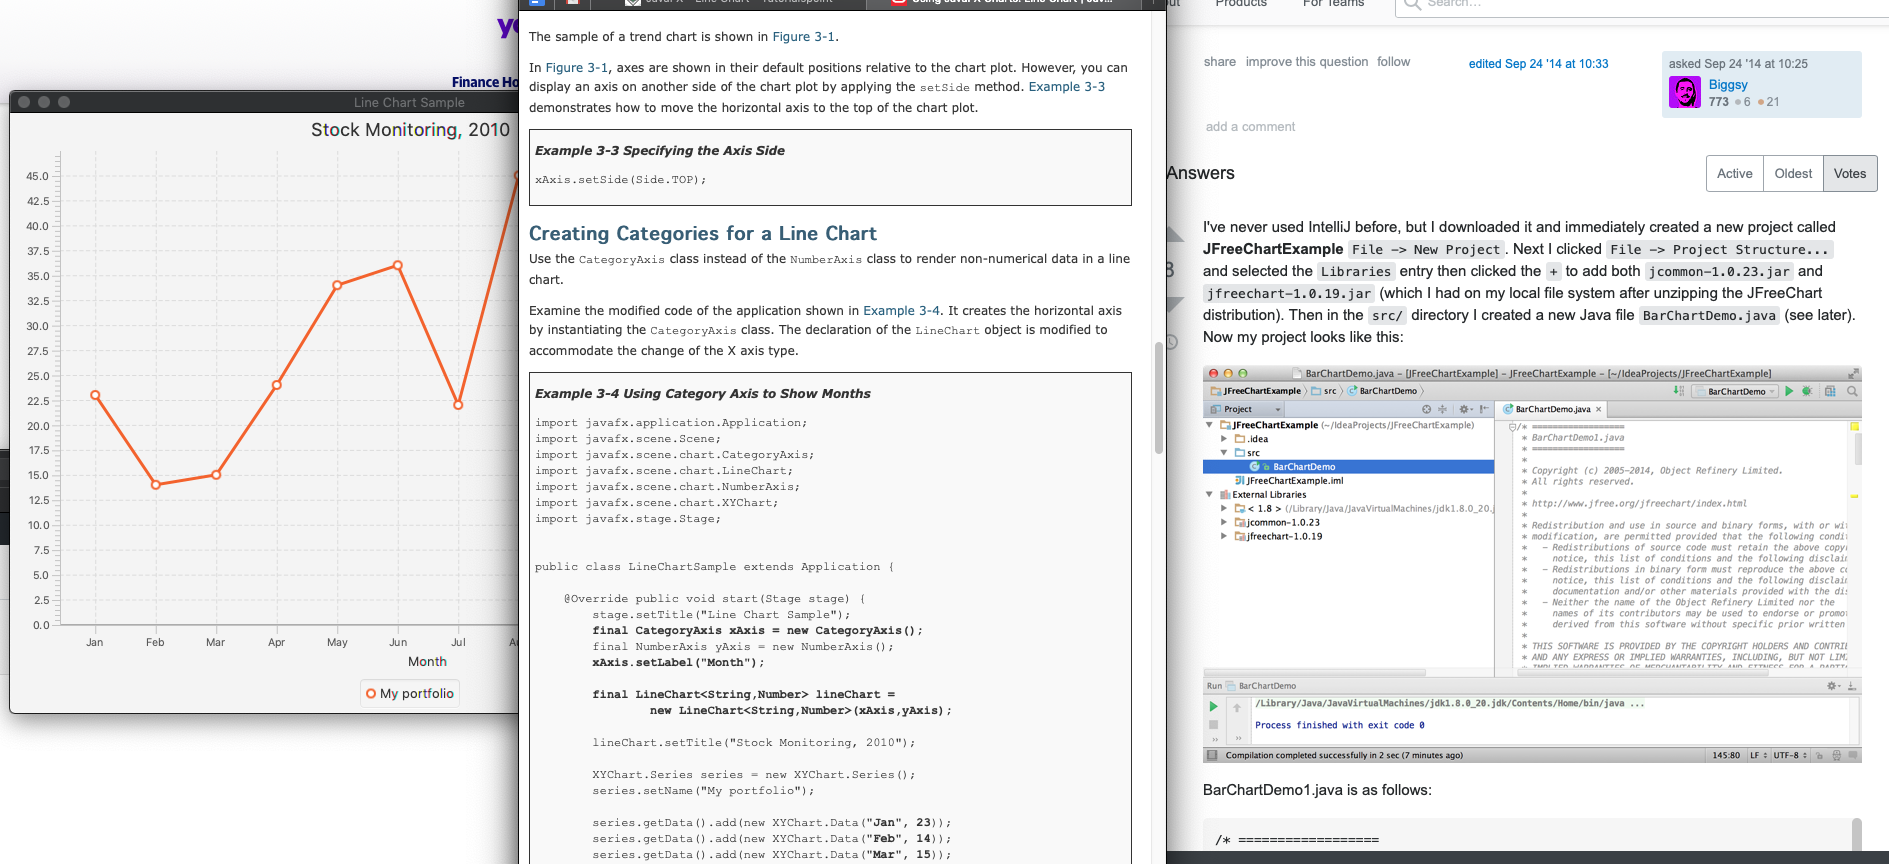
JavaFX chart example in IntelliJ.
This is harder than getting up and running with Matlab. I'll likely need to make these steps very explicit for BOTH Windows and Mac users in EECS 1021.
Next up, examples for MIDI, more graphs and serial ports.
James Andrew Smith is an associate professor in Electrical Engineering and Computer Science Department in York University's Lassonde School. He lived in Strasbourg, France and taught at the INSA Strasbourg and Hochschule Karlsruhe while on sabbatical in 2018-19 with his wife and kids. Some of his other blog posts discuss the family's sabbatical year, from both personal and professional perspectives.