It is easy to set up a Dashboard with only the information that is important to you, presented in a visual format! As a bonus, you can create more than one and share those you have set up with your peers. You can also create a dashboard then schedule an automatic email for you or set recipients to receive the data at set intervals.
About GA's dashboards
To find your dashboards look to GA's left-navigation. It is the first option and labeled 'Dashboards'. When you click on it, it will expand to show 'Private' (which will expand to list any dashboards you have created,) and '+ New Dashboard'. Once you have shared a dashboard you have created, you will also see listed 'Shared' (which will expand to list any dashboards you have shared with your peers).
Remember to try to avoid using Dashboards as a place to dump data. Instead, organize your Dashboard(s) to display data that can help you reflect on whether or not you are meeting your web strategy goals!
About Widgets
All Dashboards are a collection of Widgets. Widgets are modules of data that you can customize on your Dashboard. When you hover over a Dashboard 'Widget', a pencil icon and an 'X' icon will appear in the upper-right corner.
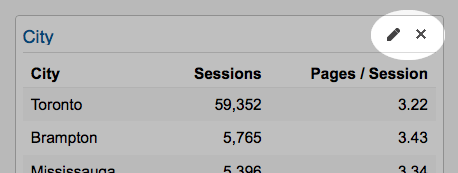
- If you click on the pencil icon, you will be able to edit the Widget as it appears on this Dashboard (not across all Dashboards or across the entire York University account);
- If you click on the 'X' icon, you will be prompted to delete the Widget on this Dashboard (but not across all Dashboards or across the entire York University account)
How to set up a dashboard:
- Expand the 'Dashboards' option in GA's left-navigation.
- Click on '+ New Dashboard'. A pop-up window will appear with two options: a 'Blank Canvas' (with no defaults) and a 'Starter Dashboard' with some defaults you can edit.
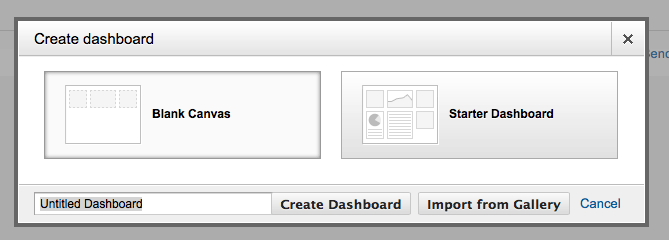
- If you are new to working with Dashboards, select 'Starter Dashboard' -- this will give you a dashboard with some initial settings options already done for you. You will also be able to edit them, and play around with your settings.
Alternatively, if you're comfortable and want to start from scratch, select 'Blank Canvas'.Remember: if you're not happy with things, you can always delete your dashboard and start over! No data will be lost as Dashboards are simply a way to display organized data. - Name your dashboard in the 'Untitled Dashboard' field (name it descriptively so you will be able to recognize it in a list later!) and click 'Create Dashboard'.
Google also provides a gallery of pre-made dashboards shared by users across the web. These dashboards may or may not be of use to you and are interesting to learn from! To view them, click on 'Import from Gallery'.
Working with a 'Starter Dashboard'
By default, a 'Starter Dashboard' comes with the following Widgets pre-set:
- New Users
- Users
- Sessions
- Sessions by Browser
- Goal Completions
- Revenue
Some of these may be useful for you, but some may not (eg. 'Revenue'.)If a Widget is not relevant, you can delete it from your Dashboard (see below).
When you click on the title of the Widget, it will take you to the report the data has been linked to. That report may give you more detail about what that data. For example, when you click the title on the default 'New Users' Widget, you go to an 'Acquisition Overview' page. You can change the link by editing the Widget settings (see below).
Editing Widgets
When you click on the pencil icon, you will see a pop-up window that displays the current set-up of the Widget.
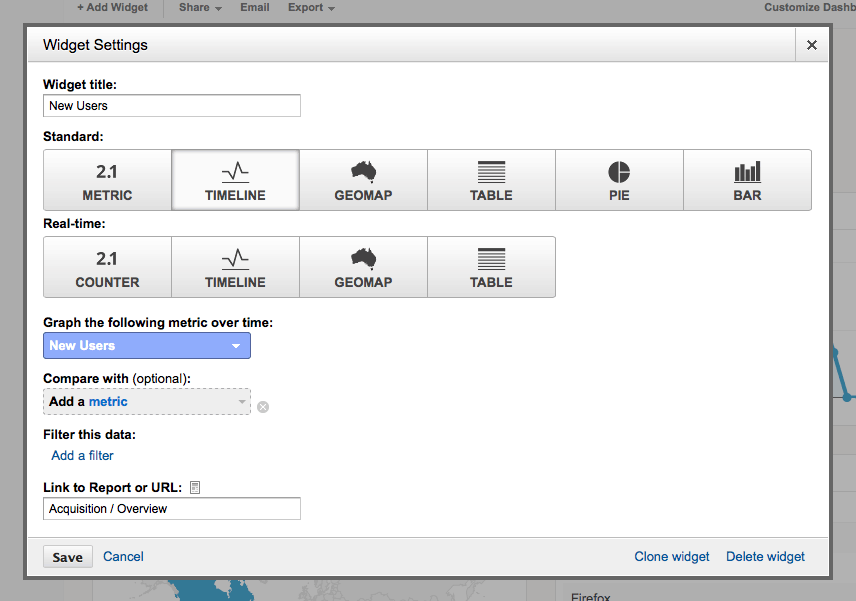
You can tweak any of the pre-existing settings. You can also add a metric and / or a filter to further customize the Widget to your needs. If you choose to do so, try to adjust the 'Link to Report or URL' appropriately so when you check your dashboard, you can click on a Widget and go directly to that report in the account.
When you are satisfied, click 'Save' and you will return to your Dashboard. You can also copy the Widget by clicking on 'Clone Widget'.
Deleting Widgets
There are two ways to remove a Widget from your Dashboard:
- Click on the 'X' icon when you hover over a given Widget; or
- Click on the pencil icon when you hover over a given Widget and open up the pop-up window; click on 'Delete widget' in the lower-right corner of the window.
This will only delete the selected Widget from the given Dashboard. It will not delete it from any Dashboard you previously shared. It will also not delete it from any other Dashboard in your collection or the York University account.
Adding Widgets
There are two ways to add information to a Dashboard:
- When viewing a report in your Google Analytics account, you can click on 'Add to Dashboard' at the top of the report. (This will prompt you to select which Dashboard it should be added to but once selected it will be added with all default information).
- To add a Widget to your Dashboard manually, click on '+ Add Widget' in the upper-right corner of your Dashboard. This will open up a pop-up window that includes any options available to you to use. These options are just like those you have when you edit a pre-existing Widget only there are no values pre-set. When you are satisfied with the settings you have adjusted, click 'Save' and you will return to your Dashboard. You can also copy the Widget by clicking on 'Clone Widget'.
About Sharing Dashboards
If you have set up a customized Dashboard that one of your colleagues is interested in, you can share it by following these steps:
- Click on the 'Share' button at the top of a Dashboard page - a drop-down list will appear with your options.
- To share a Dashboard privately, click 'Share Template Link'
- NOT RECOMMENDED: To share with everyone with access to Google Analytics including those outside of York, click 'Share in Solutions Gallery'.
- You will then be prompted on how to proceed.
If you'd like to share data reports with someone without access to GA, you can export or email it to them.