As my deadline for producing teaching material for the PIC16 boards at INSA Strasbourg approaches, I'm running into real world debugging issues. Now, it's important to point out that I'm trying to make sure that my teaching material is debugging-focused and provides an opportunity for self-directed learning.
Stepping through code on the PIC16 on real hardware requires some creative thinking for setting and releasing breakpoints
The first attempts at running a program on the PIC16 (PIC16F1619 or PIC16F84A) were in simulation because it's just easier to do it that way. What I failed to take into account is that the simulator provides unlimited breakpoints, permitting the use of the "Step Over", "Step Into" and "Run to Cursor" debugging functions. The '84A simulator permits the breakpoints, but the real chip does not AT ALL using the PICKit3 (I think that it might with the REAL ICE, which I have, but the students won't, so it's a non-starter). The newer '1619 provides a SINGLE breakpoint in real hardware, even on the Curiosity board from Microchip. So I can halt once at the breakpoint, but it appears that to proceed with stepping through the code I have to remove the current breakpoint (after the halt) and then apply the breakpoint somewhere else. I don't remember having to do this with the Freescale / NXP 9s12 or with the NXP FRDM / Kinetis boards. Kind of a pain in the rear, but better than no breakpoints at all!
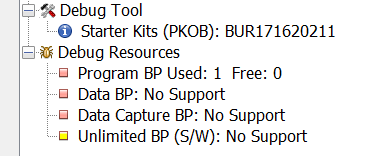
The PIC16F1619 (a newer PIC16 with the F1 core) only has one breakpoint, as shown in the MPLAB X project details. It's better than the '84A, which has no breakpoints at all!
Now, I can halt on a breakpoint, remove the breakpoint, add another one later in the code and then proceed (continue) to it. That works for me.
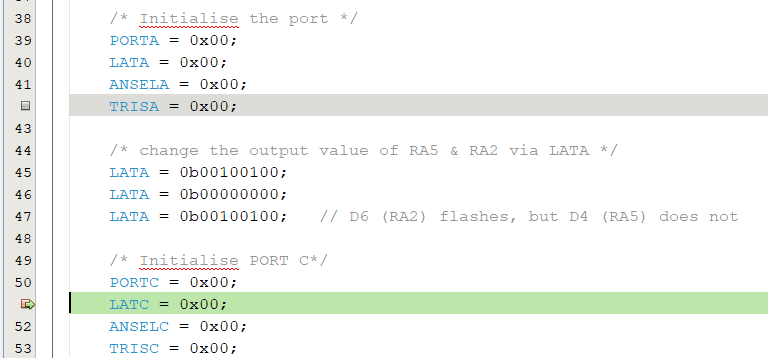
Better than that, I've confirmed that I can change the Latch registers live while debugging, by accessing the SFRs view (Window -> Target Memory Views -> SFRs), as you can see below.
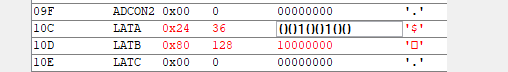
Change the LATA register by hand, using the Special Function Register (SFR) view while debugging live.
When changing LATA's bit 2 (corresponding to RA2) the LED on the Curiosity board (LED D6) changes. Make that bit a '1' and the LED turns on. Make that bit a '0' and the LED turns off. (make sure to hit the "enter" or "return" key to register the change with the chip) Why is this important? Because it permits a student (or me!) to examine a single bit of a single register, as well as to modify it and to see if it has an immediate change. This can be a really powerful learning tool when trying to understand the concept of "bit twiddling" that experienced engineers and computer scientists take for granted.
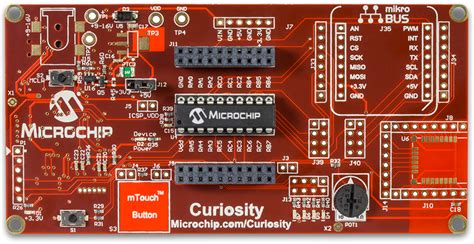
The 8 bit Microchip Curiosity board with the PIC16F1619 (c/o Microchip http://microchipdeveloper.com/touch:lowpincount-curiosity)
All this to say that using the MPLAB simulator is great and all, but nothing beats trying it out on real hardware!