By default, Google Analytics is set to show the past month's worth of data in a report. To find out the date range being applied to the reports you view:
- Log into Google Analytics with your Google ID
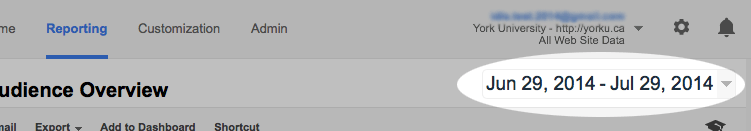
- In the top-right corner of any page, will be a date range. What is shown is the range being applied to any report you will view.
To change the date range:
- Click on the arrow at the right corner of the date range. A calendar will appear:
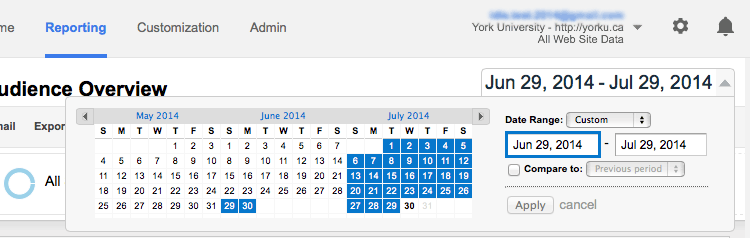
- Select the beginning of your new date range by either clicking on the calendar and the date you'd like to begin with, or by typing in the date in the date box (highlighted in blue in the image above.)
- Select the end date by either clicking on the calendar and the date you'd like to end with, or by typing in the date in the second date box.
- Click on 'Apply' and the new date range will be applied.
To compare two date ranges:
You can also apply a second date range to a report. This will display the results from two date ranges in two different colours.
- In the calendar window, select your first date range by following steps 1 to 3 listed above.
- Click on the box under the date range, next to 'Compare to:'

- The system defaults to displaying the previous period (in this case, the month before the month selected.) You can change this by clicking on the drop-down and selecting 'Custom'.
- Select the beginning of your new date range by either clicking on the calendar and the date you'd like to begin with, or by typing in the date in the date box below the 'Compare to:' line.
- Select the end date by either clicking on the calendar and the date you'd like to end with, or by typing in the date in the second date box.
- Click on 'Apply' and the new date range will be applied.