When you initially log into Google Analytics (GA) with your Google ID, you will be given a list of all accounts you have access to.
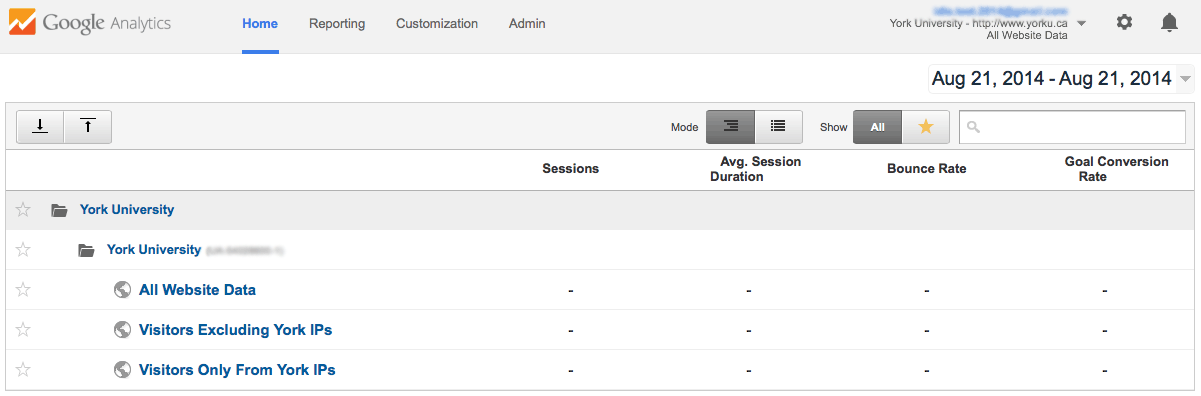
Each account can be expanded to show all the Views you have access to. Select the appropriate View to check the data collected for your account.
Data layout
When selected, each Views within GA have a top bar that include:
- the Google Analytics logo which links back to this page;
- a 'Home' link that also links to this page;
- a 'Reporting' link that initially takes you to an Audience Overview page, but that may later take you to the last data set you were analyzing when dealing with this account;
- a 'Customization' link that takes you to a section where you can customize your data specifically to your needs;
- an 'Admin' link that, depending on your level of access, allows you to tinker with your account set-up, see what filters have been applied to your account, find a copy of your tracking code, etc.;
- a list of what account you are logged in as and what account you are viewing (handy when you deal with multiple accounts;
- a cog icon that allows you to edit your account settings; and
- a bell icon that indicates alerts when necessary.
Under this grey bar, on the right-side of the page, is a date-range selector. Use this to select the beginning and end of the time you would like your report to span. When you click on it, a window will open up with two calendars -- the first date you select will, by default, become your start date and the second, your end date. Click 'Apply' to finalize your selection.
Report Views
When you select your account to view, you will initially land on an Audience Overview page. This is a display that Google has determined is the information that may be of interest to you.
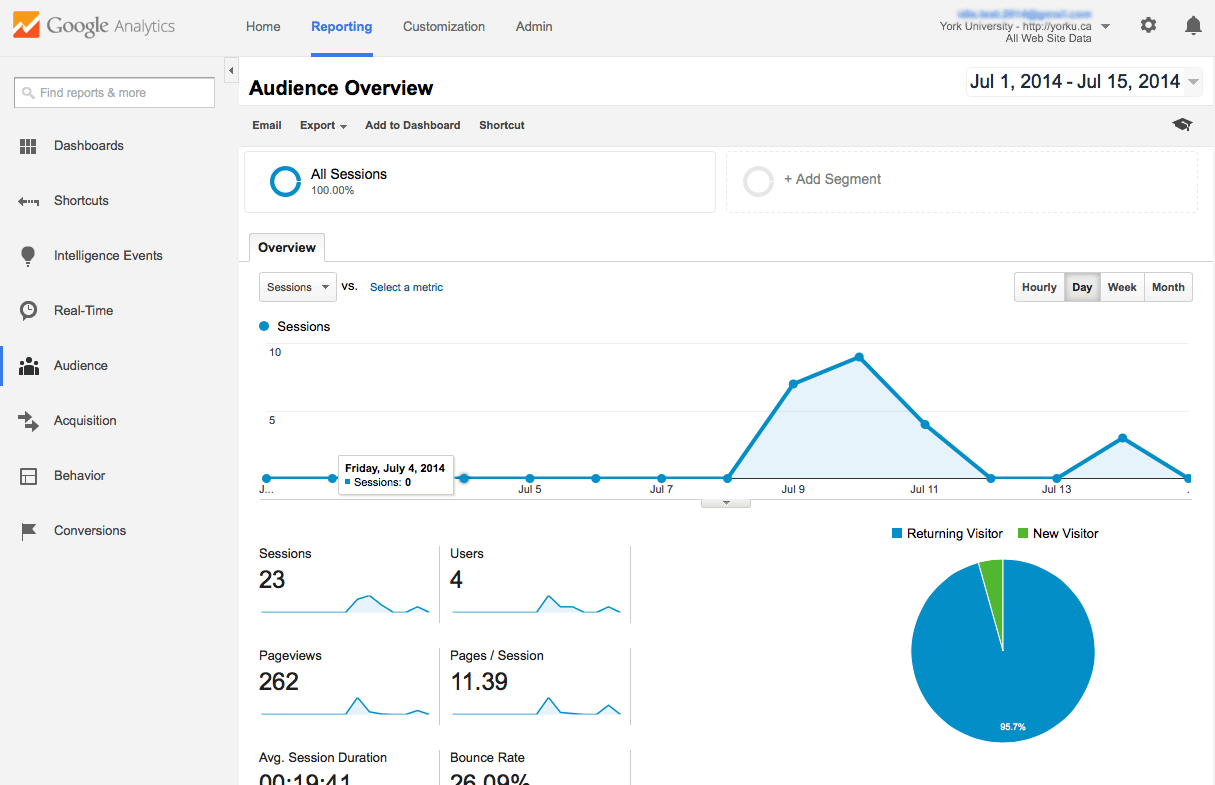
At this point, you will now have a left-navigation filled with options for you to use. Each will expand to more options. The groups are as follows:
- Dashboards: a customizable section where you can compare different reports on a single page; multiple dashboards can be created and shared
- Shortcuts: similar to Bookmarks in your browser, you can save the reports you visit the most and they will be found here
- Intelligence Events: once configured, this area displays alerts when a metric for a segment deviates from the expected range
- Real-Time: shows visitor data for your website as it is occuring right now
- Audience: information about your visitors
- Acquisition: information about where your visitors came from / how they found your site
- Behavior: information about your visitor's actions once on your site
- Conversions: indications of whether or not your visitors are accomplishing a series of tasks you set out for them (this section's elements require set-up)
Take your data with you
Under the title of the page you are on will usually appear a grey bar with 'Email', 'Export', 'Add to Dashboard', and 'Shortcut' listed.
- Email is used to send the content of the page you are on to a recipient;
- Click on 'Export' and a selection of file options will drop-down -- select one, and you will then be prompted on where to save the file;
- Add to Dashboard allows you to add the report you are viewing to a dashboard in the 'Dashboard' section of your left-navigation; and
- Shortcut will bookmark the report you are on to the 'Shortcut' section of your left-navigation.
Full details about how to take your data with you can be found on the Export Data & Schedule Emails page.