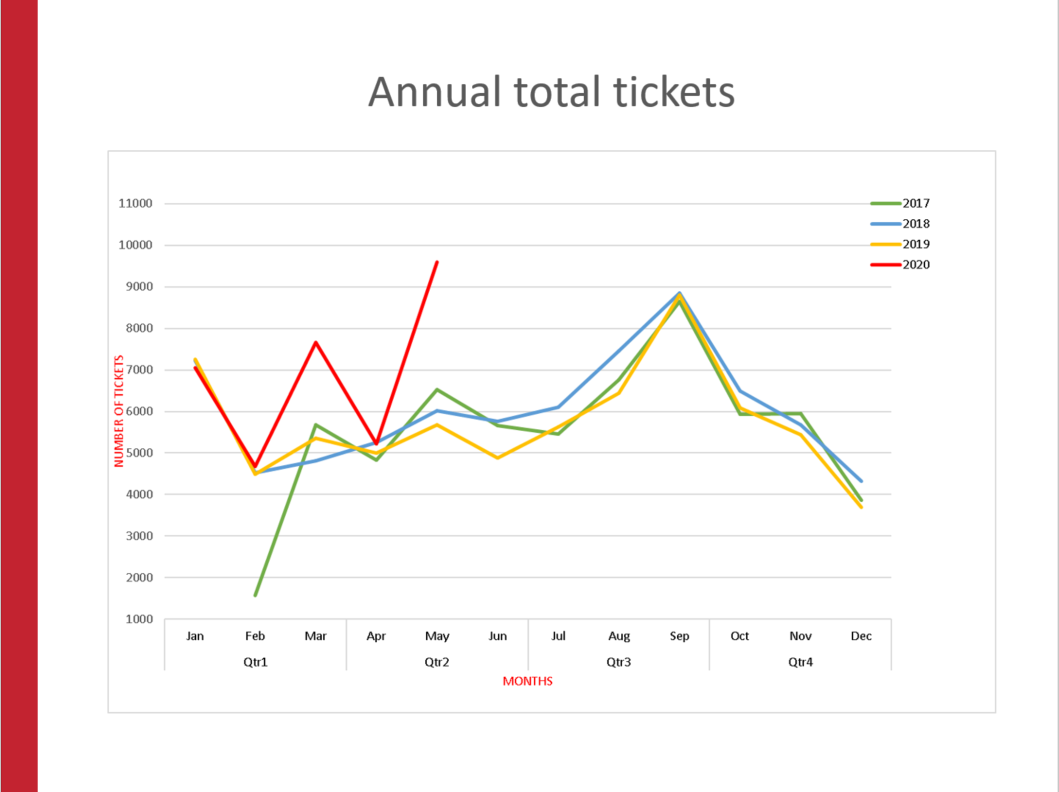
Annual Total Tickets
The total number of service tickets received over a 13 month time frame.
Monthly Incidents and Service Requests
The total number of service tickets from year to year.
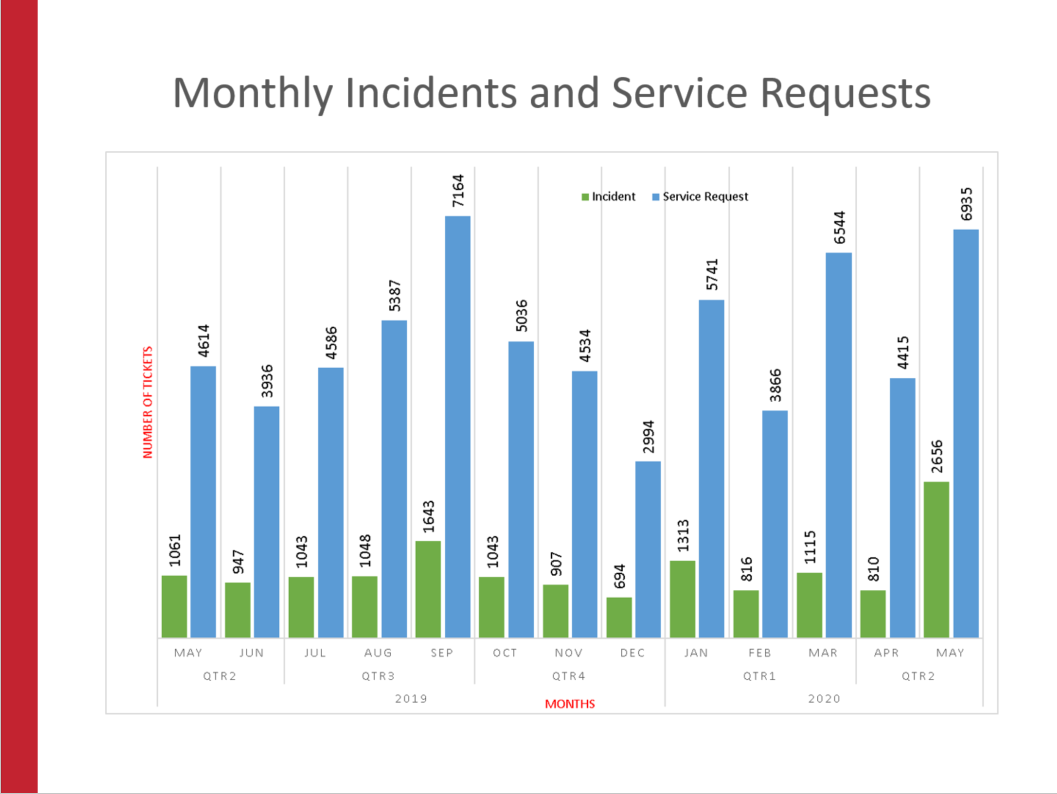
The total number of service tickets received over a 13 month time frame.
The total number of service tickets from year to year.